

Significance
Dysfunction of lymphatic drainage results in significant morbidity in millions of patients each year, and there are currently no pharmacological treatments available. Because a mechanistic understanding of lymphatic control has been elusive, it has not been possible to develop effective, targeted therapies to alleviate lymphedema or facilitate immune cell trafficking in lymphatic pathologies. Here, we show that complementary biological oscillators control lymphatic transport, driven by mechanosensitive calcium and nitric oxide (NO) dynamics. The mechanism shows fascinating adaptability and autoregulation, inducing active pumping of the lymphatic vessels when gravity opposes flow, but vessel relaxation when pressures are able to drive flow passively.
Keywords: lymphatic, mechanobiology, computational model, control, biological oscillator
Abstract
The ability of cells to sense and respond to physical forces has been recognized for decades, but researchers are only beginning to appreciate the fundamental importance of mechanical signals in biology. At the larger scale, there has been increased interest in the collective organization of cells and their ability to produce complex, “emergent” behaviors. Often, these complex behaviors result in tissue-level control mechanisms that manifest as biological oscillators, such as observed in fireflies, heartbeats, and circadian rhythms. In many cases, these complex, collective behaviors are controlled—at least in part—by physical forces imposed on the tissue or created by the cells. Here, we use mathematical simulations to show that two complementary mechanobiological oscillators are sufficient to control fluid transport in the lymphatic system: Ca2+-mediated contractions can be triggered by vessel stretch, whereas nitric oxide produced in response to the resulting fluid shear stress causes the lymphatic vessel to relax locally. Our model predicts that the Ca2+ and NO levels alternate spatiotemporally, establishing complementary feedback loops, and that the resulting phasic contractions drive lymph flow. We show that this mechanism is self-regulating and robust over a range of fluid pressure environments, allowing the lymphatic vessels to provide pumping when needed but remain open when flow can be driven by tissue pressure or gravity. Our simulations accurately reproduce the responses to pressure challenges and signaling pathway manipulations observed experimentally, providing an integrated conceptual framework for lymphatic function.
Flow of fluid within the lymphatic system is central to many aspects of physiology, including fluid homeostasis and immune function, and poor lymphatic drainage results in significant morbidity in millions of patients each year (1). Although it is known that various mechanical and chemical perturbations can affect lymphatic pumping, there are still no pharmacological therapies for lymphatic pathologies. A fundamental understanding of how various signals coordinate lymphatic vessel function is a necessary first step toward development of treatments to restore fluid balance and enhance immunosurveillance.
The lymphatic system consists of fluid-absorbing initial lymphatic vessels that converge to collecting lymphatic vessels, which transport lymph through lymph nodes and back to the blood circulation (2). The collecting lymphatic vessels actively transport fluid via contractions of their muscle-invested walls. Unidirectional flow is achieved by intraluminal valves that limit back flow. Unfortunately, lymphatic pumping is not always operational, and this can lead to lymphedema and immune dysfunction (3, 4).
Much is known about the mechanisms responsible for the contractions of the vessel wall. As in blood vessels, the muscle cells that line lymphatic vessels respond to changes in Ca2+ concentration. Membrane depolarization results in an influx of Ca2+ to initiate the contractions, and this process can be modulated by neurotransmitters (5) or inflammatory mediators, which generally alter the frequency and amplitude of lymphatic pumping (4, 6). Many studies have also reported that physical distension, either by applying isometric stretch or by pressurizing the vessel can affect the phasic contractions (7–10). Interestingly, endothelial (11) and smooth muscle cells (12) have stretch-activated ion channels that can initiate Ca2+ mobilization in response to mechanical stresses. Thus, stretch may constitute an important trigger for the contraction phase of a pumping cycle.
There are also complementary mechanisms for tempering the Ca2+-dependent contractions. The most notable is nitric oxide (NO), a vasodilator that acts at multiple points in the Ca2+-contraction pathway to modulate Ca2+ release and uptake, as well as the enzymes responsible for force production (13). Blocking or enhancing NO activity can dramatically affect pumping behavior (4, 14–17). Furthermore, lymphatic endothelial cells produce NO in response to fluid flow (16, 18, 19). Importantly, NO dynamics are faster than observed pumping frequencies, so flow-induced NO production is another potential mechanosignal involved in lymphatic regulation (20).
Model Formulation
We hypothesized that Ca2+ and NO cooperate to control lymphatic transport via mechanobiological feedback loops: during a lymphatic contraction cycle, increased shear causes local endothelial NOS (eNOS) activation, and the subsequent production of NO results in blunting and/or reversal of the Ca2+-dependent contraction. As the vessel relaxes, NO degrades rapidly and its production drops due to the reduced fluid velocity in the now larger-diameter vessel. Meanwhile membrane potentials and resting calcium levels are restored in preparation for another contraction. The next contraction can be triggered by any signal able to initiate the Ca2+ mobilization, including opening of stretch-activated channels, neurotransmitters, or Ca2+ flux through gap junctions of neighboring cells (Fig. 1A).
Fig. 1.
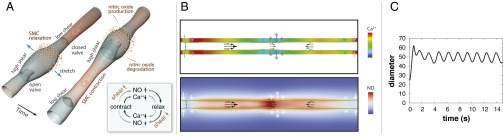
Dynamics of lymphatic pumping. (A) Conceptual scheme, showing two different snapshots of cyclic lymphatic pumping. Flow direction is from Bottom Left to Top Right. Nitric oxide relaxes the vessel wall, increasing vessel diameter and pulling fluid from upstream. As the lymphangion fills, the upstream valve is open, and the downstream valve is closed. When the lymphangion is filled, flow and shear stress decrease, and NO is degraded; a subsequent contraction can be initiated through Ca2+ influx via stretch-, voltage-, or ion-activated channels. The contraction closes the upstream valve and opens the downstream valve, increases wall shear stress, and induces NO production locally, thus starting the cycle again (NO: orange; cytosolic Ca2+: red). Depending on the biochemical and fluid environment, this basic mechanism can be tuned to produce various frequencies and amplitudes. (B) Snapshot of the simulated system. The vessel boundary is indicated by the green line. Instantaneous Ca2+ and NO concentrations are shown in the Top and Bottom color maps, respectively. The flow field is represented by the black arrows, and the current wall velocity is shown in the gray/white double arrows. Valves are located at each end, and at center. (C) Pumping dynamics predicted by the model. At t = 0, flow is initiated by a mechanical perturbation. The system quickly stabilizes and subsequent pumping is self-sustained.
To test whether this scheme is sufficient to produce the complex behaviors observed for lymphatic vessels in experiments, we created a multiscale, mechanistic mathematical model. The underlying assumptions of the model are based on well-documented experimental findings as follows: (i) Lymphatic contractions are mediated by Ca2+ influx in the lymphatic muscle cell cytosol, which culminates in myosin light chain phosphorylation and induction of the myosin–actin cross-bridges (6, 21–23) (Supporting Information). (ii) The lymphatic muscle contractile force increases with cytosolic Ca2+ concentration (with saturating kinetics); the maximum possible force decreases with the radius (to reproduce the known length–force relationship) (22–26). (iii) Ca2+ accumulates in the cytosol at a constant, slow rate (i.e., influx through T-type channels) (23, 27, 28) and is depleted via ion pumps (23, 29). (iv) Pressurizing or stretching the vessel can enhance Ca2+ influx (stretch-activated channels) (5, 7, 30). (v) Accumulation of cytosolic Ca2+ in excess of a threshold concentration induces a rapid influx of Ca2+ (reproducing influx into L-type channels and Ca2+-induced Ca2+ release) (5, 6, 23, 28, 30, 31). (vi) Ca2+ diffuses through gap junctions to adjacent lymphatic muscle cells (32–34). (vii) NO can deplete cytosolic Ca2+ and decrease its rate of accumulation (35–37). (viii) NO is produced by endothelium when shear stress exceeds a threshold value (16, 38–40). (ix) NO diffuses and advects, and has a half-life on the order of 1 s (20). (x) The vessel contains intraluminal valves that inhibit backflow and also act as sources of NO (16, 38, 41).
We solve the lymph flow field using the lattice Boltzmann method (42). Moving boundaries are implemented by exchanging momentum at each boundary node with the fluid (43), and the movement of each boundary node is calculated locally by Verlet integration.
The Ca2+ dynamics are calculated by solving a system of differential equations, based on the local vessel radius and NO concentration. NO is produced in the vessel boundary and at the valves by lymphatic endothelial cells. NO acts upon nearby lymphatic muscle cells that wrap around the vessel and are responsible for the contractions (in low NO concentrations) and dilations (in high NO concentrations). Details of the model formulation are described in Supporting Information.
Formulation of the Computational Model (see Table S1 for Summary of Model Parameters)
We propose that sustained cyclic pumping by collecting lymphatics can be modeled by the following mathematical framework (i) the vessel wall moves; the new position of each boundary point is calculated based on the Ca2+- and NO-controlled contraction and the resistance due to viscoelastic forces; (ii) the wall transfers momentum to the fluid, changing the local fluid pressure and velocity as well as the shear stresses along the wall; (iii) based on the updated wall shear stress levels, NO can be produced, and its new distribution is calculated; and (iv) forces on the wall change according to the new NO and Ca2+ concentrations. The cycle then repeats at (i). Directional flow is made possible by the presence of intraluminal one-way valves, spaced along the collecting lymphatic vessel.
Table S1.
Parameters of the baseline simulation
| Symbol | Value* | Quantity |
| δt | 10−4 s | Time step |
| δx | 1 µm | Lattice constant |
| RCa | 25 µm | Ca radius |
| D1 | 1.5 × 10⁻⁸ | Spring constant |
| D2 | 5 × 10⁻⁶ | Mechanical coupling |
| l0 | 10.0 | Force length |
| ν | 0.00030 | Internal friction coefficient |
| D | 0.08 = 800 µm2/s | NO diffusion coefficient |
| λNO | 0.7 s | NO half-life |
| λCa | 0.3 s | Ca half-life |
| kM | 4 × 10⁻⁶ | Force constant for Ca† |
| ρin | 0.75 | Inlet density |
| kP | 2 × 10⁻⁶ | Local pressure coupling constant† |
| FP | 0.9 × 10⁻⁶ | Global pressure†,‡ |
In lattice units, if not specified otherwise. Real values are given to enable a comparison with experimental data.
To compare shown values with measured data, we can assume that 0.2 × 10−6 = 1 cmH2O. Therefore, the maximum pressure that can be produced equals kM = 20 cmH2O.
For better readability, we leave out the factor of 10−7 when referring to transwall pressure in the main text.
Because the aim is to understand whether such a system is able to steer efficient lymphatic pumping, we approach the problem by including all of the necessary components, but simplify the tissue mechanics and chemical kinetics. To simulate such a model, the following components are needed: (i) a flow solver to calculate the local shear stress that can handle moving boundaries, (ii) a solver for the Ca2+ and NO dynamics, and (iii) a solver for the motion of the boundary.
The lymphatic vessel can be represented by a pipe with changing radius R. We assume that lymph is an incompressible Newtonian fluid, so we solve the following:
| [S1] |
with being the fluid velocity; η the viscosity; t, the time; and , a body force. The boundary condition at the wall is a no-slip condition,
| [S2] |
where vwall is the velocity of the boundary. We assume that the wall moves in response to local forces. Passive forces are governed by a viscoelastic model, active forces by the Ca2+ and NO concentrations. The dynamics of NO are governed by reaction, diffusion, and advection as discussed later in this supplement. However, because all of the different components interact with each other, a general analytic solution is not possible.
We solve the flow field using the lattice Boltzmann (LB) method. The LB method (71), based on Boltzmann’s transport equation, allows full resolution of the hydrodynamics (42). It is also well suited for flow in complex, changing geometries. The Reynolds number is small in these vessels; nevertheless, the LB method intrinsically incorporates the fluid inertia. Moving boundaries are implemented by exchanging momentum at each boundary node with the fluid (43). The movement of every boundary node is calculated locally by Verlet integration; i.e., each node is represented by a quasiparticle that follows Newton’s laws.
The Ca2+ dynamics are calculated by solving a system of differential equations, based on the local vessel radius and NO concentration. NO is produced in the vessel boundary and at the valves by lymphatic endothelial cells. NO acts upon nearby lymphatic muscle cells that wrap around the vessel and are responsible for contractions (in low NO concentrations) and relaxation (in high NO concentrations). Because the Péclet number is small, we can handle the NO advection–diffusion–decay with a simple finite difference method including an upwind scheme for the NO advection.
The LB Method.
The core concept of the LB method is to discretize the Boltzmann equation (72) in time, velocity, and real space (71). This means that, instead of having infinitely small phase space elements, one takes into account the single-particle distribution function n(xj, ci, t) only on a lattice site xj, with velocities ci that point to the nearest and next-nearest neighbors. The lattice Boltzmann equation (42) then reads as follows:
| [S3] |
In the implementation used, the position x is discretized on a 2D square lattice with nine discrete velocities ci, i = 0, ..., 8 pointing from a lattice node to its eight neighbors and to itself (designated D2Q9). The left-hand side of Eq. S3 represents the advection of the particles, i.e., the population n(x, ci, t) moves during a time-step δt along its velocity ci to the neighboring lattice point x + ciδt. Commonly, the time step is set to δt = 1 so it is only needed for dimensional reasons. The collision operator Ω represents intermolecular interactions, i.e., collisions between molecules that lead to a redistribution of n(x, ci, t). This redistribution relaxes the single-particle distribution function n toward a local equilibrium neq, while it conserves mass and momentum. The actual shape of the collision operator Ω can differ in the way the equilibrium distribution neq is calculated or how the actual relaxation is realized (42, 73–76). Using the BGK or single relaxation time collision operator, named after P. L. Bhatnagar, E. P. Gross, and M. Krook (77),
| [S4] |
the relaxation of all modes follows a single rate τ. The equilibrium distribution function is given by the following:
| [S5] |
which is a polynomial expansion of the Maxwell distribution. is the speed of sound for the D2Q9 lattice. The weights are given by the length of the corresponding . Relevant macroscopic values are given by the modes of the distribution n:
| [S6] |
is the density, and
| [S7] |
is the macroscopic velocity of the fluid. The momentum flux (including the shear stress) is given by the following:
| [S8] |
The natural units of the system are converted into SI units. Convenient choices are δx = 1 μm for the length and 10−4 s for the time step. This allows better comparison of the simulation results with experimental values.
The boundary conditions can be classified as wall boundaries and inflow boundaries. In our case, the inflow is realized by a constant-pressure boundary condition. It is imposed by first applying periodic boundary conditions during the streaming step and then setting the inflow (respectively, the outflow) equilibrium density to the desired value.
The one-way valves represent special boundaries. They are implemented as a flow resistance that increases when the flow points backward and decreases for forward flow. Such a flow resistance is realized by a so-called partial bounce back scheme (73). Instead of bouncing back the whole velocity distribution as is done for solid walls, only a fraction 0 < ζ < 1 is bounced back while 1 − ζ is streamed through the following:
| [S9] |
Here n*(xb, cin, t) is the post collision distribution population. cin indicates the population that points into the boundary point xb. Accordingly, −cin is the vector pointing out of the boundary. Similar to reports from the literature (78, 79), the factor ζ is calculated as follows:
| [S10] |
with u being the local fluid velocity and u0 being a reference velocity that determines how narrow the function (u) is. max is the maximum resistance, whereas 1 − max is the minimum resistance. Fig. S1A shows the performance of a valve for the different pressure gradients used in the simulations.
Fig. S1.

(A) Relative flow rate Q/Q0 vs. axial pressure gradient ∂P/∂x. Flow through a rigid vessel at various pressure gradients illustrates the effect of the valves, which impose little resistance for forward flow (negative gradients) but high resistance for reverse flow (positive gradients). When NO inhibits vessel contractions, even a vessel with a viscoelastic wall exhibits similar behavior (Fig. 3C). (B) Valve reflection factor ζ dependence on relative velocity. For high flow velocities, the valves are open, but there is high resistance for negative flow.
The moving wall boundaries are implemented by a bounce back condition with an additional term for the momentum transfer:
| [S11] |
The local velocity of the surface is , and are weights depending on the length of . This boundary condition creates no-slip flow at the boundary, while taking into account the boundary’s velocity .
Boundary Movement.
To calculate the movement of the boundary, we assume a line that is discretized in the x direction, on the underling LB grid. Boundary node movement is only allowed in the y direction, perpendicular to the flow (Fig. S2). Each node is calculated separately, considered as a point of mass under the influence of forces caused by the surrounding tissue and the vessel wall. The mass can be set to m = 1, and the forces are realized as accelerations and pressures of each wall segment. We assume that the vessel is contracted by the lymphatic muscle cells around the vessel and widened by the fluid pressure and elastic forces in the tissue. Because the pumping creates pressure in the system, the forces on the wall due to fluid pressure and lymphatic muscle contraction are comparable, and neither dominates over the other under normal conditions. Because we are interested in the control of lymphatic pumping, we simplify the mechanisms that cause the contractions (Fig. S3). We assume that the contraction force is dependent on the cytosolic Ca2+ concentration CCa. NO tends to relax the lymphatic muscle cells (Fig. S3). We can then write the force FM of the lymphatic muscle cell as follows:
| [S12] |
kNO is a constant controlling the strength of the NO inhibition, whereas kM regulates the strength of the contracting force. The force also depends on the current radius R of the vessel, relative to a reference value RCa. A plot illustrating the dependence of these parameters is shown in Fig. S4. The vessel can be expanded by the surrounding tissue or by a transwall pressure gradient. For the elastic component, we assume a linear dependency:
| [S13] |
where R is the radius of the vessel and R0 is a baseline radius. The pressure force is calculated as a constant force FP throughout the vessel, plus the local fluid pressure P(x) = c2ρ(x), resulting in a force FΦ = kP P (x) · A + FP, with A being the area of a lattice point and kP being a constant accounting for the transition between the lattice Boltzmann mass and the mass of the wall. This allows adjustment of the pressure by changing the constant component of the force FP. To maintain the structural integrity of the endothelium, we introduce a force that models the axial coupling of the wall nodes. To transform the forces into the 2D scheme of the simulation, we assume that the movement along the y axis is equivalent to the change of the vessels radius R. The resulting forces on each boundary node are as follows:
-
•
A force FM (CNO, CCa) depending on the Ca and the NO concentrations CCa, CNO;
-
•
A passive force F1, which resists vessel expansion: , with the constant D1, the resting radius R0, and l = R − R0;
-
•
A passive force F2, which imposes wall coupling: F2 = D2 [(l − lm) + (l − lp)], determined by the locations of the neighboring points lm, lp, and the coupling constant D2;
-
•
A passive force to limit the extent of the contractions, , where is the same force constant used for the spring force. The length l0 is the length scale at which the limiting force starts to dominate the harmonic force, F1. A R11 dependence is commonly used to model a steep barrier, as in the Lennard–Jones potential. Other forms (such as exponentials) that introduce a sharp increase produce similar stability;
-
•
The force due to fluid pressure FΦ;
-
•
A viscous friction force Fv = kv·v damps the system (see Fig. 1B for the force scheme).
Fig. S2.

Biomechanical model for the simulations. Each wall node is subjected to FCa, a contraction force dependent on the Ca2+ concentration, and is mechanically coupled to adjacent wall nodes and the extravascular matrix. Transwall fluid pressure opposes the Ca2+ force. NO production induced by fluid shear stress in the endothelium diffuses rapidly to adjacent lymphatic muscle cells and affects the contractions by decreasing FCa and increasing the rate of Ca2+ recharge into stores. Spikes of cytosolic Ca2+ can be induced by wall stretch, or by an influx of Ca2+ from adjacent nodes.
Fig. S3.

Incorporation of NO and Ca2+ mechanisms in the simulations. Ca2+ enters the cytosol through ion channels (L-type, T-type, voltage gated, stretch activated) and acts through myosin light chain kinase (MLCK) to phosphorylate MLC, allowing formation of the myosin–actin cross-bridges and cell contraction. Endothelial cells can produce NO in response to fluid shear stress. The NO acts on adjacent lymphatic muscle cells through soluble guanylyl cyclase (sGC), cGMP, protein kinase G (PKG), and myosin light chain phosphatase (MLCP) to reduce intracellular Ca2+ and dephosphorylate MLC, causing relaxation. The simplified scheme for the model is shown, with contraction force proportional to Ca2+ concentration; NO is assumed to affect the force directly, attenuating the effect of Ca2+, and indirectly, by increasing the depletion of Ca2+.
Fig. S4.

Force production by Ca2+. (A) Relationship between Ca2+ concentration and the contraction force FM for two different NO concentrations. (B) Relationship between FM and NO concentration for two different Ca2+ concentrations.
The actual movement of the boundary is calculated similar to a molecular-dynamics simulation using Verlet integration.
Calcium Dynamics.
The dynamics of the Ca2+ concentration CCa are complicated and a subject of ongoing research (Fig. S3). We assume that the factors influencing the Ca2+ dynamic—for example, Na+ ions or hormone levels—are either constant during the simulation or follow the Ca2+ dynamics. Therefore, they can be incorporated into the existing model parameters. Ca2+ ions originate in the extracellular fluid or in the smooth endoplasmic reticulum (SER). Ions enter the cytosol through ion channels (e.g., T-type or L-type) that are voltage gated and stretch activated. Once a certain potential is reached, the L-type channels open, which in turn activates Ca-dependent Ca channels, further amplifying the response, and a large flux of Ca2+ can enter the cell from extracellular fluid and the SER. The result is a spike in Ca2+ concentration. Ion pumps in the cytoplasmic membrane and SER recharge the system by transporting the ions out of the cytosol, repolarizing the membrane. This reduces the cytosolic Ca2+ concentration.
We model the Ca2+ dynamics by a first-order decay, with the decay constant that is enhanced by the NO concentration . The influence of NO is set by the coupling constant kCa,NO. Calcium enters the cytosol at a baseline rate that we set to . This leads to an equilibrium concentration CCa = 1. In addition, we include a dramatic spike of Ca2+ as the radius R of the vessel exceeds a reference radius RCa. This is realized by an R11 dependency. We also allow calcium-induced calcium fluxes. This is implemented by a 10-fold increase in CCa when the concentration passes a threshold Cthresh. The differential equation for the calcium dynamics is then as follows:
| [S14] |
δ↑ is similar to a Kronecker δ-function but is asymmetric: it takes the value 1 when the calcium concentration threshold is reached from below, but zero otherwise. We chose a R11 dependency for numerical reasons in analogy to a Lennard–Jones potential. Any steep increase would reproduce the same quantitative behavior.
Reaction Diffusion Solver.
NO is produced in the endothelium and at the valves. From there, it diffuses while being advected with the flow. It also decays rapidly. Assuming a typical length scale of L = 80 µm, a diffusion rate of 800 µm2⋅s−1, and a typical velocity u < 10 µm/s, the Péclet number is Pe << 1. The dynamics of the NO concentration CNO are described by the reaction diffusion equation:
| [S15] |
Here, k− is the decay rate of NO and D is the diffusion constant, x is the location, and t is the time. u represents the fluid velocity. This equation is most easily solved using a finite-difference approach, meaning derivatives in space are represented by the difference between the value at position x and the next discrete element x + h. For simplicity, we use the same grid used by the flow solver. To discretize Eq. S15, we use the standard expression for the second derivative. In one dimension, this reads as follows:
| [S16] |
Because we use the LB lattice, the neighbors are given by x + h = x + ci δt. The advection term is solved by a so-called upwind scheme. This means the local derivative ∂x uCNO is calculated either by forward or backward derivation for each component:
for ux (x) > 0:
| [S17] |
and for ux (x) < 0:
| [S18] |
Although the decay of NO is a steady process, the production is locally and temporally limited to boundary nodes, including the valve nodes when the shear rate is above a predesignated threshold σt. At these nodes, NO is produced at a fixed rate. To provide a constant steady-state concentration of NO, the emission rate of NO is chosen to be proportional to the square root of the decay rate. This limits the potential maximum NO concentration. The domain boundaries are chosen to be periodic. However, due to the large system size, the NO concentration reaching the boundary is negligible.
Simulation Setup.
We use a convenient choice to convert lattice units into SI units. The conversion should be seen as an estimate for the order of magnitude of the given values and not as values for an exact case reproduction. We choose δx = 1 µm for the length and δt = 10−4 s for the time step. This means the typical diameter of a vessel is ∼50 µm. The simulated system consists of a straight vessel oriented in the x direction with a numerical check valve placed at the inlet (x = 0) and other check valves positioned equidistantly along the vessel. For the baseline case, one is in the middle and the last one is in front of the outlet. We apply a fixed pressure boundary at the inlet and outlet. Periodic boundary conditions are applied for all other domain boundaries and for NO. If not stated otherwise, the system length is nx = 1,000 µm. The total system height is ny = 300 µm; this allows a sufficient decay of NO to keep finite size effects to a minimum. Simulations ran for . The flow rates were measured at the inflow and time averaged over the last 250 s to minimize transient effects. The reference flow rate, Q0, was measured with an axial pressure gradient of 0 and a transwall pressure of 9. To compare the simulations with physiological flow rates, we transform the 2D geometry into a 3D pipe. For 3D, we use cylindrical coordinates—R for the radius and φ for the azimuth. The problem is invariant in φ. This means the 2D flow profile is equal to the flow profile along R. Therefore, the 3D flow rate Q3D is as follows:
When assuming a 25-μm radius, this results in a comparison flow rate Q0 ∼ 0.005 μL/min. The amplitude traces were averaged between 0.25L, 0.375L, and 0.5L, where L is the length of the vessel. We can identify the pressures as 0.2 × 10−6 = 1 cmH2O. Therefore, the maximum pressure that can be produced equals kM = 20 cmH2O. For better readability, we leave out the factor of 10−7 when referring to transwall pressure in the main text.
Implementation.
The complete code was written in-house using CUDA C, with the gcc-4.4. The code was compiled and executed on an Intel Xenon quad core workstation with a NVIDEA TESLA C2075 GPU.
Experimental Methods
In vivo studies were performed in 5- to 6-wk-old C57BL/6 or C3H mice (4). All mice were bred and maintained in our gnotobiotic animal colony at Massachusetts General Hospital. All procedures were performed following the guidelines of the Institutional Animal Care and Use Committee of the Massachusetts General Hospital.
Oxazolone Treatment.
Mice were anesthetized by i.p. injection of ketamine/xylazine (100/10 mg/kg, i.p.) and shaved. One hundred microliters of 4% (mass/mass) oxazolone (Sigma) in acetone was applied topically to the skin of each leg, making sure the skin area covering the afferent collecting lymphatic vessel to the popliteal lymph node (PLV) was completely covered with OX solution. This led to an inflammatory reaction and edema surrounding the PLV. Intravital microscopy was performed on day 4 after treatment—the time of maximal local edema.
Intravital Microscopy of Lymphatic Pumping.
Mice were anesthetized with ketamine/xylazine (100/10 mg/kg, i.p.) and 2 μL of 2% FITC-Dextran (2 M Mr; Molecular Probes) was injected in the footpad. Five minutes later, the leg skin and underlying connective tissue near the PLV were carefully removed using sterile microsurgical dissection to expose the PLV. The leg of the mouse was immobilized in a 10-cm Petri dish with the exposed lymphatic vessel facing down and submerged in saline. The Petri dish was placed in a customized cell culture water bath incubator to maintain mouse body temperature. Images (360 images separated by 80 ms) were taken with an inverted fluorescence microscope (Olympus) driven by OpenLab software (Improvision). Matlab code developed in-house was used to identify the wall location and track its motion during the contractions.
Results
In the simulations, an initial perturbation causes the vessel to produce self-sustained, cyclic contractions (Fig. 1 B and C). The walls move with a characteristic frequency determined by the Ca2+ and NO kinetics, the fluid pressure, and the wall mechanics (Supporting Information and Movie S1). The mechanobiological feedback causes complementary oscillations in Ca2+ and NO concentrations. Experimentally, oscillations in Ca2+ were identified decades ago (44), whereas the corresponding variation in NO concentration was reported more recently (16, 38). These studies found that the NO concentration varies spatially along the vessel, but also temporally during the contraction cycle, as predicted by the simulations (Fig. 1B and Movies S1–S4).
There are many experimental approaches to test the proposed theory of lymphatic control. The most relevant experiments are those that challenge the system with physiological perturbations that an actual lymphatic vessel would experience in vivo and determine whether the response of the model is appropriate. Therefore, we first tested whether the model can reproduce the results of experiments in mice under baseline conditions and with inflammation. Under normal conditions, phasic contractions in vivo can adopt various amplitudes and frequencies: low-frequency, high-amplitude “strong” pumping, and higher-frequency, lower-amplitude “weak” pumping are typical (Fig. 2A) (4). However, when mice were treated with oxazolone to induce inflammation (4), strong and weak pumping were observed, but a third behavior also appeared—highly dilated vessels with little vasomotion (Fig. 2B). This behavior was likely due to elevated tissue pressure driving flow through the vessel.
Fig. 2.

Multiple pumping behaviors predicted by simulations and observed in vivo (Movies S1–S4). (A) Lymphatic contractions in the mouse hindlimb model occur with a range of frequencies and amplitudes. High-amplitude, low-frequency strong pumping (blue), and lower-amplitude, higher-frequency weak pumping (red) are seen in the collecting lymphatic vessel feeding the popliteal lymph node in C57BL/6 mice (plots are from intravital microscopy of the same mouse at different times). (B) In addition to strong and weak pumping, vessels can dilate and minimize contractions (black line) in response to inflammation induced by oxazolone skin painting. (C) Strong (blue) and weak pumping (red) are reproduced in the simulations by varying the axial pressure gradient. (D) To simulate the multiple behaviors during inflammation, only the baseline diameters and pressure gradient were adjusted. The large-diameter mode with no contractions can be reproduced in the simulations by imposing a driving axial pressure gradient, which induces shear stress, producing NO and maintaining relaxation (black).
In the simulations, we were able to reproduce these behaviors by imposing the physiologically appropriate pressure conditions and baseline diameters. For axial pressures, negative gradients drive flow through the vessel while positive gradients oppose the flow. Applying a moderate axial driving pressure (−10) reproduced weak pumping seen under physiological conditions in the mouse (Fig. 2C, red line). Introducing an opposing pressure gradient (+20) increased the contraction amplitude, similar to the strong pumping case in vivo (Fig. 2C, blue line). To simulate inflammation, the baseline diameter was increased to provide an overall decrease in tone, and then various pressure conditions were applied (Fig. 2D). An opposing pressure gradient (+40) produced large-amplitude pumping as before (blue line), and smaller amplitude pumping was seen with no pressure gradient (red line). Pressure-driven flow (−14) resulted in an open, noncontractile vessel due to high NO production (Fig. 2D, black line). This case simulated leakage of fluid from blood vessels and transmission of pressure to the initial lymphatic vessels—common conditions in inflammation—which help to drive the flow. Note that it was not necessary to reformulate the model or adjust multiple parameters to produce these various behaviors. They emerged naturally due to the mechanobiological feedback in the various pressure environments.
Another approach to test the model is to pharmacologically or genetically disrupt the Ca2+–NO oscillator and see whether the predictions of the theory match experimental observations. Many experiments have shown that blocking NO production has dramatic effects on contractions. This has been done using pharmacological inhibitors (45) and genetically modified mice (4, 45), and by denuding the endothelium to remove the source of NO (46, 47). In experiments with eNOS-deficient mice, contractions are inhibited when the lymphatics are studied in situ (4), but the vessel can be induced to pump by pressurizing the lumen in ex vivo preparations (46, 47). Thus, there is apparently a deficiency introduced by the lack of NO that can be restored by pressurizing the lumen. In our simulations, we can deactivate NO to investigate this question. Without NO production, phasic contractions are inhibited and can only occur at moderate transwall pressures, which are capable of providing the stretch-activated Ca2+ spikes (Fig. 3A, green). With lower pressures, insufficient stretch activation occurs (red). At higher pressures, the stretch channels are always activated, resulting in stasis (purple). Thus, it is possible for the Ca2+ oscillations to occur without NO steering if the fluid pressure and wall mechanics are balanced.
Fig. 3.

Ca2+ and NO cooperate to optimize lymph transport (simulations). (A) Simulations without NO activity. At low transwall pressure ΔP|wall, vessel stretch is insufficient to induce Ca2+ contractions (red). High pressures stop contractions (purple). At moderate pressures, Ca2+ can mediate pumping without NO (green). The axial pressure gradient was zero for all three simulations. (B) Modulation of the Ca2+ mechanism by NO. The simulations in A were repeated, but with shear-induced NO present. The system pumps at all three pressures. (C) Signaling species kinetics is important. To achieve efficient transport, the shear-induced steering molecule should have a half-life on the order of 0.01–1 s. (D) The changes in frequency with pressure are inversely proportional to the amplitude due to the longer distance a boundary point has to travel. Low transwall pressures result in smaller diastolic diameters, and correspondingly smaller amplitude. High transwall pressures, on the other hand, limit the systolic diameter, also reducing amplitudes. The light blue, gold, and dark blue data points correspond to the traces in B. (E) Diastolic and systolic diameters (squares)—and the contraction amplitude (gray bars)—are affected by transwall pressure ΔP|wall. For high pressures, both approach the same limit, determined by the mechanical properties of the wall. For low pressures, the vessel cannot fully relax, because the pressure does not provide sufficient opening force. At moderate pressures, the fluid can dilate the vessel, but the lymphatic muscle cells can overcome the fluid pressure; amplitude is maximized in this regime. (F) NO improves flow at high and low transwall pressures. Simulations were performed with no axial pressure gradient. With low transwall pressure, no pumping occurs without NO (circles). At high pressure, contraction amplitude is limited, and again, flow is negligible. At intermediate pressures, stretch-induced contractions and Ca2+ oscillations can drive flow. Note that the range of pressures where Ca2+ can operate independently is relatively narrow. With NO, flow rates are more consistent over the range of pressures. The colored data points correspond to the respective traces in A and B.
To further examine the role of NO in controlling the phasic contractions, we reactivated it in the model. In these simulations, there is consistent pumping over a wide range of transwall pressures, as well as a decrease in vessel tone (larger diameter) due to cooperation between the pressure-induced stretch and NO-mediated relaxation (Fig. 3B). Thus, NO signaling allows contractions to occur over a wider range of transmural pressures, establishing a more robust transport system.
Interestingly, the performance of the system is affected by the kinetics of the shear-induced signaling species. If this signal has a short lifetime, lymphangion filling is insufficient, whereas with longer lifetimes, pumping frequency slows (Fig. 3C). The actual lifetime of NO depends on local oxygen concentration, but is in the range of 0.1–1 s (20), corresponding to the optimum in our simulations (Fig. 3C). Note that other endothelial-derived relaxation factors, such as histamine (48), generally have much longer lifetimes and would not be able to drive the oscillations.
We next investigated further the relationship between transwall pressure and pumping performance. Because it is possible to precisely control vascular pressure in ex vivo lymphatic studies, there is a rich literature investigating the effect of transwall pressure on vessel contractions (8, 28, 49–54). In these experiments, there is a monotonic increase in pumping frequency with pressure, but a peak in amplitude at a moderate pressures (28, 49, 50). In agreement with these observations, our simulations (with NO active) show an increase in frequency with pressure from a minimum at ΔP|W ∼ 6 (Fig. 3D). We also reproduce the peak in amplitude that is observed in experiments, but previously unexplained. According to our simulations, this is due to a rapid increase in diastolic diameter with pressure while the systolic diameter lags behind (Fig. 3E). The system is able to perform without NO, but only over a small window of transwall pressures (Fig. 3F).
In addition to transwall pressures, lymphatic vessels can also experience intraluminal pressure gradients along the vessel axis that can affect flow. In experimental studies conducted by controlling flow through cannulated ex vivo lymphatic preparations, contractions are affected by axial pressure gradients that either drive flow through the vessel (negative gradient) or force the vessel to pump against pressure (positive gradient) (52, 55–60). In these experiments, imposed flow tends to inhibit contractions, and our simulations reproduce this behavior, predicting decreasing amplitude with increasingly negative (helping) axial pressures (Fig. 4A). At sufficiently high imposed flow, contractions are completely inhibited as NO quenches the Ca2+-induced contractions (Fig. 4A, δP/δx less than approximately −12). Without the contractions, which increase flow resistance, there is a linear increase in flow rate with increasingly negative axial pressures (Fig. 4B, with NO).
Fig. 4.

Influence of axial pressure gradients and overall performance (simulations). (A) Systolic and diastolic diameters are affected by axial pressure gradient. ΔP|wall = 9 for these simulations. Although the diastolic diameter varies little, the systolic diameter adapts to the imposed pressure. At large negative (driving) pressures, NO inhibits contractions. Otherwise, NO coordinates the contractions to drive flow. The gray bars show the corresponding amplitudes. (B) Flow rates are improved by NO steering. With ΔP|wall = 9, flow is slightly better without NO production with opposing (positive) and neutral pressure gradients compared with the case with NO (circles vs. squares, positive pressure gradient). With negative pressure gradients (driven flow), shear-induced NO relaxes the vessel, reducing flow resistance (squares, negative pressure gradients). In this regime without NO (ΔP|wall = 9), the vessel continues to contract even when pressure-driven flow is present, and this increases flow resistance. The simulations without NO at ΔP|wall = 9 represent the optimum case: Slightly increasing the transwall pressure to 10 results in consistently less output over the range of axial pressures (triangles). The colored data points correspond to the respective simulations in Fig. 3 A and B. (C) Contraction wave propagation. To quantify the direction of propagation of the contractions, we calculated the cross-correlation function of the radius over time at two nearby points in the vessel wall. With shear-induced NO, there is a backward propagation of the contractions (red, negative time shift); without NO, the contractions propagate forward (black, positive time shift). (D) Behavior map of transport in a collecting lymphatic vessel. The performance of the system is summarized as a function of axial (x axis) and transwall (y axis) pressure gradients.
The advantage of a computational model is that we can challenge the system with a variety of physiological conditions and observe the performance, which is best measured by the output flow rate of the vessel. With NO, the flow is relatively constant, even as the opposing pressure gradient increases (Fig. 4B; squares, pressure gradient > 0). The normalized flow rate Q* = Q/Q0 drops from Q* = 1.0 at δP/δx = 0 to Q* = 0.72 at δP/δx = 10 to Q* = 0.50 at δP/δx = 20. As the pressure gradient becomes negative (driving flow), NO damps the contractions, relaxing the vessel and allowing pressure-driven flow (squares, axial pressure gradient less than −10). Without NO, the performance of the lymphatic contraction is highly dependent on the transwall pressure. For a transwall pressure of 9 (Fig. 4B, circles), Ca2+ oscillations alone can drive the pumping due to stretch-induced Ca2+ fluctuations. At this transwall pressure, the performance is slightly better (Q* = 1.60 at δP/δx = 0) than the case with active NO signaling, as NO inhibits the Ca2+-dependent contractions. However, without NO, the vessel continues to pump even when negative pressure is available to drive the flow, and this increases resistance, lowering the output (at δP/δx = 20, Q* = 2.66 without NO vs. Q* = 7.58 with NO). Increasing the transwall pressure slightly from P|wall = 9 to P|wall = 10 results in consistently lower flow rates compared with the case with NO production (triangles), and there is only a small window of transwall pressures in which the Ca2+ can mediate pumping independent of NO (Fig. 3F). With no axial pressure gradient, NO-independent pumping can occur for moderate transwall pressures. At lower transwall pressures, there is insufficient stretch activation of Ca2+, whereas at higher transwall pressures, the contractions cannot overcome the fluid pressure. In these regimes, the NO dynamics can control the pumping, leading to a nonzero flow rate over a large range (squares).
We emphasize that there were no changes made to the model formulation to reproduce the experimental findings described above. Except for the activation/deactivation of NO, only the boundary conditions that dictate the fluid pressure environment (and in the case of inflammation, the baseline diameter) were changed to match the data. Thus, all these behaviors emerge naturally from the nonlinear dynamics of the Ca2+–NO mechanism.
A previously unexplained experimental observation concerns the apparent direction of propagation of the lymphatic contractions along the vessel. Zawieja et al. (61, 62) reported that the majority of the contraction waves are either static or in the direction opposite to the flow. This counterintuitive finding suggested that lymphatic contractions do not operate via conventional peristalsis but are coordinated by mechanisms that can travel upstream. However, researchers have yet to identify such signals. Indeed, blocking the prime candidates—gap junctions—reduces the pumping by ∼30% but does not stop the cyclic contractions (28). To investigate this anomaly, we performed larger simulations with eight lymphangions to more easily observe the direction of propagation. We found that the direction depends on whether NO or Ca2+ is dominating the system. When NO dominates, we observe retrograde propagation of the contraction wave. In contrast, when Ca2+ dominates, the contractions propagate in the forward direction (Fig. 4C and Movies S5 and S6). This behavior is likely due to the ability of the vessel to “pull” fluid from upstream when the NO mechanism actively dilates the vessel, whereas when Ca2+ dominates, the fluid is predominately “pushed” downstream by the Ca2+-induced contractions.
Discussion
The transduction of mechanical signals is prevalent in biology, and research in this area is accelerating (63–67). The mechanobiological control mechanisms described here result in a robust transport system that adapts to varying fluid environments to optimize lymph transport while minimizing metabolic costs (Fig. 4D). It automatically reacts to changes in tissue fluid pressures, adjusting vasomotion as needed for lymph clearance. Mechanobiological feedback also makes lymphatics energy-efficient, contracting only when needed.
Although it accurately reproduces the robust and versatile activity of lymphatic vessels, our model does not encompass all of the regulatory control of lymphatic vessel function, and there are likely additional mechanisms that can control vessel tone, independent of the pumping mechanism (68–70). Nevertheless, the model suggests that shear-driven NO feedback enables lymph transport over a range of transwall and axial pressure gradient conditions not possible in the absence of NO signaling. Thus, any malfunction in the endothelial mechanosensory machinery or downstream pathways that produce NO could result in impaired lymphatic transport. Similarly, excess production of NO by tissue cells can obfuscate the NO oscillations and interfere with the pumping (4). Modulation of these components in the clinic may lead to better therapies for lymphedema and weakened immune responses.
The biological feedback mechanism described here is an important example of emergent behavior and biological oscillation. Following simple, local mechanisms, a collection of cells in the vessel wall can produce amazingly complex, coordinated, and appropriate behavior. The identification of the oscillating system driven by NO and Ca2+ dynamics provides a unified theory able to explain many key features of lymphatic physiology: how lymphatic vessels respond appropriately to changes in pressure gradients and transwall pressures, how underproduction or overproduction of NO can interfere with pumping, and even why the propagation of wall contractions can oppose the flow direction. In the context of this theory, no additional chemical or electrical signals are necessary—the mechanobiological signals of fluid shear stress and mechanical stretch provide sufficient feedback to coordinate the contractions. From the perspective of control theory, the oscillator constitutes a closed-loop system, capable of interesting and diverse behaviors. In the simulations, and in experiments, removing the NO mechanism effectively disrupts the loop and reduces the system to one dependent only on Ca2+ dynamics. Further analysis of this control system should reveal additional strategies for shifting its output to either increase or decrease lymph flow for therapeutic purposes. It remains to be seen whether this mechanism is present in other aspects of vascular biology, but its robust nature suggests that it may play a role in other systems requiring variable demand for fluid transport such as vasomotion in the blood vasculature or during development of the cardiovascular system, before neuronal control is established.
Methods
All procedures were performed following the guidelines of the Institutional Animal Care and Use Committee of the Massachusetts General Hospital.
Supplementary Material
Acknowledgments
We thank Drs. Jonathan Song and Dennis Jones for unpublished studies that guided this project. This work was funded in part by National Institutes of Health Grants R01-CA149285 (to L.L.M.), R00-CA137167, R21-AI097745, and DP2-OD008780 (to T.P.P.), R01-HL128168 (to J.W.B., T.P.P., and L.L.M.), and Deutsche Forschungsgemeinschaft Grant Ku 2909/1 (to C.K.).
Footnotes
The authors declare no conflict of interest.
This article is a PNAS Direct Submission.
This article contains supporting information online at www.pnas.org/lookup/suppl/doi:10.1073/pnas.1508330112/-/DCSupplemental.
References
- 1.Brorson H, Ohlin K, Olsson G, Svensson B, Svensson H. Controlled compression and liposuction treatment for lower extremity lymphedema. Lymphology. 2008;41(2):52–63. [PubMed] [Google Scholar]
- 2.Mendoza E, Schmid-Schönbein GW. A model for mechanics of primary lymphatic valves. J Biomech Eng. 2003;125(3):407–414. doi: 10.1115/1.1568128. [DOI] [PubMed] [Google Scholar]
- 3.Elias RM, Johnston MG, Hayashi A, Nelson W. Decreased lymphatic pumping after intravenous endotoxin administration in sheep. Am J Physiol. 1987;253(6 Pt 2):H1349–H1357. doi: 10.1152/ajpheart.1987.253.6.H1349. [DOI] [PubMed] [Google Scholar]
- 4.Liao S, et al. Impaired lymphatic contraction associated with immunosuppression. Proc Natl Acad Sci USA. 2011;108(46):18784–18789. doi: 10.1073/pnas.1116152108. [DOI] [PMC free article] [PubMed] [Google Scholar]
- 5.Zhao J, van Helden DF. ET-1-associated vasomotion and vasospasm in lymphatic vessels of the guinea-pig mesentery. Br J Pharmacol. 2003;140(8):1399–1413. doi: 10.1038/sj.bjp.0705573. [DOI] [PMC free article] [PubMed] [Google Scholar]
- 6.von der Weid PY. Review article: Lymphatic vessel pumping and inflammation—the role of spontaneous constrictions and underlying electrical pacemaker potentials. Aliment Pharmacol Ther. 2001;15(8):1115–1129. doi: 10.1046/j.1365-2036.2001.01037.x. [DOI] [PubMed] [Google Scholar]
- 7.Shirasawa Y, Benoit JN. Stretch-induced calcium sensitization of rat lymphatic smooth muscle. Am J Physiol Heart Circ Physiol. 2003;285(6):H2573–H2577. doi: 10.1152/ajpheart.00002.2003. [DOI] [PubMed] [Google Scholar]
- 8.McHale NG, Roddie IC. The effect of transmural pressure on pumping activity in isolated bovine lymphatic vessels. J Physiol. 1976;261(2):255–269. doi: 10.1113/jphysiol.1976.sp011557. [DOI] [PMC free article] [PubMed] [Google Scholar]
- 9.Davis MJ, et al. Intrinsic increase in lymphangion muscle contractility in response to elevated afterload. Am J Physiol Heart Circ Physiol. 2012;303(7):H795–H808. doi: 10.1152/ajpheart.01097.2011. [DOI] [PMC free article] [PubMed] [Google Scholar]
- 10.Scallan JP, Wolpers JH, Davis MJ. Constriction of isolated collecting lymphatic vessels in response to acute increases in downstream pressure. J Physiol. 2013;591(Pt 2):443–459. doi: 10.1113/jphysiol.2012.237909. [DOI] [PMC free article] [PubMed] [Google Scholar]
- 11.Lansman JB, Hallam TJ, Rink TJ. Single stretch-activated ion channels in vascular endothelial cells as mechanotransducers? Nature. 1987;325(6107):811–813. doi: 10.1038/325811a0. [DOI] [PubMed] [Google Scholar]
- 12.Davis MJ, Donovitz JA, Hood JD. Stretch-activated single-channel and whole cell currents in vascular smooth muscle cells. Am J Physiol. 1992;262(4 Pt 1):C1083–C1088. doi: 10.1152/ajpcell.1992.262.4.C1083. [DOI] [PubMed] [Google Scholar]
- 13.Barouch LA, et al. Nitric oxide regulates the heart by spatial confinement of nitric oxide synthase isoforms. Nature. 2002;416(6878):337–339. doi: 10.1038/416337a. [DOI] [PubMed] [Google Scholar]
- 14.Shirasawa Y, Ikomi F, Ohhashi T. Physiological roles of endogenous nitric oxide in lymphatic pump activity of rat mesentery in vivo. Am J Physiol Gastrointest Liver Physiol. 2000;278(4):G551–G556. doi: 10.1152/ajpgi.2000.278.4.G551. [DOI] [PubMed] [Google Scholar]
- 15.von der Weid PY, Zhao J, Van Helden DF. Nitric oxide decreases pacemaker activity in lymphatic vessels of guinea pig mesentery. Am J Physiol Heart Circ Physiol. 2001;280(6):H2707–H2716. doi: 10.1152/ajpheart.2001.280.6.H2707. [DOI] [PubMed] [Google Scholar]
- 16.Bohlen HG, Gasheva OY, Zawieja DC. Nitric oxide formation by lymphatic bulb and valves is a major regulatory component of lymphatic pumping. Am J Physiol Heart Circ Physiol. 2011;301(5):H1897–H1906. doi: 10.1152/ajpheart.00260.2011. [DOI] [PMC free article] [PubMed] [Google Scholar]
- 17.Gasheva OY, Zawieja DC, Gashev AA. Contraction-initiated NO-dependent lymphatic relaxation: A self-regulatory mechanism in rat thoracic duct. J Physiol. 2006;575(Pt 3):821–832. doi: 10.1113/jphysiol.2006.115212. [DOI] [PMC free article] [PubMed] [Google Scholar]
- 18.Shyy JYJ, Chien S. Role of integrins in endothelial mechanosensing of shear stress. Circ Res. 2002;91(9):769–775. doi: 10.1161/01.res.0000038487.19924.18. [DOI] [PubMed] [Google Scholar]
- 19.Kuchan MJ, Frangos JA. Role of calcium and calmodulin in flow-induced nitric oxide production in endothelial cells. Am J Physiol. 1994;266(3 Pt 1):C628–C636. doi: 10.1152/ajpcell.1994.266.3.C628. [DOI] [PubMed] [Google Scholar]
- 20.Thomas DD, Liu X, Kantrow SP, Lancaster JR., Jr The biological lifetime of nitric oxide: Implications for the perivascular dynamics of NO and O2. Proc Natl Acad Sci USA. 2001;98(1):355–360. doi: 10.1073/pnas.011379598. [DOI] [PMC free article] [PubMed] [Google Scholar]
- 21.Lee J, Ishihara A, Oxford G, Johnson B, Jacobson K. Regulation of cell movement is mediated by stretch-activated calcium channels. Nature. 1999;400(6742):382–386. doi: 10.1038/22578. [DOI] [PubMed] [Google Scholar]
- 22.Wang W, et al. Inhibition of myosin light chain phosphorylation decreases rat mesenteric lymphatic contractile activity. Am J Physiol Heart Circ Physiol. 2009;297(2):H726–H734. doi: 10.1152/ajpheart.00312.2009. [DOI] [PMC free article] [PubMed] [Google Scholar]
- 23.Karaki H, et al. Calcium movements, distribution, and functions in smooth muscle. Pharmacol Rev. 1997;49(2):157–230. [PubMed] [Google Scholar]
- 24.Dougherty PJ, et al. PKC activation increases Ca²+ sensitivity of permeabilized lymphatic muscle via myosin light chain 20 phosphorylation-dependent and -independent mechanisms. Am J Physiol Heart Circ Physiol. 2014;306(5):H674–H683. doi: 10.1152/ajpheart.00732.2013. [DOI] [PMC free article] [PubMed] [Google Scholar]
- 25.Murphy RA, Walker JS. Inhibitory mechanisms for cross-bridge cycling: The nitric oxide-cGMP signal transduction pathway in smooth muscle relaxation. Acta Physiol Scand. 1998;164(4):373–380. doi: 10.1046/j.1365-201X.1998.00434.x. [DOI] [PubMed] [Google Scholar]
- 26.Harris DE, Warshaw DM. Length vs. active force relationship in single isolated smooth muscle cells. Am J Physiol. 1991;260(5 Pt 1):C1104–C1112. doi: 10.1152/ajpcell.1991.260.5.C1104. [DOI] [PubMed] [Google Scholar]
- 27.Major TC, et al. The T- and L-type calcium channel blocker (CCB) mibefradil attenuates leg edema induced by the L-type CCB nifedipine in the spontaneously hypertensive rat: A novel differentiating assay. J Pharmacol Exp Ther. 2008;325(3):723–731. doi: 10.1124/jpet.107.133892. [DOI] [PubMed] [Google Scholar]
- 28.Lee S, Roizes S, von der Weid PY. Distinct roles of L- and T-type voltage-dependent Ca2+ channels in regulation of lymphatic vessel contractile activity. J Physiol. 2014;592(Pt 24):5409–5427. doi: 10.1113/jphysiol.2014.280347. [DOI] [PMC free article] [PubMed] [Google Scholar]
- 29.Clapham DE. Calcium signaling. Cell. 2007;131(6):1047–1058. doi: 10.1016/j.cell.2007.11.028. [DOI] [PubMed] [Google Scholar]
- 30.Laver DR, Kong CH, Imtiaz MS, Cannell MB. Termination of calcium-induced calcium release by induction decay: An emergent property of stochastic channel gating and molecular scale architecture. J Mol Cell Cardiol. 2013;54:98–100. doi: 10.1016/j.yjmcc.2012.10.009. [DOI] [PubMed] [Google Scholar]
- 31.Collier ML, Ji G, Wang Y, Kotlikoff MI. Calcium-induced calcium release in smooth muscle: Loose coupling between the action potential and calcium release. J Gen Physiol. 2000;115(5):653–662. doi: 10.1085/jgp.115.5.653. [DOI] [PMC free article] [PubMed] [Google Scholar]
- 32.Aalkjær C, Boedtkjer D, Matchkov V. Vasomotion—what is currently thought? Acta Physiol (Oxf) 2011;202(3):253–269. doi: 10.1111/j.1748-1716.2011.02320.x. [DOI] [PubMed] [Google Scholar]
- 33.Kapela A, Parikh J, Tsoukias NM. Multiple factors influence calcium synchronization in arterial vasomotion. Biophys J. 2012;102(2):211–220. doi: 10.1016/j.bpj.2011.12.032. [DOI] [PMC free article] [PubMed] [Google Scholar]
- 34.Meens MJ, Sabine A, Petrova TV, Kwak BR. Connexins in lymphatic vessel physiology and disease. FEBS Lett. 2014;588(8):1271–1277. doi: 10.1016/j.febslet.2014.01.011. [DOI] [PubMed] [Google Scholar]
- 35.Kannan MS, Prakash YS, Johnson DE, Sieck GC. Nitric oxide inhibits calcium release from sarcoplasmic reticulum of porcine tracheal smooth muscle cells. Am J Physiol. 1997;272(1 Pt 1):L1–L7. doi: 10.1152/ajplung.1997.272.1.L1. [DOI] [PubMed] [Google Scholar]
- 36.Heunks LM, Cody MJ, Geiger PC, Dekhuijzen PN, Sieck GC. Nitric oxide impairs Ca2+ activation and slows cross-bridge cycling kinetics in skeletal muscle. J Appl Physiol (1985) 2001;91(5):2233–2239. doi: 10.1152/jappl.2001.91.5.2233. [DOI] [PubMed] [Google Scholar]
- 37.Kapela A, Bezerianos A, Tsoukias NM. A mathematical model of Ca2+ dynamics in rat mesenteric smooth muscle cell: Agonist and NO stimulation. J Theor Biol. 2008;253(2):238–260. doi: 10.1016/j.jtbi.2008.03.004. [DOI] [PubMed] [Google Scholar]
- 38.Bohlen HG, Wang W, Gashev A, Gasheva O, Zawieja D. Phasic contractions of rat mesenteric lymphatics increase basal and phasic nitric oxide generation in vivo. Am J Physiol Heart Circ Physiol. 2009;297(4):H1319–H1328. doi: 10.1152/ajpheart.00039.2009. [DOI] [PMC free article] [PubMed] [Google Scholar]
- 39.Rahbar E, Akl T, Coté GL, Moore JE, Jr, Zawieja DC. Lymph transport in rat mesenteric lymphatics experiencing edemagenic stress. Microcirculation. 2014;21(5):359–367. doi: 10.1111/micc.12112. [DOI] [PMC free article] [PubMed] [Google Scholar]
- 40.Nagai T, Bridenbaugh EA, Gashev AA. Aging-associated alterations in contractility of rat mesenteric lymphatic vessels. Microcirculation. 2011;18(6):463–473. doi: 10.1111/j.1549-8719.2011.00107.x. [DOI] [PMC free article] [PubMed] [Google Scholar]
- 41.Schmid-Schönbein GW. Microlymphatics and lymph flow. Physiol Rev. 1990;70(4):987–1028. doi: 10.1152/physrev.1990.70.4.987. [DOI] [PubMed] [Google Scholar]
- 42.Succi S. The Lattice Boltzmann Equation for Fluid Dynamics and Beyond. Oxford Univ Press; Oxford: 2001. [Google Scholar]
- 43.Verberg R, Ladd AJC. Accuracy and stability of a lattice-Boltzmann model with subgrid scale boundary conditions. Phys Rev E Stat Nonlin Soft Matter Phys. 2002;65(1 Pt 2):016701. doi: 10.1103/PhysRevE.65.016701. [DOI] [PubMed] [Google Scholar]
- 44.Azuma T, Ohhashi T, Sakaguchi M. Electrical activity of lymphatic smooth muscles. Proc Soc Exp Biol Med. 1977;155(2):270–273. doi: 10.3181/00379727-155-39787. [DOI] [PubMed] [Google Scholar]
- 45.Hagendoorn J, et al. Endothelial nitric oxide synthase regulates microlymphatic flow via collecting lymphatics. Circ Res. 2004;95(2):204–209. doi: 10.1161/01.RES.0000135549.72828.24. [DOI] [PubMed] [Google Scholar]
- 46.Gashev AA, et al. Methods for lymphatic vessel culture and gene transfection. Microcirculation. 2009;16(7):615–628. doi: 10.1080/10739680903120778. [DOI] [PMC free article] [PubMed] [Google Scholar]
- 47.Hanley CA, Elias RM, Johnston MG. Is endothelium necessary for transmural pressure-induced contractions of bovine truncal lymphatics? Microvasc Res. 1992;43(2):134–146. doi: 10.1016/0026-2862(92)90012-e. [DOI] [PubMed] [Google Scholar]
- 48.Nizamutdinova IT, et al. Involvement of histamine in endothelium-dependent relaxation of mesenteric lymphatic vessels. Microcirculation. 2014;21(7):640–648. doi: 10.1111/micc.12143. [DOI] [PMC free article] [PubMed] [Google Scholar]
- 49.Gashev AA. Physiologic aspects of lymphatic contractile function: Current perspectives. Ann N Y Acad Sci. 2002;979:178–187, discussion 188–196. doi: 10.1111/j.1749-6632.2002.tb04878.x. [DOI] [PubMed] [Google Scholar]
- 50.Scallan JP, Davis MJ. Genetic removal of basal nitric oxide enhances contractile activity in isolated murine collecting lymphatic vessels. J Physiol. 2013;591(Pt 8):2139–2156. doi: 10.1113/jphysiol.2012.250662. [DOI] [PMC free article] [PubMed] [Google Scholar]
- 51.Zweifach BW, Prather JW. Micromanipulation of pressure in terminal lymphatics in the mesentery. Am J Physiol. 1975;228(5):1326–1335. doi: 10.1152/ajplegacy.1975.228.5.1326. [DOI] [PubMed] [Google Scholar]
- 52.Benoit JN, Zawieja DC, Goodman AH, Granger HJ. Characterization of intact mesenteric lymphatic pump and its responsiveness to acute edemagenic stress. Am J Physiol. 1989;257(6 Pt 2):H2059–H2069. doi: 10.1152/ajpheart.1989.257.6.H2059. [DOI] [PubMed] [Google Scholar]
- 53.Davis MJ, Davis AM, Ku CW, Gashev AA. Myogenic constriction and dilation of isolated lymphatic vessels. Am J Physiol Heart Circ Physiol. 2009;296(2):H293–H302. doi: 10.1152/ajpheart.01040.2008. [DOI] [PMC free article] [PubMed] [Google Scholar]
- 54.Johnston MG, Elias R. The regulation of lymphatic pumping. Lymphology. 1987;20(4):215–218. [PubMed] [Google Scholar]
- 55.Gashev AA, Davis MJ, Zawieja DC. Inhibition of the active lymph pump by flow in rat mesenteric lymphatics and thoracic duct. J Physiol. 2002;540(Pt 3):1023–1037. doi: 10.1113/jphysiol.2001.016642. [DOI] [PMC free article] [PubMed] [Google Scholar]
- 56.Gashev AA. Lymphatic vessels: Pressure- and flow-dependent regulatory reactions. Ann N Y Acad Sci. 2008;1131:100–109. doi: 10.1196/annals.1413.009. [DOI] [PubMed] [Google Scholar]
- 57.Benoit JN. Relationships between lymphatic pump flow and total lymph flow in the small intestine. Am J Physiol. 1991;261(6 Pt 2):H1970–H1978. doi: 10.1152/ajpheart.1991.261.6.H1970. [DOI] [PubMed] [Google Scholar]
- 58.Eisenhoffer J, Elias RM, Johnston MG. Effect of outflow pressure on lymphatic pumping in vitro. Am J Physiol. 1993;265(1 Pt 2):R97–R102. doi: 10.1152/ajpregu.1993.265.1.R97. [DOI] [PubMed] [Google Scholar]
- 59.Gashev AA, Delp MD, Zawieja DC. Inhibition of active lymph pump by simulated microgravity in rats. Am J Physiol Heart Circ Physiol. 2006;290(6):H2295–H2308. doi: 10.1152/ajpheart.00260.2005. [DOI] [PubMed] [Google Scholar]
- 60.Kornuta JA, Brandon Dixon J. Ex vivo lymphatic perfusion system for independently controlling pressure gradient and transmural pressure in isolated vessels. Ann Biomed Eng. 2014;42(8):1691–1704. doi: 10.1007/s10439-014-1024-6. [DOI] [PMC free article] [PubMed] [Google Scholar]
- 61.Zawieja DC, Davis KL, Schuster R, Hinds WM, Granger HJ. Distribution, propagation, and coordination of contractile activity in lymphatics. Am J Physiol. 1993;264(4 Pt 2):H1283–H1291. doi: 10.1152/ajpheart.1993.264.4.H1283. [DOI] [PubMed] [Google Scholar]
- 62.McHale NG, Meharg MK. Co-ordination of pumping in isolated bovine lymphatic vessels. J Physiol. 1992;450:503–512. doi: 10.1113/jphysiol.1992.sp019139. [DOI] [PMC free article] [PubMed] [Google Scholar]
- 63.Kim SE, Coste B, Chadha A, Cook B, Patapoutian A. The role of Drosophila Piezo in mechanical nociception. Nature. 2012;483(7388):209–212. doi: 10.1038/nature10801. [DOI] [PMC free article] [PubMed] [Google Scholar]
- 64.Bausch AR, Schwarz US. Cellular mechanosensing: Sharing the force. Nat Mater. 2013;12(11):948–949. doi: 10.1038/nmat3791. [DOI] [PubMed] [Google Scholar]
- 65.Luo T, Mohan K, Iglesias PA, Robinson DN. Molecular mechanisms of cellular mechanosensing. Nat Mater. 2013;12(11):1064–1071. doi: 10.1038/nmat3772. [DOI] [PMC free article] [PubMed] [Google Scholar]
- 66.Humphrey JD, Milewicz DM, Tellides G, Schwartz MA. Cell biology. Dysfunctional mechanosensing in aneurysms. Science. 2014;344(6183):477–479. doi: 10.1126/science.1253026. [DOI] [PMC free article] [PubMed] [Google Scholar]
- 67.Ranade SS, et al. Piezo1, a mechanically activated ion channel, is required for vascular development in mice. Proc Natl Acad Sci USA. 2014;111(28):10347–10352. doi: 10.1073/pnas.1409233111. [DOI] [PMC free article] [PubMed] [Google Scholar]
- 68.Benoit JN. Effects of alpha-adrenergic stimuli on mesenteric collecting lymphatics in the rat. Am J Physiol. 1997;273(1 Pt 2):R331–R336. doi: 10.1152/ajpregu.1997.273.1.R331. [DOI] [PubMed] [Google Scholar]
- 69.Yokoyama S, Benoit JN. Effects of bradykinin on lymphatic pumping in rat mesentery. Am J Physiol. 1996;270(5 Pt 1):G752–G756. doi: 10.1152/ajpgi.1996.270.5.G752. [DOI] [PubMed] [Google Scholar]
- 70.Davis MJ, et al. Modulation of lymphatic muscle contractility by the neuropeptide substance P. Am J Physiol Heart Circ Physiol. 2008;295(2):H587–H597. doi: 10.1152/ajpheart.01029.2007. [DOI] [PMC free article] [PubMed] [Google Scholar]
- 71.McNamara GR, Zanetti G. Use of the Boltzmann equation to simulate lattice gas automata. Phys Rev Lett. 1988;61(20):2332–2335. doi: 10.1103/PhysRevLett.61.2332. [DOI] [PubMed] [Google Scholar]
- 72.Schwabl F. Statistische Mechanik. Springer; Berlin: 2000. [Google Scholar]
- 73.Sukop MC, Thorne DT., Jr 2007. Lattice Boltzmann Modeling (Springer, Berlin)
- 74.Ginzburg I, Verhaeghe F, d’Humieres D. Two-relaxation-time lattice Boltzmann scheme: About parametrization, velocity pressure and mixed boundary conditions. Commun Comput Phys. 2008;3(2):427–478. [Google Scholar]
- 75.Ginzburg I, Verhaeghe F, d’Humieres D. Study of simple hydrodynamic solutions with the two-relaxation-time lattice Boltzmann scheme. Commun Comput Phys. 2008;3(3):519–581. [Google Scholar]
- 76.Dünweg B, Schiller UD, Ladd AJC. Statistical mechanics of the fluctuating lattice Boltzmann equation. Phys Rev E Stat Nonlin Soft Matter Phys. 2007;76(3 Pt 2):036704. doi: 10.1103/PhysRevE.76.036704. [DOI] [PubMed] [Google Scholar]
- 77.Bhatnagar PL, Gross EP, Krook M. Model for collision processes in gases. I. Small amplitude processes in charged and neutral one-component systems. Phys Rev. 1954;94(3):511. [Google Scholar]
- 78.Bertram CD, Macaskill C, Moore JE., Jr Simulation of a chain of collapsible contracting lymphangions with progressive valve closure. J Biomech Eng. 2011;133(1):011008. doi: 10.1115/1.4002799. [DOI] [PMC free article] [PubMed] [Google Scholar]
- 79.Bertram C, Macaskill C, Moore J., Jr Incorporating measured valve properties into a numerical model of a lymphatic vessel. Comput Methods Biomech Biomed Engin. 2013;17(14):1519–1534. doi: 10.1080/10255842.2012.753066. [DOI] [PMC free article] [PubMed] [Google Scholar]
Associated Data
This section collects any data citations, data availability statements, or supplementary materials included in this article.