Abstract
Hydrotropes are compounds able to enhance the solubility of hydrophobic substances in aqueous media and therefore are widely used in the formulation of drugs, cleaning and personal care products. In this work, it is shown that ionic liquids are a new class of powerful catanionic hydrotropes where both the cation and the anion synergistically contribute to increase the solubility of biomolecules in water. The effects of the ionic liquid chemical structures, their concentration and the temperature on the solubility of two model biomolecules, vanillin and gallic acid were evaluated and compared with the performance of conventional hydrotropes. The solubility of these two biomolecules was studied in the entire composition range, from pure water to pure ionic liquids, and an increase in the solubility of up to 40-fold was observed, confirming the potential of ionic liquids to act as hydrotropes. Using dynamic light scattering, NMR and molecular dynamics simulations, it was possible to infer that the enhanced solubility of the biomolecule in the IL aqueous solutions is related to the formation of ionic-liquid–biomolecules aggregates. Finally, it was demonstrated that hydrotropy induced by ionic liquids can be used to recover solutes from aqueous media by precipitation, simply by using water as an anti-solvent. The results reported here have a significant impact on the understanding of the role of ionic liquid aqueous solutions in the extraction of value-added compounds from biomass as well as in the design of novel processes for their recovery from aqueous media.
Introduction
Advances in the dissolution of poorly soluble compounds in aqueous media play an important role in the formulation of drugs, cleaning agents and personal care products.1–4 Moreover, they are also of pivotal relevance in related industrial processes, such as crystallization and purification.5 Hydrotropes are compounds used to increase the concentration levels of hydrophobic solutes in aqueous solutions. Their ability to dramatically increase the solubility of sparingly soluble organic compounds in water has already been demonstrated.6,7 They are a class of highly water soluble salts or molecules characterized by an amphiphilic structure. Conventional hydrotropes used by industry are typically composed of a phenyl (hydrophobic part) attached to an anionic group (hydrophilic part) where ammonium, calcium, potassium or sodium act as counter ions.4 Although hydrotropes are used to improve the solubility of poorly soluble compounds in water they are not surfactants; the apolar part, or the hydrophobic moiety, of hydrotropes is smaller than that in traditional surfactants and they do not form micelles; nor do they present a critical micellar concentration (CMC) in the absence of a solute.8,9 In addition to the increase of the solubility, hydrotropes may also play a role in the stabilization of aqueous solutions, in the tailoring of their viscosity, and in modifying the liquid–liquid phase separation temperatures.5
The hydrotropy phenomenon was first reported by Neuberg in 1916.7 The author demonstrated the increased solubility of sparingly soluble compounds in water by addition of alkali metal salts of various organic acids with short alkyl chains. Although a large body of work during the past century has addressed this phenomenon, its mechanism of action is still not fully understood.7 In the past few decades, three main theories to justify the increased solubility of target compounds in water by the role of hydrotropes have been proposed.2 Some authors11–13 suggested that the hydrotropic-mediated solubilisation results from changes in the nature and structure of the solvent, i.e., that a disruption of the water structure induced by the hydrotropes occurs, allowing an increase in the solubility of the molecule of interest; the formation of solute–hydrotrope complexes has also been proposed to explain the enhanced solubility.14–17 According to this theory, the increase of solubility is the result of a collective molecular phenomenon that takes place by the formation of molecular complexes between the hydrotrope and the solute.14–17 More recent studies18–24 proposed that the co-aggregation of the solute with the hydrotropes is the main mechanism behind the enhanced solubilisation observed.
Hydrotropes are interesting compounds from a green chemistry perspective as they can replace hazardous co-solvents and present, in general, a low toxicity and have a low bioaccumulation potential – their octanol–water partition coefficients, due to their hydrophilic nature, are usually lower than 1.0.25 Moreover, since the solubility of a solute in aqueous media depends on the concentration of the hydrotrope, their recovery can be easily achieved using water as the anti-solvent (the greenest of all solvents). In this context, the purity of the final product can be greatly improved by further washing with water.26
The good solvation ability of ionic liquids (ILs) for a wide range of solutes is well-known, and therefore, they have been proposed as potential substitutes for the conventional organic solvents employed in extraction and separation processes.27–29 It has been shown that in aqueous solution the nanostructure of ILs is, to a fair extent, maintained at concentrations as low as 0.1 mole fraction, and that IL-based aqueous biphasic systems display a tailored and remarkable extraction performance for a wide variety of compounds when compared with conventional polymer-based systems.30 Furthermore, while aqueous solutions of ILs have been shown to be good solvents for the extraction of value-added compounds from biomass,31 the use of ILs as hydrotropes has never, to the best of our knowledge, been previously described or investigated.
Previous studies on the use of ILs for the extraction and purification of phenolic compounds, such as gallic acid and vanillin, have been reported.28,29,32–34 The large interest in vanillin results from its relevant properties for the human health, namely due to its antioxidant, anti-inflammatory, radical scavenger and antimicrobial characteristics.29 Likewise, gallic acid is a phenolic compound with important properties in the health and nutrition fields because of its anti-inflammatory, antibacterial, antifungal, antioxidative, phytotoxic and radical scavenging activities.28,35 These biomolecules are present at high concentrations in a variety of biomass sources, such as fruits, vegetables and wood, and also in many residues from industrial or agricultural activities.25,36–38 Their extraction from natural sources is usually carried out with mildly polar solvents such as alcohols,39,40 due to their low solubility in water (the solubility of vanillin in water is 12.78 g L−1 and that of gallic acid is 12.14 g L−1 at room temperature).41 Although no previous studies on the hydrotropic solubilization of gallic acid have been reported, the solubility of vanillin in aqueous solutions is already recognized to increase in the presence of typical hydrotropes, such as nicotinamide, sodium salicylate, resorcinol and citric acid.42
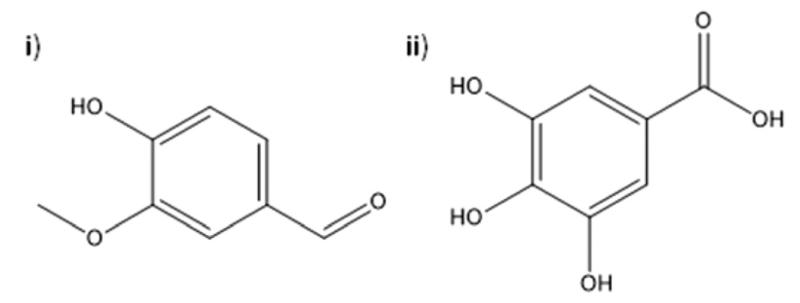
With the amphiphilic behaviour of ILs in mind,43 which seems to be the driving force behind their ability to dissolve a wide range of compounds, the potential of ILs to act as hydrotropes was here investigated based on their ability to enhance the solubility in water of two phenolic compounds, namely vanillin and gallic acid, whose structures are depicted in Fig. 1. The hydrotropic behaviour of ionic liquids was here evaluated by comparing the solubility of the two antioxidants in aqueous solutions of ILs with that in pure water, pure ILs, and aqueous solutions of common hydrotropes and some salting-in inducing salts, such as sodium benzoate, sodium citrate and sodium thiocyanate. The molecular-level mechanism of the hydrotropicity induced by ionic liquids is also proposed and discussed here based on experimental evidence obtained from dynamic light scattering (DLS) and NMR experiments and molecular dynamics simulations.
Fig. 1.
Chemical structures of (i) vanillin and (ii) gallic acid.
Finally, the importance and relevance of the results obtained here are discussed in terms of their applicability in extraction and purification processes of biomolecules from biomass sources, where the design of novel cost-effective and environmentally friendly processes could be envisaged.
Experimental section
Chemicals
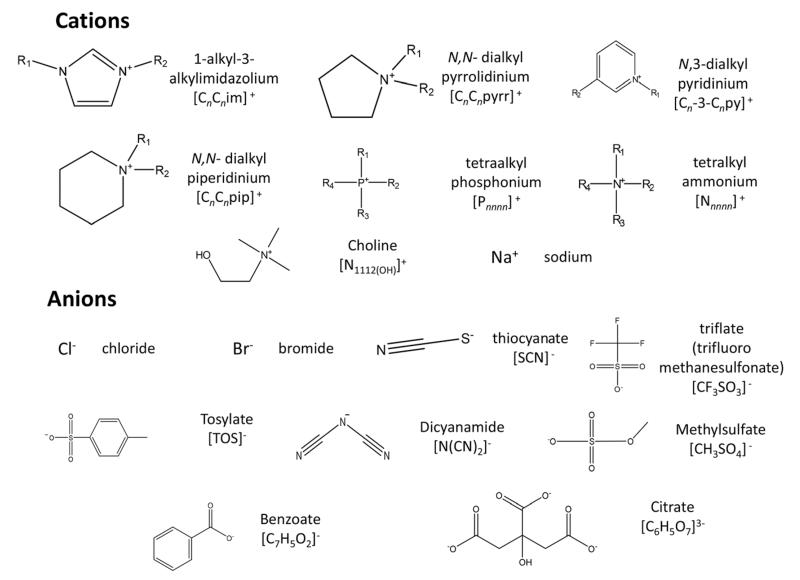
A large variety of ionic liquids (ILs) was studied in this work to cover the effects of the cation and anion type and the cation chain length. The ILs investigated are 1-ethyl-3-methylimidazolium chloride, [C2C1im]Cl, 1-ethyl-3-methylimidazolium dicyanamide, [C2C1im][N(CN)2], 1-butyl-3-methylimidazolium trifluoromethanesulfonate, [C4C1im]-[CF3SO3], 1-butyl-3-methylimidazolium thiocyanate, [C4C1im]-[SCN], 1-butyl-3-methylimidazolium methylsulfate, [C4C1im]-[CH3SO4], 1-butyl-3-methylimidazolium tosylate, [C4C1im]-[TOS], 1-butyl-3-methylimidazolium bromide, [C4C1im]Br, 1-butyl-3-methylimidazolium dicyanamide, [C4C1im][N(CN)2], 1-butyl-3-methylimidazolium chloride, [C4C1im]Cl, 1-hexyl-3-methylimidazolium chloride, [C6C1im]Cl, 1-methyl-3-octylimidazolium chloride, [C8C1im]Cl, 1-decyl-3-decylimidazolium chloride, [C10C1im]Cl, 1-dodecyl-3-methylimidazolium chloride, [C12C1im]Cl, 1-tetradecyl-3-methylimidazolium chloride, [C14C1im]Cl, 1-butyl-3-methylpyridinium dicyanamide, [C4C1py][N(CN)2], 1-butyl-1-methylpiperidinium chloride,[C4C1py]Cl, 1-butyl-1-methylpiperidinium chloride, [C4C1pip]-Cl, 1-butyl-1-methylpyrrolidinium chloride, [C4C1pyrr]Cl, tetrabutylammonium chloride, [N4444]Cl, tetrabutyl-phosphonium chloride, [P4444]Cl, tributylmethylphosphonium tosylate, [P4441][TOS], cholinium chloride, [N1112(OH)]Cl, and tetrabutylammonium tosylate, [N4444][TOS]. The imidazolium-, pyridinium-, and pyrrolidinium-based ILs were purchased from Iolitec. The tetrabutylphosphonium chloride and tributylmethylphosphonium tosylate were kindly offered by Cytec Industries Inc. Tetrabutylammonium chloride, tetrabutylammonium tosylate and cholinium chloride were obtained from Sigma-Aldrich. All ILs used have a stated supplier purity of at least 98 wt%. Before use, aiming at reducing the water and volatile compound contents to negligible values, all IL samples were dried under constant agitation and vacuum (10−2 Pa) at a temperature of 323 K for a minimum of 48 h. After this procedure, the purity of each IL was further checked by 1H and 13C NMR and confirmed to be >98 wt%. In the ESI is reported a summary table of the chemicals used in this work (Table S1†). The deuterium oxide used was acquired from Aldrich with >99.96% D atoms. The 3-(trimethylsilyl)propionic-2,2,3,3-d4 acid sodium salt (TSP) was from Aldrich with >98% D atoms. Sodium benzoate (NaC7H5O2), >99.0 wt% pure, was supplied by Panreac, sodium thiocyanate (NaSCN), >98.0 wt% pure, was supplied by Fluka, sodium chloride (NaCl), >98.0 wt% pure, was from ChemLab, sodium citrate (Na3C6H5O7), >98.0 wt% pure, was from JMGS, sodium tosylate Na[TOS], >95.0 wt% pure, was from TCI and sodium dicyanamide Na[N(CN)2], >96.0 wt% pure, was from Sigma-Aldrich. All of these compounds were dried before use. The chemical structures of the anions and cations of all ILs and salts investigated are depicted in Fig. 2.
Fig. 2.
Chemical structures of the anions and cations of all ILs and salts investigated.
Vanillin, >99 wt% pure, was supplied by Acros and gallic acid, >99.5 wt% pure, was acquired from Merck. Both antioxidants were used as received.
The water employed was double distilled, passed across a reverse osmosis system, and further treated with a Milli-Q plus 185 water purification apparatus.
Solubility of antioxidants
Each antioxidant (vanillin and gallic acid) was added in excess amount to each IL aqueous solution, pure water or pure IL, and was then equilibrated in an air oven (at given temperatures (±0.5 K)) under constant agitation using an Eppendorf Thermomixer Comfort equipment. Previously optimized equilibration conditions were established: a stirring velocity of 750 rpm and an equilibration time of at least 72 h. After the saturation was reached, all samples were centrifuged at the same temperature of equilibration in a Hettich Mikro 120 centrifuge during 20 minutes at 4500 rpm to separate the macroscopic solid and liquid phases. After centrifugation, all samples were put in an air bath equipped with a Pt 100 probe and a PID controller at the temperature used in equilibrium assays during 2 h. Then, the samples of the liquid phase were carefully collected and diluted in ultra-pure water, and the amount of vanillin and gallic acid was quantified by UV-spectroscopy using a SHIMADZU UV-1700, Pharma-Spec spectrometer at a wavelength of 280 nm and 262 nm, respectively, using calibration curves previously established. In all experiments, control samples at the same compositions, but without antioxidant, were used. At least three individual samples were quantified for each mixture and temperature. However, in some systems, the mixture composed of antioxidant, IL and water created a biphasic liquid–liquid system. In these situations, the amount of IL and vanillin in both the top and bottom phases was quantified by UV-spectroscopy as described before.
Dynamic light scattering (DLS)
To evaluate the presence of IL–solute aggregates, as well as to determine their size, solutions composed of [C4C1im][TOS], water and vanillin were analysed by dynamic light scattering (DLS) using a Malvern Zetasizer Nano-ZS from Malvern Instruments. Samples were irradiated with red light (HeNe laser, wavelength of 565 nm) and the intensity fluctuations of the scattering light (detected at a backscattering angle of 173°) were analysed to obtain an autocorrelation function. The respective software (DTS v 7.03) provides the particles’ size average and their distribution. The radii of each aggregate were determined from the DLS measurements using the Stokes–Einstein equation assuming spherical aggregates, and a low volume fraction of the dispersed phase. Consequently, the determined values must be considered with caution and regarded as approximate ones. Samples were measured in disposable polystyrene cuvettes at a temperature of 298 K. Data were then acquired in the automatic mode, ensuring that enough photons were accumulated for the result to be statistically relevant. The software also incorporates a ‘data quality report’. The solution viscosities and refractive indexes were previously measured by the DLS measurements.
Two types of experiments were carried out. In the first set, aqueous solutions of 0.80 mol kg−1 (IL/water) of [C4C1im][TOS] were prepared. Then, this stock solution was used to prepare different solutions with variable amounts of vanillin, namely 0.73, 0.62, 0.55, 0.49, 0.44, 0.40, 0.36 and 0.34 mol kg−1. In the second set, an aqueous solution containing 0.64 mol kg−1 of [C4C1im][TOS] and 0.73 mol kg−1 of vanillin was diluted with pure water aiming at maintaining the hydrotrope and vanillin at a constant ratio. In order to avoid the presence of micrometric aggregates and to remove all the dust particles, before the measurements, all solutions were homogenized in an ultrasonic bath and then filtered using a 0.2 μm PTFE membrane.
Nuclear magnetic resonance (NMR) spectroscopy
The 1H NMR spectra were obtained for several samples placed in NMR spectroscopy tubes containing sealed reference capillaries with D2O and TSP as the internal reference, and at 298 K. The 1H NMR measurements were performed on a Bruker Avance 300 spectrometer operating at 300.13 MHz.
Molecular dynamics (MD) simulation
Two ionic liquids, [C4C1im][N(CN)2] and [C4C1im][SCN], were tested using molecular dynamics (MD) simulations. They were parameterized using the CL&P atomistic force field,44–46 which is an extension of the AMBER and OPLS force fields47 specially designed to study ionic liquids and their homologous series.
The water and vanillin molecules were modeled using the SPC model48 and the OPLS force field, respectively. Molecular dynamics simulations were carried out using the DL_POLY 2.20 package.49 The runs were performed with cubic boxes with sides of at least 5 nm, 2 fs time-steps and 2 nm cutoff distances. Ewald summation corrections were performed beyond those cutoffs. The IL aqueous solutions were modeled using either 101 [C4C1im][N(CN)2] ion pairs or 105 [C4C1im][SCN] ion pairs mixed with 4600 water molecules. The vanillin–water mixture was modeled using 100 vanillin molecules and 4600 water molecules. Finally, the vanillin–IL–water systems were modeled using the aforementioned quantities of IL and vanillin mixed with 4600 water molecules.
All simulations started from low-density configurations that were subjected to equilibration runs under isobaric isothermal ensemble conditions (p = 0.1 MPa and T = 373 K with Nosé–Hoover thermostats and barostats with relaxation time constants of 1 and 4 ps, respectively). After 1.3 ns, the density of each system reached constant and consistent values, indicating that equilibrium had been attained and possible ergodicity problems had been overcome. Finally, several (at least six) consecutive production stages of 1.0 ns each were performed, and the combined results were used for the interaction, structural and aggregation analyses of the studied systems.
Interaction and structural analyses
The pair radial distribution functions gij(r) between selected pairs of atoms or interaction centers were calculated up to r = 2.5 nm distances in the usual way.50 Total static structure factors, S(q), were also calculated from the MD trajectory data using a previously described methodology.51
Aggregation analyses
The aggregation analyses of the [C4C1im][N(CN)2], [C4C1im]-[SCN] ILs and their mixtures with water and vanillin focused on five types of issues: (i) the evaluation of the connectivity between the charged moieties of the molecular ions that compose the so-called polar network; (ii) the estimation of the interactions between the IL ions and the water molecules; (iii) the calculation of the aggregation state between the IL alkyl side chains; (iv) the evaluation of the connectivity among the vanillin molecules and an estimation of their aggregate size; and (v) the calculation of the connectivity between the IL ions and the vanillin molecules.
All these types of connectivity analyses are based on previously described algorithms52,53 that generate neighbor lists for selected interaction centers, in a three-stage sequential process: first, the different types of interaction centers are defined. In the analyses of type (i), the selected interaction centers are the center of mass of the imidazolium ring of the cation (im) and the center of mass of the anion. For type (ii) analyses we have selected the oxygen atom of the water molecule and all nitrogen atoms of the [N(CN)2] anion or the nitrogen and sulfur atoms of the [SCN] anion. Type (iii) analyses were conducted considering all the carbon atoms of the butyl chain of the cation, except the carbon atom directly connected to the imidazolium ring. For type (iv) analyses the selected interaction centres are all non-hydrogen atoms in the vanillin molecules. Finally, type (v) analyses were conducted by selecting all non-hydrogen atoms in the cation or the anion of the IL and all non-hydrogen atoms in the vanillin molecule.
Second, a connectivity threshold for each case is established by considering the corresponding gij(r) data between the selected interaction centres.52 In case (i), such a threshold was set to 0.8 nm, corresponding to the first coordination shell limit of the gij(r) data between the center of mass of the imidazolium ring of the cation (im) and the center of mass of the anion. In case (ii), the threshold was set to 0.35 nm (based on the water–anion correlation data), and in cases (iii)–(v) the threshold was set to 0.5 nm, corresponding to average intermolecular contact distances between non-hydrogen atoms evaluated from the corresponding g(r) functions.
Third, the use of the threshold criteria allows the computation of closest-neighbor lists for each interaction center for all recorded configurations in the MD trajectories, thus ascertaining the connectivity between the selected species. When the interaction centers belong to different species—cation–anion in case (i), anion–water in case (ii) and ion–vanillin in case (v)—the analyses will yield aggregates with a built-in alternation between species (e.g., in a polar network, cations are directly connected to anions and vice versa). In the case of interaction centers belonging to species of the same type— butyl–butyl in case (iii) and vanillin–vanillin in case (iv)—the corresponding aggregates correspond to clusters containing a single type of molecule/residue.
Finally, five different statistical functions were used to characterize the network/aggregates that emerge from the connectivity lists.52,53 These include (i) P(na), the discrete probability distribution function of finding a given interaction centre in an aggregate of a given size (composed of na species); (ii) Ni, the average number of first-contact neighbors of an interaction centre; (iii) Ni(na), the average number of neighbors within an aggregate of size na; (iv) Rd(na), the ratio between the longest distance between two atoms belonging to the same aggregate of size na and the simulation box diagonal; and (v) RV(na), the ratio between the apparent volume of an aggregate of size na and the volume of the simulation box. These five statistical tools have been introduced and described in more detail elsewhere.52
Results and discussion
Aiming at investigating the potential of ILs to act as hydrotropes, the solubilities of vanillin and gallic acid were determined in several aqueous solutions with variable concentrations of ILs and compared with the results obtained with common hydrotropes and salting-in inducing salts. The solubilities of vanillin and gallic acid at 303 K in pure water, measured in this work, are (11.12 ± 0.03) g L−1 (0.073 mol L−1) and (14.38 ± 0.41) g L−1 (0.084 mol L−1), respectively, and are in good agreement with data previously reported in the literature.41,54,55 All the detailed data along with the respective standard deviations are presented in ESI-Table S2.†
Effect of the IL concentration
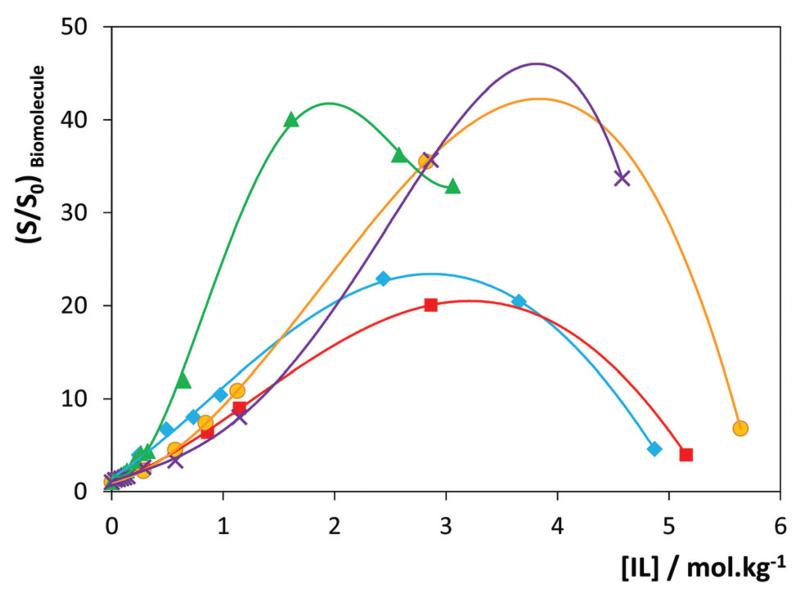
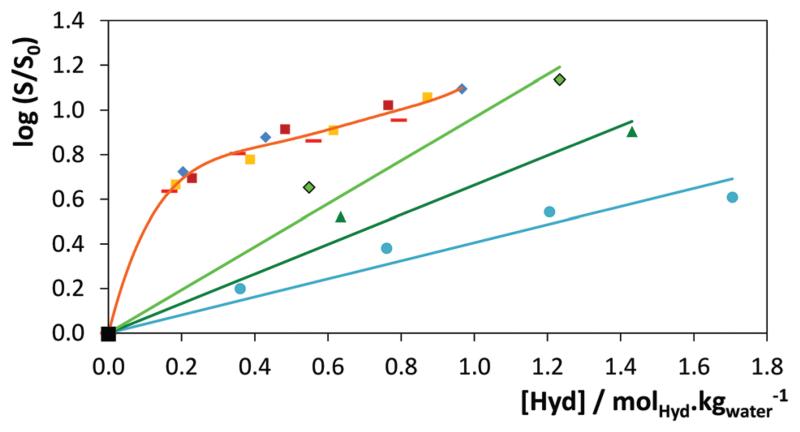
The gallic acid solubilities in aqueous solutions of [C4C1im]-[N(CN)2] and [C4C1im]Cl, and vanillin in aqueous solutions of [C2C1im][N(CN)2], [C4C1im][TOS] and [C4C1im]Cl were studied in the entire concentration range, from pure water to aqueous saturated solutions of these compounds at 303 K. The influence of the IL concentration on the solubility of gallic acid and vanillin is depicted in Fig. 3. The detailed values of solubility, and the respective standard deviations, are reported in ESI-Table S2.† The graphical representation in other units, namely the concentration of biomolecules (mol kg−1) vs. concentration of the hydrotrope (mol kg−1), and the concentration of biomolecules (g kg−1) vs. weight fraction of the hydrotrope (wt%), are also presented in ESI-Fig. S1.†
Fig. 3.
Influence of the IL concentration on the solubility of gallic acid in aqueous solutions of ( ) [C4C1im][N(CN)2], and (
 ) [C4C1im]Cl; and vanillin in aqueous solutions of (
 ) [C2C1im][N(CN)2], (
 ) [C4C1im][TOS] and (
 ) [C4C1im]Cl at 303 K. Lines are guides for the eye.
S and S0 represent the solubility (mol kg−1) of each biomolecule in the aqueous solutions of the hydrotrope and in pure water, respectively; therefore, S/S0 represents the solubility enhancement.
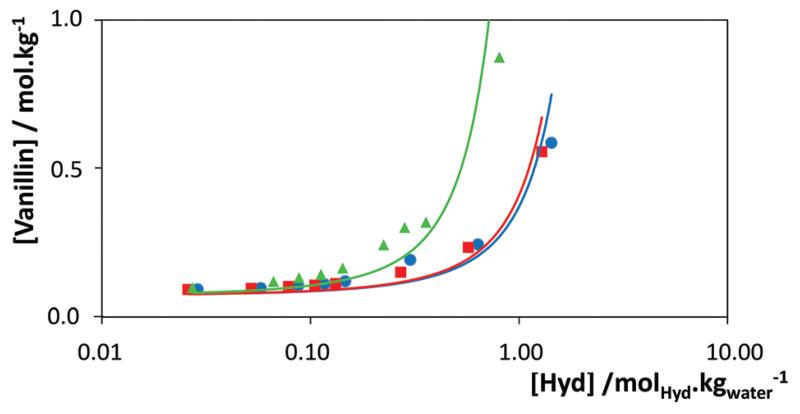
The results obtained show a synergetic effect of the two solvents on the solubility of the two antioxidants, with aqueous solutions of IL displaying a much higher capacity to solubilize the antioxidants than any of the two pure solvents, and with solubility enhancements that may reach 40-fold. These results are thus clear evidence of the exceptional capacity of ILs to act as hydrotropes. In an attempt to determine the minimum hydrotrope concentration (MHC), also referred to as the critical aggregate concentration (cac) by some authors,56 for [C4C1im]-Cl, [C4C1im][TOS], and Na[TOS], the solubility of vanillin was measured in aqueous solutions with salt concentrations ranging between 0.01 and 1.5 mol kg−1 (hydrotrope/water). The results reported in Fig. 4 do not allow clear identification of a MHC for any of the IL-related hydrotropes investigated, including Na[TOS]. These results show, in agreement with various authors,10,56,57 a continuous variation in the solubility instead of a clear change in behaviour attributable to a critical phenomenon. While the MHC concept has been extensively used in the interpretation of the hydrotropic behaviour, it has recently been dismissed by several authors that relate it with less accurate experimental measurements (as demonstrated by Subramanian and Anisimov,58–60 showing that “droplets in aqueous solutions of hydrotropes are caused by the contamination of the non-ionic hydrotrope by trace amounts of hydrophobic impurities”) or to a faulty interpretation of the experimental data.57,61 Russo and Hoffmann57 also showed that NMR chemical shift and surface tension data are not applicable to determine the MHC of short-chained ILs. According to these authors,57 these compounds “form aggregates of less defined size and shape and in more gradual concentration dependent transitions than is known to occur for surfactant molecules”. Attempts made in this work to establish the MHC of some [CnC1im]Cl, with n ≤ 6, by surface tension measurements confirm the results reported by Russo and Hoffmann57 (cf. ESI-Fig. S2†).
Fig. 4.
Influence of the IL concentration on the solubility of vanillin in aqueous solutions of ( ) [C4C1im]Cl, (
 ) [C4C1im][TOS] and (
 ) Na[TOS] to evaluate the minimum hydrotrope concentration (MHC). Lines are guides for the eye.
Effect of the IL chemical structure
In the studies reported hereafter, aqueous solutions of ILs with concentrations up to 1.6 mol kg−1 (hydrotrope/water) were used to study the impact of the IL structural features upon its ability to enhance the solubility of the investigated antioxidants.
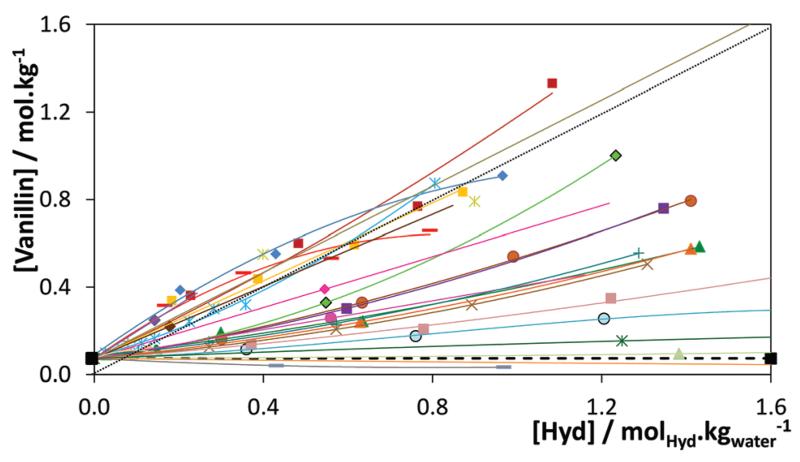
The results for a range of ILs and salts on the solubility of vanillin at 303 K are depicted in Fig. 5. The results for gallic acid are similar and are presented in ESI-Fig. S4.† These results emphasize the role of the ILs’ chemical structure on their performance as hydrotropes, while highlighting their superior capability when compared with conventional hydrotropes and salting-in inducing salts, e.g., Na[C6H5O7], Na[C7H5O2], Na[TOS], Na[SCN] and Na[N(CN)2].
Fig. 5.
Influence of the hydrotrope (ionic liquids and conventional salts) concentration on the solubility of vanillin in aqueous solutions at 303 K: (---, ∎) pure water, ( ) [C2C1im]Cl, (
 ) [C4C1im]Cl, (
 ) [C6C1im]Cl, (
 ) [C8C1m]Cl, (
 ) [C10C1im]Cl, (
 ) [C12C1im]Cl, (
 ) [C14C1im]Cl, (
 ) [C2C1im] [N(CN)2], (
 ) [C4C1im][N(CN)2], (
 ) [C4C1py][N(CN)2], (
 ) [C4C1py]Cl, (
 ) [C4C1pyrr]Cl, (
 ) [C4C1pip]Cl, (
 ) [C4C1im][TOS], (
 ) [C4C1im][SCN], (
 ) Na [C7H5O2], (
 ) Na[SCN], (
 ) Na[C6H5O7], (
 ) NaCl, (
 ) [N4444]Cl, (
 ) Na[TOS], (
 ) [P4444]Cl, (
 ) [N4444][TOS], (
 ) [P4441][TOS], and (
 ) Na[N(CN)2]. Lines are guides for the eye.
For a more detailed analysis of the IL structural features (anion nature, cation core and cation alkyl side chain length), the Setschenow equation62 was used:
| (1) |
where S and S0 are, respectively, the solubility (mol kg−1) of each biomolecule in the hydrotrope aqueous solution and in pure water, CHyd is the concentration of hydrotrope in aqueous solution (mol kg−1) and KHyd is the hydrotropy constant (kg−1 mol). The hydrotropy constants, KHyd, were estimated for each system studied and are reported, along with their standard deviations, in Table 1.
Table 1.
KHyd values for the various hydrotropes studied in the solubility of vanillin and gallic acid at 303 K ± 0.5 K
|
KHyd (kg−1 mol) ± σ |
Selectivity = KHyd Van/ KHyd GA |
||
|---|---|---|---|
| Hydrotrope | Vanillin | Gallic acid | |
| [C2C1im]Cl | 0.406 ± 0.006 | ||
| [C4C1im]Cl | 0.706 ± 0.014 | 0.786 ± 0.041 | 0.90 |
| [C6C1im]Cl | 0.966 ± 0.031 | ||
| [C8C1im]Cl | 1.344 ± 0.042 | 0.885 ± 0.013 | 1.52 |
| [C10C1im]Cl | 1.365 ± 0.064 | ||
| [C12C1im]Cl | 1.442 ± 0.038 | ||
| [C14C1im]Cl | 1.488 ± 0.023 | ||
| [C4C1im]Br | 0.646 ± 0.012 | ||
| [C4C1im][SCN] | 0.978 ± 0.017a | 0.703 ± 0.016 | 1.39 |
| [C4C1im][TOS] | 1.584 ± 0.053 | 1.035 ± 0.048 | 1.53 |
| [C4C1im][CH3SO4] | 0.808 ± 0.031 | ||
| [C4C1im][CF3SO3] | 0.842 ± 0.024 | ||
| [C4C1im][N(CN)2] | 1.335 ± 0.021a | 1.013 ± 0.049 | 1.32 |
| [C2C1im][N(CN)2] | 0.819 ± 0.039 | ||
| [C4C1py][N(CN)2] | 3.721 ± 0.036b | 1.238 ± 0.023 | 3.01 |
| [C4C1py]Cl | 0.800 ± 0.058 | 0.775 ± 0.036 | 1.03 |
| [C4C1pip]Cl | 0.826 ± 0.037 | 0.716 ± 0.015 | 1.15 |
| [C4C1pyrr]Cl | 0.666 ± 0.023 | 0.660 ± 0.042 | 1.01 |
| [N1112(OH)]Cl | 0.323 ± 0.011 | ||
| [N4444]Cl | 1.321 ± 0.009 | −0.731 ± 0.009 | −1.81 |
| [P4444]Cl | 2.684 ± 0.007b | −0.744 ± 0.007 | −3.61 |
| Na[SCN] | 0.099 ± 0.002 | −0.022 ± 0.001 | −4.50 |
| Na[C7H5O2] | 0.515 ± 0.003 | 0.228 ± 0.003 | 2.26 |
| Na[C6H5O7] | −0.393 ± 0.008 | 0.559 ± 0.004 | 0.70 |
| NaCl | −0.126 ± 0.002 | −0.078 ± 0.002 | 1.62 |
| Na[TOS] | 0.745 ± 0.034 | 0.427 ± 0.025 | 1.74 |
| [N4444][TOS] | 1.542 ± 0.065b | 2.306 ± 0.096b | 0.67 |
| [P4441][TOS] | 3.977 ± 0.098b | 2.832 ± 0.035a | 1.40 |
Forms two liquid–liquid phases with IL aqueous solutions at concentrations above 10 wt%.
Forms two liquid–liquid phases with IL aqueous solutions at concentrations above 5 wt%.
The higher the KHyd values, the higher is the ability of a given compound to act as a hydrotrope. The hydrotropic capacity of the different ILs and salts on the solubility of vanillin follows the order: Na[C6H5O7] > NaCl > Na[SCN] > Na[N(CN)2] > [C2C1im]Cl > Na[C7H5O2] > [C4C1pyrr]Cl > [C4C1im] Cl > Na[TOS] > [C4C1py]Cl > [C2C1im][N(CN)2] > [C4C1pip]Cl > [C6C1im]Cl > [C4C1im][SCN] > [N4444]Cl > [C4C1im][N(CN)2] > [C8C1im]Cl > [C10C1im]Cl > [C12C1im]Cl > [C14C1im]Cl > [N4444][TOS] > [C4C1im][TOS] > [P4444]Cl > [C4C1py][N(CN)2 > [P4441][TOS]. This pattern reflects the effects of the cation core, anion nature and alkyl side chain length in ILs through their ability to act as hydrotropes. Furthermore, the results obtained for gallic acid allow the evaluation of the effect of a broad range of cation families and anions upon the hydrotropic effect. The hydrotropy effect increases in the following order: [P4444]Cl ≈ [N4444]Cl ⪢ NaCl > Na[SCN] > Na[C7H5O2] > [N1112(OH)]Cl > Na[TOS] > Na[C6H5O7] > [C4C1im]Br > [C4C1pyrr]Cl > [C4C1im] [SCN] > [C4C1pip]Cl > [C4C1py]Cl > [C4C1im]Cl > [C4C1im] [CH3SO4] > [C4C1im][CF3SO3] > [C8C1im]Cl > [C4C1im][N(CN)2] > [C4C1im][TOS] > [C4C1py][N(CN)2] > [N4444][TOS] > [P4441][TOS]. A detailed discussion on the effect of the chemical structures of the ionic liquid cations and anions is presented below.
Effect of the ionic liquid cation
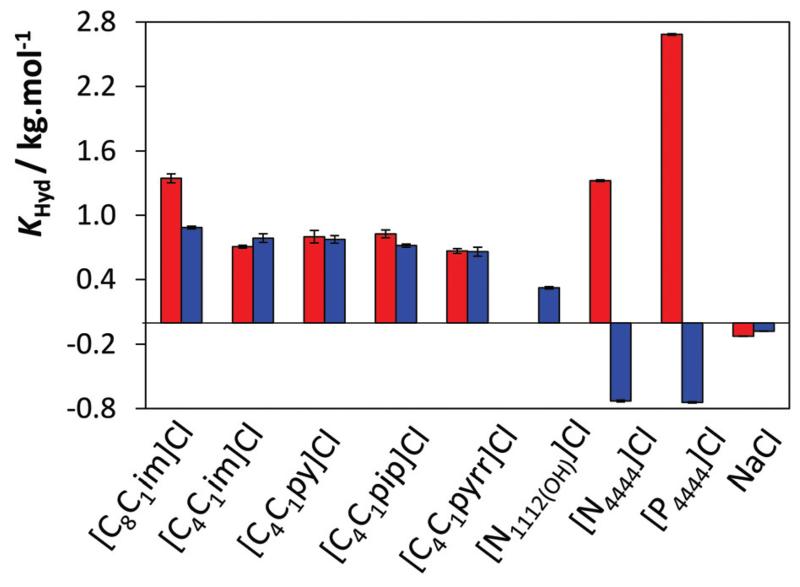
As depicted in Fig. 6, the solubilities of vanillin and gallic acid decrease only slightly in the presence of NaCl, reflecting thus the weak salting-out effect of this inorganic salt.
Fig. 6.
KHyd values for vanillin (red) and gallic acid (blue) using Cl-based hydrotropes.
This trend suggests that neither Na+ nor Cl− has a significant effect on the solubility of the two antioxidants in water as Na+ and Cl− are both ranked in the middle of the Hofmeister series.63 Therefore, in order to better evaluate the isolated impact of given cations and anions, a series of sodium salts and chloride ILs were used in this work.
The various cations studied cover aromatic (imidazolium and pyridinium), cyclic non-aromatic (piperidinium and pyrrolidinium), and non-cyclic non-aromatic (phosphonium and ammonium). Fig. 6 depicts the values of the hydrotropy constants obtained for the solubility of vanillin and gallic acid in aqueous solutions of Cl-based hydrotropes. With the exception of the cholinium-based IL that seems to present only a small effect upon the solubility of gallic acid (KHyd = 0.323 kg−1 mol), all other IL cations lead to an important hydrotropic effect. It should be remarked that the quaternary ammonium- and phosphonium-based ILs have opposite effects on the solubility of vanillin and gallic acid.
Although the formation of solute–hydrotrope complexes based on π…π interactions has been used to explain the hydrotropy concept,14–17 the results obtained here clearly show that the hydrotropic effect cannot be explained as resulting only from π…π interactions (between the aromatic antioxidant and the aromatic cation cores) as the non-aromatic cations studied also induce a significant increase of the antioxidant solubility. Results that confirm this evidence were obtained, for instance, with the non-aromatic [C4C1pip]Cl and [C4C1pyrr]Cl. This is in good agreement with various authors8,13,64,65 that have previously ruled out π…π interactions as the dominant effect governing the hydrotropy. This trend also discards the possibility that the hydrotropy of ILs could be related to clathrate formation as proposed by Rogers and co-workers66,67 and Rebelo and co-workers68,69 to explain the enhanced solubility of benzene in pure aromatic ILs. UV spectroscopy of the solutions studied here also rules out the formation of complexes as no changes in the spectra of the solute or the ILs were observed (cf. ESI Fig. S5†).
It is also worth mentioning that the hydrotrope effect is often solute specific, as shown by [N4444]Cl and [P4444]Cl, both presenting large KHyd for vanillin but not for gallic acid. The strong variations on the hydrotropy selectivities, calculated as
| (2) |
reported in Table 1, also clearly emphasize that the solute specificity of the hydrotropes can be of high value to design extraction and purification processes. In eqn (2), KHydVan and KHydGA are the hydrotropy constants (kg−1 mol) of vanillin and gallic acid respectively.
The results reported here reveal that, while most common hydrotropes present aromatic anions in their constitution, the hydrotropic effect can be induced by both aromatic and non-aromatic cations. There are few cationic hydrotropes known,1 and only in the past few years some sparse studies using quaternary ammonium-based salts were reported.70–72 In summary, the results obtained here clearly support that ILs may constitute a novel series of cationic hydrotropes.
Effect of the cation alkyl side chain length
Fig. 7 depicts the variation of the solubility of vanillin in aqueous solutions of [CnC1im]Cl ILs, with 2 ≤ n ≤ 14, with the hydrotrope concentration.
Fig. 7.
Influence of the ionic liquid concentration on the vanillin solubility at 303 K: (∎), pure water, ( ) [C2C1im]Cl, (
 ) [C4C1im]Cl, (
 ) [C6C1im] Cl, (
 ) [C8C1im]Cl, (
 ) [C10C1im]Cl, (
 ) [C12C1im]Cl, and (
 ) [C14C1im]Cl.
The results depicted in Fig. 7 clearly show two different behaviors. For ILs from [C2C1im]Cl to [C6C1im]Cl, the hydrotropy constant increases with the cation alkyl side chain length, with the solubility follows an exponential dependency with the hydrotrope concentration, as predicted by the Setschenow equation. On the other hand, for the ILs with longer alkyl side chains ([CnC1im]Cl, n = 8–14), the solubility of vanillin along with the IL concentration no longer obeys eqn (1) and all the compounds have a similar impact on the solubility irrespective of their alkyl side chain lengths. These two patterns suggest that two different mechanisms of enhanced solubility are at play in these systems. For the lighter compounds ([CnC1mim]Cl, n = 2–6) the hydrotropic behavior is witnessed. As it results from the formation of co-aggregates between the solute and the hydrotropes, as discussed below in more detail, the hydrotropic efficiency increases with the cation alkyl chain length.2,56,73
However, for ILs with self-aggregation ability in aqueous solution (above [C8C1im]Cl74), the hydrotropy is replaced by a micellar solubilization mechanism. For these compounds, the enhancement of solubility is very active at low concentrations of IL, close to the critical micellar concentration, but seems to quickly saturate at around 0.2 mol kg−1, above which a much weaker effect on solubility is observed. Indeed, for higher hydrotrope concentrations (around 1–1.2 molIL kgwater−1), the hydrotropic effect of [C6C1im]Cl upon the solubility of vanillin becomes more important than that observed with ILs of longer alkyl side chains.
These results are in good agreement with the results of Shimizu and collaborators23,24 that, based on the Kirkwood–Buff (KB) theory of solutions, showed that “micelle formation reduces the solubilization efficiency per hydrotrope molecule”.
Effect of the ionic liquid anion
Most of the industrially used hydrotropes are anionic, and often contain a phenyl group.4 Along with the evaluation of ILs as hydrotropes, the effect of some common hydrotropes was also ascertained.
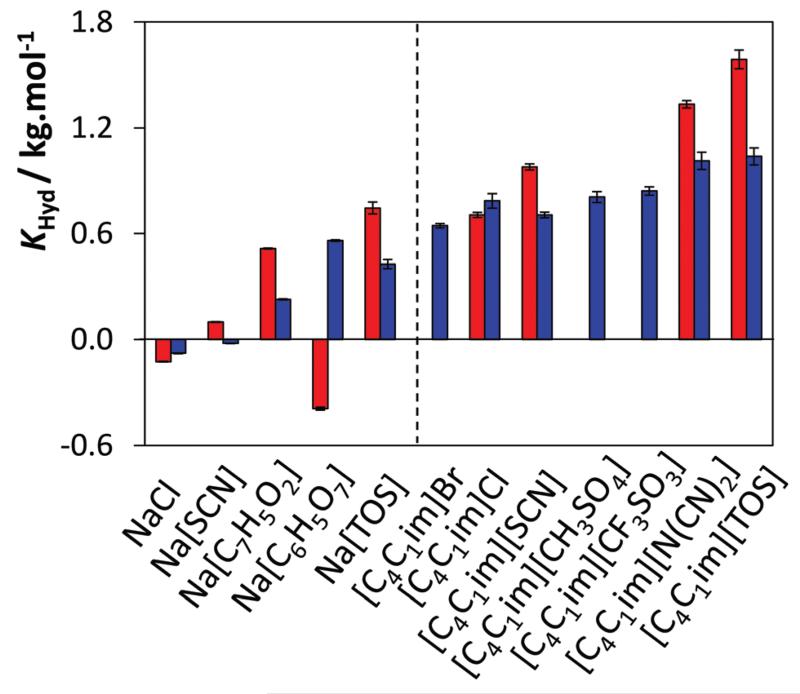
According to the results presented in Table 1 and Fig. 8, the only salts that seem to display hydrotropic activity for both biomolecules are sodium benzoate (KHyd of 0.514 kg−1 mol for vanillin and 0.228 kg−1 mol for gallic acid) and sodium tosylate (KHyd of 0.746 kg−1 mol for vanillin and 0.428 kg−1 mol for gallic acid), i.e., those with an aromatic anion. Sodium citrate is only able to enhance the solubility of gallic acid (KHyd = 0.560 kg−1 mol) whereas it seems to decrease the solubility of vanillin (KHyd = −0.393 kg−1 mol) in aqueous solutions.
Fig. 8.
KHyd values for vanillin (red) and gallic acid (blue) using [C4C1im]-and Na-based hydrotropes.
These results again confirm that the hydrotropicity may be strongly solute dependent, allowing thus the design of an extraction process based on the hydrotrope selectivity. On the other hand, sodium chloride and sodium thiocyanate have no significant effect upon the solubility of the two antioxidants even with the latter inducing a slight salting-in behaviour.
Most conventional hydrotropes have ammonium, calcium, potassium or sodium as counter ions,4 but the effect of the counter ion has been seldom explored. However, the results reported here reveal that the role of the counter ion could be highly relevant, as demonstrated by the KHyd values presented in Table 1.
For vanillin, the hydrotropic efficiency of the anion of the [C4C1im]-based ILs follows the series:
while for gallic acid, the trend on the enhanced solubility by [C4C1im]-based ILs follows the rank:
Knowing that NaCl induces a minor salting-out of gallic acid and vanillin in aqueous media, the anions in compounds displaying a KHyd lower than chloride have thus a deleterious effect on the cation hydrotropicity. Chloride and all the anions to its left in these series do not present a hydrotropic behaviour and thus do not contribute to enhance the solubility of the studied biomolecules. Dicyanamide and tosylate anions display, however, the opposite effect. Tosylate, a common name for p-toluene sulfonate, is indeed a well-known hydrotrope;1–4 yet, the action of [N(CN)2]− as hydrotrope is, to the best of our knowledge, reported here for the first time. Both anions contribute to a further enhancement of the cation hydrotropicity in a synergistically, almost additive, manner. While in the previous section it was shown that ILs are a novel class of cationic hydrotropes, these results suggest that when combined with an anion with a hydrotropic capacity, an even more powerful catanionic hydrotrope is generated.
As shown in Fig. 3 and 8, the hydrotropic effect of the studied compounds is, in general, stronger on the solubility of vanillin than on the solubility of gallic acid. The Kow of vanillin is 1.2275 while for gallic acid it is 0.72,75 suggesting that the hydrotropic solubilisation may be more effective for more hydrophobic solutes. Yet, this general rule may be overruled by specific interactions that could explain the significant differences in solubility observed between the two compounds, suggesting that the hydrotrope–solute interactions on the gallic acid aggregates are of a different nature than those with vanillin, being this the cause for the hydrotrope selective enhancement of solubility. The results reported in Table 1 suggest also that the cation and the anion may have different roles in the hydrotropy, with the cation effect being dominated by the hydrophobicity of the solute while the anion seems to present specific interactions. This may however be related to the specific nature of the solutes studied here and their hydrogen bond donor abilities that can be matched by the anions’ hydrogen bond acceptor nature that is absent in the cations.
In summary, the results reported here clearly show the capability of ILs to act as hydrotropes selectively enhancing the solubility of each compound depending on the IL characteristics, on the solute hydrophobicity and, in general, on how the solute interacts with and participates in the formation of aggregates in aqueous solutions of ILs as discussed below.
A curious and unexpected outcome was observed for some of these mixtures for which, above a critical concentration of IL, a biphasic system was formed as shown in Fig. S6 (cf. the ESI†). The systems, for which two phases were observed, are reported in Table 1. As the solute does not present a salting-out inducing nature, which could explain the biphasic system formation in the same light of the formation of IL-based aqueous biphasic systems (ABS),30 the coexisting phases were quantified by UV-spectroscopy, and NMR spectroscopy was employed to understand the phase separation and shed further light on the mechanism of hydrotropicity evidenced in this work.
The top and bottom phases of the biphasic system created by vanillin, [C4C1im][N(CN)2] and water were quantified by UV-spectroscopy, and the bottom phase was revealed to have twice the concentration of IL and 5 times more vanillin than the top phase. Aqueous solutions of [N4444][TOS] and [P4441][TOS], at concentrations of approximately 0.28 molIL kgwater−1 and 0.62 molIL kgwater−1, respectively, were also tested for the solubilisation of vanillin and gallic acid. In all situations, the system separated into two liquid phases. For the first system, the bottom phase showed almost 21 times more [N4444][TOS] and 18 times more vanillin than the top phase. For the second system, the bottom phase presented almost 20 times more [N4444][TOS] and 12 times more vanillin than the top phase. To gather further insights into the molecular-level mechanisms responsible for the phase separation at given concentrations of hydrotrope and antioxidant, NMR spectra were collected for each phase. All the systems analysed further confirm that, unlike for IL-based ABS, there is not a significant separation of the IL and demixing inducer between the two aqueous phases. These observations suggest that, unlike the pure IL that is hydrophilic and thus completely water miscible, the IL + solute aggregates, whose presence is demonstrated and discussed below, are of a different nature, being more hydrophobic and not fully water miscible, leading therefore to the formation of two liquid phases: one water-rich phase with little solute and hydrotrope (IL) and another phase rich in hydrated IL where the biomolecules are highly soluble.
Effect of temperature
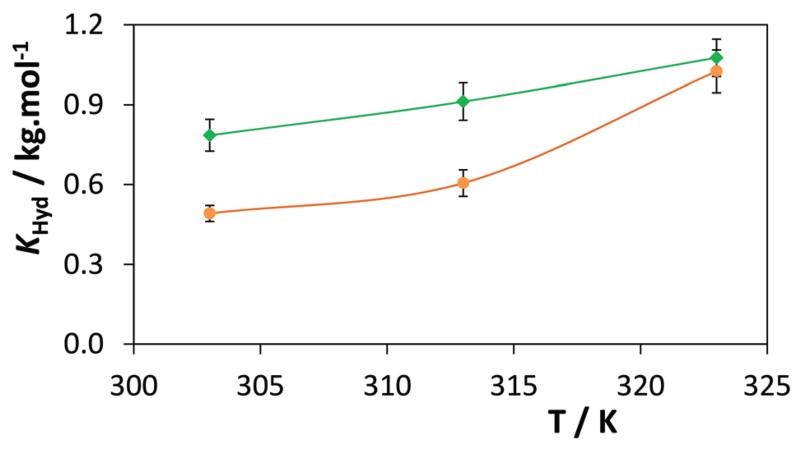
The temperature impact on the hydrotropic solubility of the biomolecules investigated was also evaluated. For that purpose, the solubility of vanillin was investigated in aqueous solutions of [C2C1im][N(CN)2] and sodium benzoate. Fig. 9 shows the effect of temperature upon the KHyd values between 303 and 323 K.
Fig. 9.
KHyd temperature dependence for the solubility of vanillin in aqueous solutions of ( ) [C2C1im][N(CN)2] and (
 ) [Na][C7H5O2].
The data concerning the influence of [C2C1im][N(CN)2] and sodium benzoate on the solubility of vanillin at 303, 313 and 323 K are presented in ESI-Table S3.†
In general, a significant increase in the solubility of vanillin with an increase in temperature is observed. This enhanced solubility promoted by hydrotropes is even more striking when compared with the increase of the solubility of vanillin in water with temperature, which is quite low as shown in ESI-Fig. S7.† This trend, resulting from a decrease in size and an increase in the number of aggregates with temperature as revealed by DLS, suggests that the effects of the hydrotrope concentration and temperature can be combined to achieve a maximum effect at both the solubilisation and the recovery of the solute, as discussed below.
Dynamic light scattering
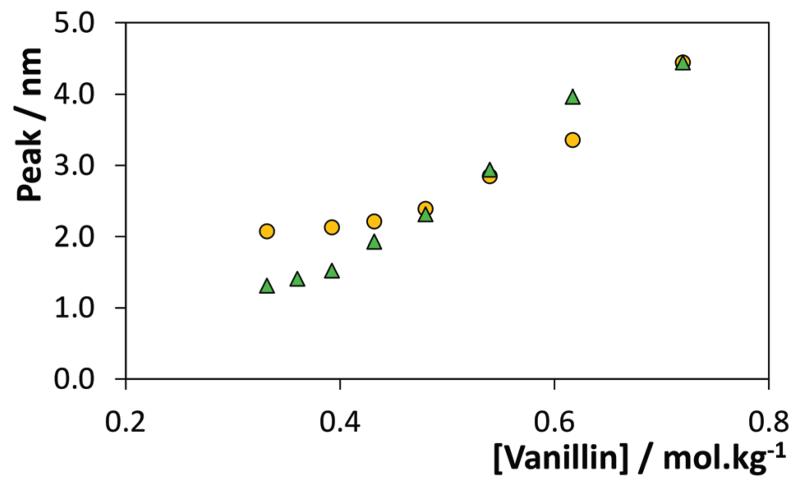
In order to probe the mechanism of hydrotropy previously highlighted, some of the aqueous solutions containing vanillin and hydrotropes were analysed by dynamic light scattering (DLS). This study started by the evaluation of the presence of aggregates in aqueous solutions of IL or vanillin. No aggregates were observed in aqueous solutions of [C4C1im][TOS] at 0.64 molIL kgwater−1 or vanillin close to saturation (after homogenization of the mixture on an ultrasonic bath at room temperature). DLS measurements were then performed for solutions of variable concentrations of vanillin in 0.64 molIL kgwater−1 of [C4C1im][TOS]. The results depicted in Fig. 10 confirm the presence of aggregates that increase in size with an increase of the vanillin concentration.
Fig. 10.
Aggregate size change with the vanillin concentration: ( ) constant hydrotrope concentration, i.e., different vanillin/IL ratios, and (
 ) constant ratio between the vanillin and hydrotrope concentrations.
An aqueous solution of vanillin at 0.73 mol kgwater−1 and IL at 0.80 mol kgwater−1 was then diluted with pure water aiming at evaluating the change in the size of aggregates at a fixed vanillin/IL ratio. As shown in Fig. 10, an increase in the size of aggregates with the vanillin/IL concentration is also observed. These results clearly establish the presence of aggregates in aqueous solution, but only when both the hydrotrope and vanillin are present, and show that the molecular mechanism which dominates the hydrotropy is related with the formation of hydrotrope–solute aggregates. Dhinakaran et al.42 proposed that the increased solubility of vanillin in conventional hydrotrope solutions is justified as a collective molecular phenomenon, possibly occurring by the aggregation of the solute with the hydrotrope due to improved hydrogen-bonding. The most detailed and comprehensive studies on the hydrotropic solubilisation were recently reported by Shimizu and coworkers.10,23,24 They clearly established, based on the interpretation of experimental data using the fluctuation theory of solutions, that the mechanism of hydrotropic solubilisation is dominated by the hydrotrope–solute aggregation.23 In the same line, the results reported here show that the solute molecules must take part in the aggregation process of the hydrotrope, thus forming co-aggregates with the hydrotrope molecules in aqueous solution. The formation of a stable co-aggregate depends on the molecular structure of both cations and anions, as well as on the functional group(s) of the solute, that would control their interactions further responsible for the formation of stable aggregates. The variation of the aggregate size when the ratio of vanillin/IL is changed (yellow circles in Fig. 10) or kept constant (green triangles in Fig. 10) suggests however that the aggregate formation does not result from a stoichiometric complex between vanillin and the IL, unlike what was previously observed by some authors for the solubility of benzene in aromatic ILs.66–69
Nuclear magnetic resonance
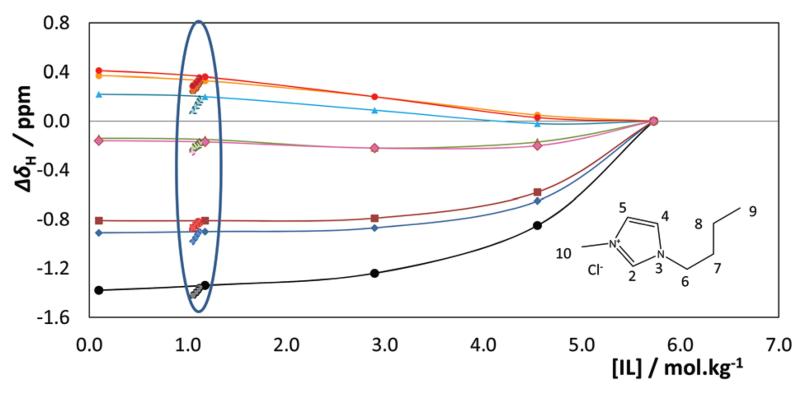
1H-NMR spectra were collected for aqueous solutions of [C4mim]Cl in a concentration range from 0.1 to 5.73 mol kg−1 (pure IL). The results are presented in Fig. 11 and show regular chemical shift deviations with the protons of the ring region presenting negative deviations due to the favorable polar interactions with water, in particular the C(2) proton which presents a very large shift resulting from its hydrogen bond with the solvent. The protons of the alkyl chain, in particular those of C(7), C(8) and C(9), have the opposite type of deviations as they have poor interactions with water as expected.
Fig. 11.
1H NMR chemical shift deviations of [C4C1im]Cl in aqueous solutions relative to pure [C4C1im]Cl (5.7 mol kg−1): (●) H(2), ( ) H(4), (
 ) H(5), (
 ) H(6), (
 ) H(7), (
 ) H(8), (
 ) H(9), and (
 ) H10. Effect of the vanillin concentration within the blue ellipse.
The 1H NMR spectra of ternary mixtures of water–[C4C1im]-Cl–vanillin were collected for mixtures at fixed vanillin concentrations of 0.05 mol kg−1 and 0.13 mol kg−1 while varying the IL concentration from 0.1 to 1.4 mol kg−1. As shown in ESI-Fig. S8,† no significant chemical shift deviations of the vanillin were observed in any of these solutions. 1H NMR spectra were also collected for vanillin solutions with concentrations up to 0.43 mol kg−1 prepared from an initial aqueous solution of IL at 1.13 mol kg−1. The chemical shift deviations of the IL protons are presented also in Fig. 11 within the blue ellipse. Unlike what was observed for the vanillin that seems to suffer no effect from the IL in a much broader concentration region, the effect of the vanillin upon the IL is quite significant.
While the protons on the polar region further increase their deviations from what was observed due to the mixture with water, suggesting that novel polar interactions between the vanillin and the ring protons are happening, and as will be confirmed below by the MD simulations, the chemical shifts of the protons on the alkyl chain have the opposite behaviour, with their deviations decreasing and approaching the values for the pure IL, suggesting thus that the environment of the alkyl chains becomes again less polar. These results suggest that the chains may be interacting with the nonpolar regions of vanillin or organizing themselves into non-polar domains. The molecular picture that can derive from the 1H NMR spectra is one of reorganization of the IL cations in solution due to the presence, and their interactions with, vanillin molecules.
Molecular dynamics simulations
The existence of co-aggregates between the hydrophobic solute and the IL ions in aqueous solution was further probed by molecular dynamics simulations. Three types of model system were considered: (i) aqueous solutions containing the hydrotrope (ILs based on the 3-butyl-1-methylimidazolium cation combined with either the thiocyanate or the dicyanamide anions, [C4C1im][SCN] or [C4C1im][N(CN)2]); (ii) aqueous solutions containing the vanillin hydrophobic solute; and (iii) aqueous solutions containing both the hydrotrope and the hydrophobic solute species. Simulation boxes containing the pure IL were also produced in order to act as a reference for the aggregation patterns of the ionic species. All molecules/ions were modelled according to well-known and tested atomistic force-fields commonly used for mixtures of ionic liquids with molecular solutes/solvents (cf. the Experimental section).
In order to match the concentration ranges of the aqueous solutions tested experimentally, we used simulation boxes (i) containing 101 [C4C1im][N(CN)2] or 105 [C4C1im][SCN] ion pairs together with 4600 water molecules, corresponding to identical IL weight fractions of 0.2000, or to concentrations of 1.220 and 1.268 mol kg−1, respectively; (ii) containing 100 vanillin molecules in 4600 water molecules (this is well above the solubility limit of vanillin in pure water and, as expected, the simulations yielded a vanillin-rich droplet segregated from a water-rich phase); and (iii) 100 vanillin molecules combined with 101 or 105 hydrotrope ion pairs and 4600 water molecules. Taking into account the KHyd values listed in Table 1 for the [C4C1im][N(CN)2] and [C4C1im][SCN] hydrotropes (0.978 and 1.335 kg−1 mol), the simulated vanillin–IL–water mixtures should contain a single phase in the case of the [C4C1im]-[N(CN)2] hydrotrope mixture and two phases in the case of the [C4C1im][SCN] hydrotrope mixture. The use of relatively large concentrations of hydrotrope and vanillin in the simulation boxes (close to or above the solubility limit of vanillin in the aqueous solutions) is related to the necessity of having adequate statistics in the MD run trajectories and ensuing structural and aggregate analyses. Moreover, comparing the different systems at similar IL and vanillin mole or weight fractions allowed us to compare directly the distinctive aggregation patterns that occurred in the different situations.
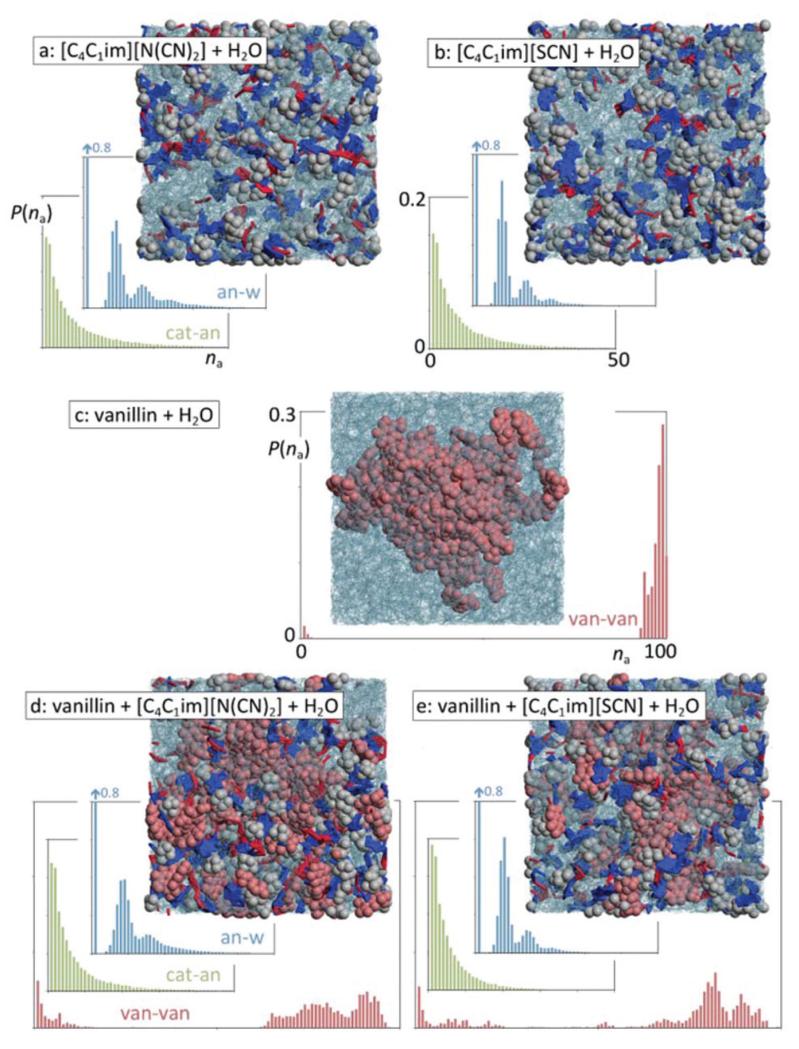
Fig. 12 shows five snapshots of the equilibrated simulation boxes. Boxes a and b highlight the structure of diluted solutions of the hydrophilic [C4C1im][N(CN)2] and [C4C1im][SCN] ILs in water: the continuous polar network that is the hallmark of most pure ionic liquids is broken into smaller aggregates, which nevertheless can still incorporate in some cases a few tens of alternating ions—the size distribution probability functions, P(na), of those polar aggregates can be seen in the graphs with green bars in Fig. 12a and b.
Fig. 12.
Simulation snapshots and discrete probability distribution functions of aggregate sizes, P(na), for different types of systems and aggregate types. (a, b) Ionic liquid aqueous solutions; (c) water–vanillin mixture; (d, e) vanillin in ionic liquid aqueous solutions. (Green graphs): ionic liquid polar aggregates (strands); (blue graphs): anion–water network; (red graphs) vanillin clusters.
In other words, the “dissolved and diluted” IL is not simply a set of isolated ions solvated by water molecules, but rather a series of small (and not so small) filamentous ionic strands incorporated within the liquid water matrix. Aggregate analyses of those strands show that the number of neighbours of each ion in a given strand (calculated using the Ni(na) described in the Experimental section) is never much larger than two, which confirms the non-branched and filamentous nature of the aggregates. Moreover, their estimated volume-to-length ratio, RV(na)/Rd(na), is generally below 0.03, which means that their shapes can be approximated to elongated prolate ellipsoids.
The incorporation of such strands in the aqueous solution can be further probed by the analysis of anion–water aggregates (graphs with blue bars in Fig. 12a and b) that show that the interactive centers of the anions (the nitrogen atoms of dicyanamide and the sulphur and nitrogen atoms of thiocyanate) undergo specific H-bond-type interactions with the hydrogen atoms of the water molecules and help to create small networks of alternating water molecules and anions that can contain a few tens of species. It is interesting to note that whereas around 80% of the water molecules do not contact any anion (at the tested concentrations the ionic liquid only occupies less than 20% of the total volume of the solution), the remainder 20% of the water molecules become part of clusters that are composed of several anions. In fact, the size distribution of the clusters mimics the distribution of the IL clusters present in the solution. In other words, the interactions between the anions and the water molecules help to stabilize those filamentous IL clusters in the midst of the aqueous solution. This complex and unique structure will play an important role in terms of hydrotropy (see below).
It must also be stressed that, unlike the polar moieties of the ions, the alkyl side chains of the cations (butyl groups in the present case) do not form noticeable aggregates. The corresponding aggregate size distribution functions (not shown) indicate that around 65% of the butyl chains remain isolated from each other, some 24% form pairs, and the remainder 11% are aggregated into clusters with just 3–5 chains. This confirms that the role of these short-tailed ILs as hydrotropes cannot be attributed to surfactant-type effects such as the possibility of micelle formation.
Fig. 12c shows the above-mentioned vanillin-rich droplet segregated from a water-rich phase. In this case, the MD trajectory evolved naturally to a situation of liquid–liquid demixing (albeit at a nanometric scale due to the size limitations of the simulated system) and illustrates nicely the difference between the one-phase situation of the hydrophilic IL aqueous solutions (boxes a and b) and the two-phase split that occurs in the hydrophobic solute system (box c). It is important to note that both types of system have similar solute concentrations. The graph in Fig. 12c shows the size distribution function of aggregates containing vanillin molecules. The distribution shows that most vanillin molecules can be found in very large aggregates comprising mostly of the vanillin molecules present in the system (an example of such droplets is the one represented in the snapshot) in equilibrium with a few vanillin molecules isolated in the aqueous phase (the small bars on the left-hand side of the graph). This distribution illustrates the aforementioned phase separation. The average number of contact neighbours, Ni, of a given vanillin molecule within the droplet is around 9.8.
Fig. 12d and e show hydrotrope effects in action, when an aqueous solution containing an ionic liquid is mixed with vanillin. Both snapshots illustrate that the integrity of the original vanillin droplet (Fig. 12c) is broken and several fragments are solvated by the hydrotrope–water solution. Interestingly, the distribution functions of the polar aggregates and the anion–water network (green and blue graphs, respectively) show only small shifts to smaller aggregation sizes relative to the analogous functions of Fig. 12a and b. This means that the small IL strands stabilised by their water–anion interactions continue to exist in the presence of the vanillin molecules. On the other hand, the vanillin aggregate distribution functions (red graphs) show noticeable shifts relative to the situation in Fig. 12c: the presence of the hydrotrope is promoting the mixing of the vanillin molecules in the aqueous phase. The average number of vanillin neighbours, Ni, within the broken vanillin clusters drops from the original 9.8 value to average values of 5.3 and 5.2 in the aqueous [C4C1im][N(CN)2] and [C4C1im][SCN] systems, respectively: the clusters are not only smaller but are also intermeshed with other species.
In order to check the origin of the hydrotrope effect one must analyse in detail the interactions between the IL strands and the vanillin molecules.
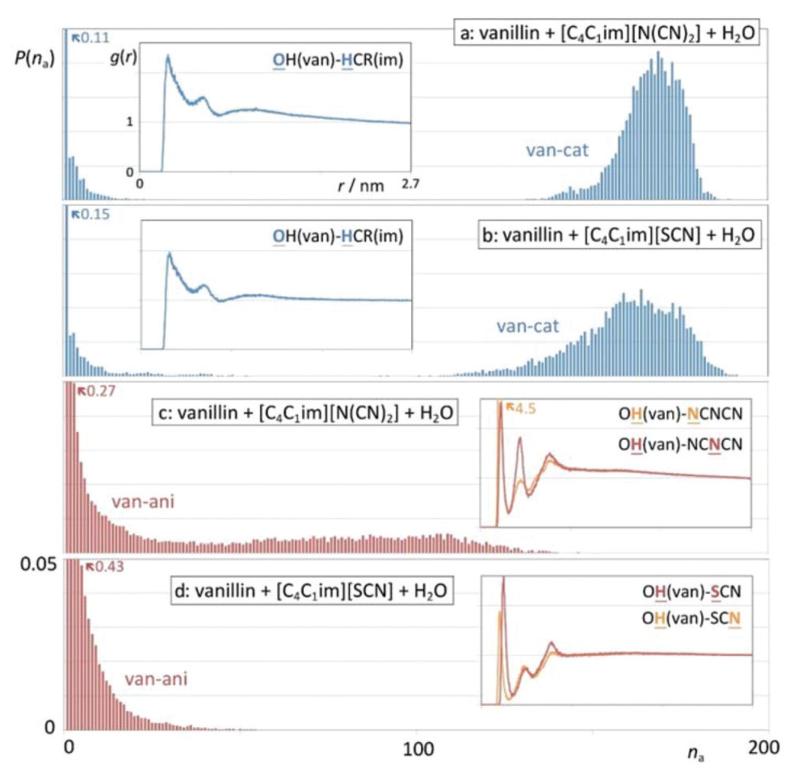
Fig. 13 shows relevant aggregate distribution functions along with selected radial distribution functions that probe the intensity of different ion–vanillin interactions. Fig. 13a and b show the aggregate size distribution functions corresponding to the alternate clustering of 1-butyl-3-methylimidazolium cations and vanillin molecules.
Fig. 13.
Discrete probability distribution functions of aggregate sizes, P(na), and (as insets) pair radial distribution functions, g(r), for different types of aggregate types and pairs of interaction centre. (a, b) Size distribution of cation–vanillin aggregates and cation–vanillin interactions in the systems with (a) [N(CN)2]-induced and (b) [SCN]-induced hydrotropy. (c, d) Size distribution of anion–vanillin aggregates and anion–vanillin interactions in the systems with (c) [N(CN)2]-induced and (d) [SCN]-induced hydrotropy.
The “van–cat” distribution function of Fig. 13a corresponding to the [C4C1im][N(CN)2] aqueous solution shows that only 11% of the cations or vanillin molecules are not in contact with the other species and that most of them are part of very large clusters with 140 < na < 185 (with a maximum probability around na = 170).
These mixed cation–vanillin clusters are formed due to favourable interactions between the two species, not only dispersion forces between their less polar moieties (the butyl chain of the cation, the aromatic ring and the ether group of vanillin), but also between specific interaction centres located in each of them. One such interaction—between the oxygen atom of the hydroxyl group of vanillin (OH) and the most acidic aromatic hydrogen atom of the imidazolium ring (HCR)—is quantified in the inset of Fig. 13a that shows the corresponding pair radial distribution function. Integration below the first peak of the g(r) function shows that about 35% of the vanillin–cation contacts involve an OH–HCR interaction.
Fig. 13b shows that the vanillin–cation clusters in the [C4C1im][SCN] aqueous solutions (120 < na < 185, with a maximum probability around na = 160) are not as big as those found in the [C4C1im][N(CN)2] solutions. The comparison of the two insets of Fig. 13a and b also point to slightly weaker OH–HCR interactions in the latter case. This is consistent with the lower KHyd value found for the [C4C1im][SCN] solutions when compared with that of the [C4C1im][N(CN)2] solutions.
The difference between the two hydrotropes is even more noticeable if one compares the vanillin–anion cluster distributions and the corresponding g(r) functions (Fig. 13c and d). In both situations, the vanillin–anion cluster sizes are always smaller than the corresponding vanillin–cation clusters. This is due to the fact that the anion is also involved in strong interactions with the water solvent and is responsible for the stabilization of the IL strands in the midst of the aqueous solution. Nevertheless, the dicyanamide anion is more able to form larger clusters with the vanillin molecules than its thiocyanate counterpart. Those larger clusters are a consequence of the stronger H-bond-type interactions involving the hydrogen atom of the hydroxyl group of vanillin and the nitrogen atoms of the [N(CN)2] anion (inset of Fig. 13c), relative to the same type of interactions involving the nitrogen and sulphur atoms of the [SCN] anion (inset of Fig. 13d).
In summary, the present MD simulations can explain, from a molecular perspective, how short-chained hydrophilic ionic liquids can act as hydrotropic agents: (i) in the concentration range where hydrotrope effects are noticeable, hydrophilic ILs are not completely dissociated but form ionic aggregates (strands) of a few tens of ions; (ii) those strands are stabilized in the aqueous medium by anion–water interactions; (iii) most of the IL cations are organic in nature and can therefore interact with organic (hydrophobic) solutes. Such interactions are not confined to dispersion forces between the nonpolar moieties of the cation and the solute molecules (which can nevertheless be quite important) but can also involve other specific interactions (e.g. between H-donors and H-acceptors and π–π interactions); (iv) the formation of cation–solute aggregates will promote the dissolution of the hydrophobic solute in the midst of the ionic liquid strands; (v) since these strands are anchored to the aqueous solution via their anion–water interactions, the end result will be the dissolution/dispersion and stabilization of the organic solute molecules in the aqueous solution.
Recovery of solutes from solution
The results of enhanced solubility in aqueous solutions of ILs reported here also suggest that the high performance demonstrated by these aqueous solutions in the extraction of biocompounds from biomass31 may be a major outcome of this enhanced solubility created by the hydrotropic behaviour of the ILs, and arise not only from the biomass disruption as commonly accepted.76,77 This being the case, the nature of the hydrotropic solutions discussed above can thus be used not only for the extraction but also for the recovery of the target compounds from aqueous media. Since the solubility of the antioxidants (and any other solutes) largely depends on the IL (hydrotrope) concentration, and their solubility is far superior to their saturation values in pure water, the results obtained combined with the hydrotropy concept suggest that the recovery of the solutes from the hydrotrope aqueous solution can be attained by a simple dilution with water, combined or not with a decrease of temperature.
Since the vanillin solubility is extremely sensitive to the hydrotrope concentration and temperature, as shown before, some tests on the recovery of vanillin from aqueous solution by further dilution with water were carried out. For this purpose, an aqueous solution with 0.81 mol kgwater−1 of [C4C1im][TOS] was prepared and saturated with vanillin (0.82 mol kg−1 = 125 g kg−1) at 303 K.
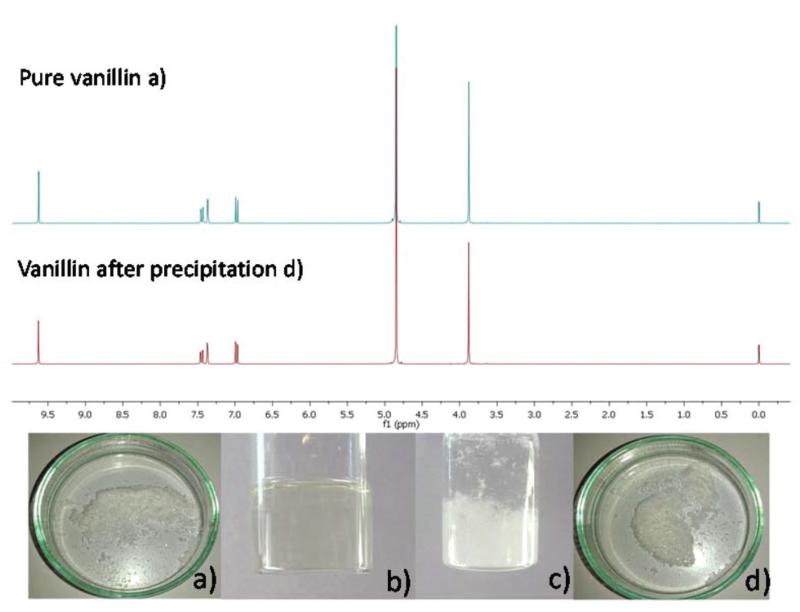
To recover the vanillin, an equal volume of water was added to the vanillin–IL–water solution aiming at decreasing the hydrotrope concentration to half its initial value. The decrease of the hydrotrope concentration in solution from 0.81 to 0.36 mol kgwater−1 led to the precipitation of (59 ± 1) wt% of the initial vanillin in solution (Fig. 14).
Fig. 14.
(a) The appearance of commercial vanillin and the respective 1H NMR spectrum; (b) vanillin dissolved in 0.80 molIL kgwater−1 aqueous solution of [C4C1im][TOS] at 303 K; (c) precipitation of vanillin with the addition of water and decrease of temperature; and (d) the recovered vanillin and the respective 1H NMR spectrum.
The expected value for the vanillin recovery, calculated from the solubility curves previously measured, is 61%, which is in good agreement with the experimental results obtained.
The precipitated vanillin was recovered by filtration, washed with cold water and dried. The macroscopic appearance of the recovered vanillin is the same as the initial compound, while its purity was ascertained and confirmed by 1H NMR (Fig. 14).
These simple assays show how the compounds dissolved by hydrotropic action can be recovered using water as an anti-solvent to induce their precipitation. This behaviour can be used with remarkable advantages in the field of IL-mediated extraction of value-added compounds from biomass. In fact, it is well-known that IL aqueous solutions are excellent solvents for the extraction of alkaloids, triterpenoids, and flavonoids, among others, from natural matrices.31 Although several studies demonstrated the high potential of IL aqueous solutions, the isolation/purification of the target compounds as well as the recovery of the solvents for further use has been seldom studied.31 The approach proposed here – the use of a green solvent like water as an anti-solvent – will certainly allow the design of novel strategies for the recovery of both the value-added compounds and IL solvents.
Conclusions
This comprehensive study regarding the solubility of biomolecules in aqueous solutions of ILs disclosed, for the first time, the ability of ILs to act as hydrotropes. It is clearly established here that ILs are a novel class of catanionic hydrotropes with a superior performance since both the IL cation and anion may contribute to enhance the solubility of poorly soluble compounds in aqueous solution. The overall results using DLS, NMR and MD support the idea that the enhanced solubility of sparingly soluble solutes in water is driven by the formation of solute–IL aggregates.
The results reported here are also essential for the understanding of the mechanisms which rule the high-performance extraction of biomolecules from biomass using IL aqueous solutions. It shows that contrary to what was proposed by us76 and others,77 the high efficiency achieved using IL aqueous solutions in the extraction of value-added compounds from biomass31 is not only related with the disruption of the biomass structure, but also with the enhanced solubility of the target compounds in aqueous IL solutions, i.e., with the hydrotropic role displayed by ILs in aqueous media. Given the selective character of the hydrotropic effect, also revealed in this work, the use of hydrotropes further allows a selective extraction of the target compound. When using hydrotropes in the extraction of biocompounds it is possible to develop a simple and benign biomolecule recovery process, simple by using water as the anti-solvent to induce the precipitation/recovery of the extracted molecules and IL solvents.
Supplementary Material
Acknowledgements
This work was carried out in the scope of the projects CICECO-Aveiro Institute of Materials (ref. FCT UID/CTM/50011/2013) and EXPL/QEQ-PRS/0224/2013 financed by national funds through the FCT/MEC and, when applicable, co-financed by FEDER under the PT2020 Partnership Agreement. A. F. M. Cláudio acknowledges FCT for the PhD grant SFRH/BD/74503/2010. M. G. Freire acknowledges the European Research Council (ERC) for the starting grant ERC-2013-StG-337753.
Footnotes
Electronic supplementary information (ESI) available: Supporting figures and tables. See DOI: 10.1039/c5gc00712g
References
- 1.Roy BK, Moulik SP. Curr. Sci. 2003;85:1148–1155. [Google Scholar]
- 2.Eastoe J, Hatzopoulos MH, Dowding PJ. Soft Matter. 2011;7:5917–5925. [Google Scholar]
- 3.Friberg SE, Lochhead RV, Blute I, Warnheim T. J. Dispersion Sci. Technol. 2004;25:243–251. [Google Scholar]
- 4.Hodgdon TK, Kaler EW. Curr. Opin. Colloid Interface Sci. 2007;12:121–128. [Google Scholar]
- 5.Subbarao CV, Chakravarthy IPK, Bharadwaj AVSLS, Prasad KMMK. Chem. Eng. Technol. 2012;35:225–237. [Google Scholar]
- 6.Korenman YI, Makarova TV. J. Phys. Chem. 1974;48:385–387. [Google Scholar]
- 7.Neuberg C. Biochem. Z. 1916;76:107–176. [Google Scholar]
- 8.Srinivas V, Rodley GA, Ravikumar K, Robinson WT, Turnbull MM, Bala-subramanian D. Langmuir. 1997;13:3235–3239. [Google Scholar]
- 9.Subramanian D, Boughter CT, Klauda JB, Hammouda B, Anisimov MA. Faraday Discuss. 2013;167:217–238. doi: 10.1039/c3fd00070b. [DOI] [PubMed] [Google Scholar]
- 10.Shimizu S, Booth JJ, Abbott S. Phys. Chem. Chem. Phys. 2013;15:20625–20632. doi: 10.1039/c3cp53791a. [DOI] [PubMed] [Google Scholar]
- 11.Ferreira GSS, Perigo DM, Politi MJ, Schreier S. Photochem. Photobiol. 1996;63:755–761. [Google Scholar]
- 12.Matero A, Mattsson AM, Svensson MJ. Surfactants Deterg. 1998;1:485–489. [Google Scholar]
- 13.Bauduin P, Renoncourt A, Kopf A, Touraud D, Kunz W. Langmuir. 2005;21:6769–6775. doi: 10.1021/la050554l. [DOI] [PubMed] [Google Scholar]
- 14.Sanghvi R, Evans D, Yalkowsky SH. Int. J. Pharm. 2007;336:35–41. doi: 10.1016/j.ijpharm.2006.11.025. [DOI] [PubMed] [Google Scholar]
- 15.Suzuki H, Sunada H. Chem. Pharm. Bull. 1998;46:125–130. doi: 10.1248/cpb.46.125. [DOI] [PubMed] [Google Scholar]
- 16.Rasool AA, Hussain AA, Dittert LW. J. Pharm. Sci. 1991;80:387–393. doi: 10.1002/jps.2600800422. [DOI] [PubMed] [Google Scholar]
- 17.Hussain MA, DiLuccio RC, Maurin MB. J. Pharm. Sci. 1993;82:77–79. doi: 10.1002/jps.2600820117. [DOI] [PubMed] [Google Scholar]
- 18.Lee J, Lee SC, Acharya G, Chang CJ, Park K. Pharm. Res. 2003;20:1022–1030. doi: 10.1023/a:1024458206032. [DOI] [PubMed] [Google Scholar]
- 19.Balasubramanian D, Srinivas V, Gaikar VG, Sharma MM. J. Phys. Chem. 1989;93:3865–3870. [Google Scholar]
- 20.Coffman RE, Kildsig DO. Pharm. Res. 1996;13:1460–1463. doi: 10.1023/a:1016011125302. [DOI] [PubMed] [Google Scholar]
- 21.Neumann MG, Schmitt CC, Prieto KR, Goi BE. J. Colloid Interface Sci. 2007;315:810–813. doi: 10.1016/j.jcis.2007.07.020. [DOI] [PubMed] [Google Scholar]
- 22.Charman WN, Lai CSC, Craik DJ, Finnin BC, Reed BL. Aust. J. Chem. 1993;46:377–385. [Google Scholar]
- 23.Booth JJ, Abbott S, Shimizu S. J. Phys. Chem. B. 2012;116:14915–14921. doi: 10.1021/jp309819r. [DOI] [PubMed] [Google Scholar]
- 24.Shimizu S, Matubayasi N. J. Phys. Chem. B. 2014;118:10515–10524. doi: 10.1021/jp505869m. [DOI] [PubMed] [Google Scholar]
- 25.Stanton K, Tibazarwa C, Certa H, Greggs W, Hillebold D, Jovanovich L, Woltering D, Sedlak R. Integr. Environ. Assess. Manage. 2010;6:155–163. doi: 10.1897/IEAM_2009-019.1. [DOI] [PubMed] [Google Scholar]
- 26.Wagle VB, Kothari PS, Gaikar WG. J. Mol. Liq. 2007;133:68–76. [Google Scholar]
- 27.van Rantwijk F, Sheldon RA. Chem. Rev. 2007;107:2757–2785. doi: 10.1021/cr050946x. [DOI] [PubMed] [Google Scholar]
- 28.Cláudio AFM, Ferreira AM, Freire CSR, Silvestre AJD, Freire MG, Coutinho JAP. Sep. Purif. Technol. 2012;97:142–149. [Google Scholar]
- 29.Cláudio AFM, Freire MG, Freire CSR, Silvestre AJD, Coutinho JAP. Sep. Purif. Technol. 2010;75:39–47. [Google Scholar]
- 30.Freire MG, Cláudio AFM, Araújo JMM, Coutinho JAP, Marrucho IM, Canongia Lopes JN, Rebelo LPN. Chem. Soc. Rev. 2012;41:4966–4995. doi: 10.1039/c2cs35151j. [DOI] [PubMed] [Google Scholar]
- 31.Passos H, Freire MG, Coutinho JAP. Green Chem. 2014;16:4786–4815. doi: 10.1039/C4GC00236A. [DOI] [PMC free article] [PubMed] [Google Scholar]
- 32.Bogel-Lukasik R, Nobre Goncalves LM, Bogel-Lukasik E. Green Chem. 2010;12:1947–1953. [Google Scholar]
- 33.Almeida MR, Passos H, Pereira M, Lima AS, Coutinho JAP, Freire MG. Sep. Purif. Technol. 2014;128:1–10. [Google Scholar]
- 34.Cláudio AFM, Marques CFC, Boal-Palheiros I, Freire MG, Coutinho JAP. Green Chem. 2014;16:259–268. [Google Scholar]
- 35.Teixeira J, Silva T, Benfeito S, Gaspar A, Garrido EM, Garrido J, Borges F. Eur. J. Med. Chem. 2013;62:289–296. doi: 10.1016/j.ejmech.2012.12.049. [DOI] [PubMed] [Google Scholar]
- 36.Noubigh A, Cherif M, Provost E, Abderrabba M. J. Chem. Eng. Data. 2008;53:1675–1678. [Google Scholar]
- 37.Noubigh A, Mgaidi A, Abderrabba M, Provost E, Furst W. J. Sci. Food Agric. 2007;87:783–788. [Google Scholar]
- 38.Sousa AF, Pinto PCRO, Silvestre AJD, Neto CP. J. Agric. Food Chem. 2006;54:6888–6893. doi: 10.1021/jf060987+. [DOI] [PubMed] [Google Scholar]
- 39.Hussain K, Thorsen G, Malthe-Sorenssen D. Chem. Eng. Sci. 2001;56:2295–2304. [Google Scholar]
- 40.Pino-Garcia O. Influence of Admixtures on Crystal Nucleation of Vanillin. Royal Institute of Technology; Stockholm: 2004. [Google Scholar]
- 41.Noubigh A, Abderrabba M, Provost E. J. Chem. Thermodyn. 2007;39:297–303. [Google Scholar]
- 42.Dhinakaran M, Morais AB, Gandhi NN. Asian J. Chem. 2013;25:231–236. [Google Scholar]
- 43.Batista MLS, Neves CMSS, Carvalho PJ, Gani R, Coutinho JAP. J. Phys. Chem. B. 2011;115:12879–12888. doi: 10.1021/jp207369g. [DOI] [PubMed] [Google Scholar]
- 44.Canongia Lopes JN, Deschamps J, Pádua AAH. J. Phys. Chem. B. 2004;108:2038–2047. [Google Scholar]
- 45.Canongia Lopes JN, Pádua AAH. J. Phys. Chem. B. 2004;108:16893–16898. [Google Scholar]
- 46.Canongia Lopes JN, Pádua AAH. Theor. Chem. Acc. 2012;131:1129. [Google Scholar]
- 47.Jorgensen WL, Maxwell DS, Tirado-Rives J. J. Am. Chem. Soc. 1996;118:11225–11236. [Google Scholar]
- 48.Praprotnik M, Janežič D, Mavri J. J. Phys. Chem. A. 2004;108:11056–11062. [Google Scholar]
- 49.Smith W, Forester TR. The DL_POLY Package of Molecular Simulation Routines (v.2.2) The Council for The Central Laboratory of Research Councils, Daresbury Laboratory; Warrington: 2006. [Google Scholar]
- 50.Chandler D. “7.3” Introduction to Modern Statistical Mechanics. Oxford University Press; 1987. pp. 195–201. [Google Scholar]
- 51.Shimizu K, Bernardes CES, Triolo A, Canongia Lopes JN. Phys. Chem. Chem. Phys. 2013;15:16256–16262. doi: 10.1039/c3cp52357h. [DOI] [PubMed] [Google Scholar]
- 52.Shimizu K, Bernardes CES, Canongia Lopes JN. J. Phys. Chem. B. 2014;118:567–576. doi: 10.1021/jp409987d. [DOI] [PubMed] [Google Scholar]
- 53.Bernardes CES, Minas da Piedade ME, Canongia Lopes JN. J. Phys. Chem. B. 2011;115:2067–2074. doi: 10.1021/jp1113202. [DOI] [PubMed] [Google Scholar]
- 54.Daneshfar A, Ghaziaskar HS, Homayoun NJ. Chem. Eng. Data. 2008;53:776–778. [Google Scholar]
- 55.Lu LL, Lu XY. J. Chem. Eng. Data. 2007;52:37–39. [Google Scholar]
- 56.Hatzopoulos MH, Eastoe J, Dowdling PJ, Rogers SE, Heenan R, Dyer R. Langmuir. 2011;27:12346–12353. doi: 10.1021/la2025846. [DOI] [PubMed] [Google Scholar]
- 57.Russo JW, Hoffmann MM. J. Chem. Eng. Data. 2011;56:3703–3710. [Google Scholar]
- 58.Subramanian D, Ivanov DA, Yudin IK, Anisimov MA, Sengers JV. J. Chem. Eng. Data. 2011;56:1238–1248. [Google Scholar]
- 59.Subramanian D, Anisimov MA. J. Phys. Chem. B. 2011;115:9179–9183. doi: 10.1021/jp2041795. [DOI] [PubMed] [Google Scholar]
- 60.Subramanian D, Anisimov MA. Fluid Phase Equilib. 2014;362:170–176. [Google Scholar]
- 61.Strey R, Viisanen Y, Aratono M, Kratohvil JP, Yin Q, Friberg SE. J. Phys. Chem. B. 1999;103:9112–9116. [Google Scholar]
- 62.Setschenow AZ. Phys. Chem. 1889;4:117–125. [Google Scholar]
- 63.Hofmeister F. Arch. Exp. Pathol. Pharmakol. 1888;XXV:1. [Google Scholar]
- 64.Mansur CRE, Spinelli LS, Lucas EF, Gonzalez G. Colloids Surf., A. 1999;149:291–300. [Google Scholar]
- 65.Hatzopoulos MH, Eastoe J, Dowding PJ, Grillo I, Demé B, Rogers SE, Heenan R, Dyer R. Langmuir. 2012;28:9332–9340. doi: 10.1021/la301222m. [DOI] [PubMed] [Google Scholar]
- 66.Holbrey JD, Reichert WM, Nieuwenhuyzen M, Sheppard O, Hardacre C, Rogers RD. Chem. Commun. 2003:476–477. doi: 10.1039/b212726a. [DOI] [PubMed] [Google Scholar]
- 67.Pereira JFB, Flores LA, Wang H, Rogers RD. Chem. – Eur. J. 2014;20:15482–15492. doi: 10.1002/chem.201404253. [DOI] [PubMed] [Google Scholar]
- 68.Lachwa J, Bento I, Duarte MT, Canongia Lopes JN, Rebelo LPN. Chem. Commun. 2006:2445–2447. doi: 10.1039/b602675c. [DOI] [PubMed] [Google Scholar]
- 69.Blesic M, Canongia Lopes JN, Pádua AAH, Shimizu K, Gomes MFC, Rebelo LPN. J. Phys. Chem. B. 2009;113:7631–7636. doi: 10.1021/jp902178g. [DOI] [PubMed] [Google Scholar]
- 70.Kayali I, Qamhieh K, Olsson U. J. Dispersion Sci. Technol. 2010;32:41–46. [Google Scholar]
- 71.Kayali I, Qamhieh K, Habjoqa F, AlBawab A, Olsson U, Bemert L, Strey R. J. Dispersion Sci. Technol. 2012;33:369–373. [Google Scholar]
- 72.Khan ZA, Kamil M, Sulaiman O, Hashim R, Mohamad Ibrahim MN, Khanam AJ, Kabir-ud-Din J. Dispersion Sci. Technol. 2011;32:1452–1458. [Google Scholar]
- 73.Srinivas V, Balasubramanian D. Langmuir. 1998;14:6658–6661. [Google Scholar]
- 74.Blesic M, Marques MH, Plechkova NV, Seddon KR, Rebelo LPN, Lopes A. Green Chem. 2007;9:481–490. [Google Scholar]
- 75.ChemSpider, The free chemical database. http://www.chemspider.com.
- 76.Cláudio AFM, Ferreira AM, Freire MG, Coutinho JAP. Green Chem. 2013;15:2002–2010. [Google Scholar]
- 77.Ressmann K, Strassl K, Gaertner P, Zhao B, Greiner L, Bica K. Green Chem. 2012;14:940–944. [Google Scholar]
Associated Data
This section collects any data citations, data availability statements, or supplementary materials included in this article.


