Abstract
A series of miscible-displacement experiments was conducted to examine the impact of experiment conditions (detection limit, input-pulse size, input concentration, pore-water velocity, contact time) on the performance of a mathematical solute–transport model incorporating nonlinear, rate-limited sorption/desorption described by a continuous-distribution reaction function. Effluent solute concentrations were monitored over a range of approximately seven orders of magnitude, allowing characterization of asymptotic tailing phenomenon. The model successfully simulated the extensive elution tailing observed for the measured data. Values for the mean desorption rate coefficient (ln k2) and the variance of ln k2 were obtained through calibration of the model to measured data. Similar parameter values were obtained for experiments with different input-pulse size, input concentration, pore-water velocity, contact time. This suggests that the model provided a robust representation of sorption-desorption for this system tested. The impact of analytical detection limit was examined by calibrating the model to subsets of the breakthrough curves wherein the extent of the elution tail was artificially reduced to mimic a poorer detection limit. The parameters varied as a function of the extent of elution tail used for the calibrations, indicating the importance of measuring as full an extent of the tail as possible.
Keywords: rate-limited sorption, modeling, nonideal transport, tailing
1. Introduction
Sorption is a primary process mediating the transport and fate of hydrophobic organic compounds in subsurface environments. It is well established that sorption-desorption interactions between organic contaminants and geosorbents are typically rate-limited, and that this can have significant impacts for example on transport, bioavailability, and remediation (e.g., Brusseau and Rao, 1989; Luthy et al., 1997). One significant manifestation of rate-limited desorption under advective transport conditions is that of asymptotic elution tailing, which has been routinely observed in the studies that have employed analytical methods with sufficiently low detection levels (e.g. Piatt and Brusseau, 1998; Johnson et al., 2003, 2009; Kleineidam et al., 2004; Deng et al., 2008; Kempf and Brusseau, 2009; Russo et al., 2010; Brusseau et al., 2012a).
Accurate simulation of contaminant transport under such conditions requires explicit representation of the rate-limited sorption-desorption process. This is most often accomplished through the use of one-domain or two-domain approaches wherein one or two sets of first-order rate coefficients are used. Alternatively, rate-limited sorption-desorption can been represented with a continuous distribution of domains and associated rate coefficients (e.g., Connaughton et al., 1993; Pedit and Miller, 1994; Chen and Wagenet, 1995; Culver et al., 1997; Haggerty and Gorelick, 1998; Ahn et al., 1999; Li and Brusseau, 2000; Saiers and Tao, 2000; Johnson et al., 2003, Zhang and Brusseau, 2004; Deng et al., 2008; Johnson et al., 2009; Russo et al., 2010). With this model, the impact of pore/grain-scale physical and geochemical heterogeneity on sorption/desorption is accounted for with a continuous distribution of retention domains and associated rate coefficients.
Mathematical models are often used to solve the inverse problem to determine values for model parameters (i.e., calibration to measured data). A critical issue in this regard is the robustness of the curve-fitted values in terms of their system representativeness; in other words, do the parameter values reflect only the specific conditions for which they were obtained, or are they representative of a range of conditions. This is dependent upon the robustness of the mathematical model employed. One way to test robustness is to examine the sensitivity of fitted parameter values to perturbations in system conditions. For laboratory miscible-displacement experiments, this could involve, for example, changing the pore-water velocity or magnitude of the input pulse (e.g., De Lasa et al., 1986; Brusseau et al., 1989; Buffham and Mason, 1993; Young and Ball, 2000; Schnaar and Brusseau, 2013). The potential experiment-condition dependency of the continuous-distribution rate model has received minimal investigation to date.
The objective of this research was to examine the impact of experiment conditions (input-pulse size, input concentration, pore-water velocity, contact time) on the performance of a mathematical solute-transport model incorporating nonlinear, rate-limited sorption/desorption described by a continuous-distribution rate function. Effluent solute concentrations were monitored over a range of approximately seven orders of magnitude, allowing characterization of asymptotic elution tailing phenomenon. The impact of the extent of the measured elution tail (i.e., the analytical detection limit) on model calibration was also examined.
2. Materials and Methods
2.1.1 Methods
Trichloroethene (TCE) was used as the model organic compound. One set of experiments was also conducted with atrazine and another with tetrachloroethene (PCE). Pentafluourobenzoic acid (PFBA) was used as a conservative tracer to determine the hydrodynamic properties of the packed columns. An electrolyte solution containing 0.01 N CaCl2 was used for all experiments. Eustis sandy soil (siliceous, thermic Psammentic Paleudults), collected from the University of Florida campus, was used for the experiments. This soil is composed of 96% sand, 1% silt, 3% clay, and 0.38% organic carbon.
The miscible-displacement experiments were conducted using stainless-steel columns (7-cm long by 2.1-cm diameter) to avoid artifacts associated with contaminant interactions with the apparatus. Porous stainless steel plates were placed on both ends of the column to retain the media and to promote uniform flow. The columns were wet-packed in small increments to establish a uniform bulk density. The mean bulk density and porosity for the packed columns were 1.76 g/cm3 and 0.33, respectively. The packing procedure resulted in consistent values of bulk density and porosity for all of the columns, with coefficients of variation (COV) of less than 2% and 4%, respectively. After packing, the columns were saturated by injecting de-aired electrolyte solution at a low flow rate into the bottom of the vertically positioned column. Complete saturation was assumed once a constant mass was attained for the column.
Once the column was saturated, electrolyte solution containing TCE at selected concentrations was injected into the column via a stainless steel syringe pump (ISCO 500d) to minimize loss due to volatilization. After injection of the TCE input pulse, the column was flushed with the electrolyte solution until the TCE concentration reached the quantifiable detection limit. Effluent samples were collected manually in 2-ml or 5-ml glass syringes (Popper & Sons, Inc, New Hyde Park, N.Y.), and analyzed immediately.
Several sets of experiments were conducted, wherein one selected experiment variable among input pulse, injection concentration, pore-water velocity, and contact time was varied per set (see Table 1). The values used were selected to represent reasonable ranges typical for implementation of laboratory miscible-displacement experiments. The volume of TCE-saturated solution injected was equivalent to approximately 20 pore volumes for most experiments. Additional experiments were conducted with larger and smaller input pulses. Most experiments were conducted at a flowrate equivalent to a mean pore-water velocity of approximately 20 cm/hr, which is within the range of velocities associated with induced-gradient conditions (e.g., pump-and-treat operations) at typical field sites. Additional experiments were conducted with larger and smaller velocities. The baseline conditions used for TCE (row 1 of Table 1) were used for the atrazine experiment.
Table 1.
Experiment Conditions and Elution-curve Parameter Values.
| Number of Experiments | Input Pulse (pore volume) | Input Conc. (mg/L) | Pore-water Velocity (cm/h) | Mean ln k2 | Variance ln k2 |
|---|---|---|---|---|---|
| 4a | 21 | 1200 | 27 | 1.2 (0.8–1.6) | 12 (11–13) |
| 1b | 2 | 1200 | 27 | 1.0 | 15 |
| 1 | 4 | 1200 | 27 | 1.8 | 11 |
| 2 | 8 | 1200 | 27 | 1.2 | 13 |
| 2 | 100 | 1200 | 27 | 1.2 | 13 |
| 1 | 1000 | 1200 | 27 | 1.1 | 13 |
| 2 | 21 | 8 | 27 | 0.8 | 11 |
| 1 | 21 | 68 | 27 | 1.1 | 13 |
| 1 | 21 | 411 | 27 | 1.2 | 12 |
| 1 | 21 | 1200 | 2 | 1.2 | 12 |
| 1 | 21 | 1200 | 72 | 1.1 | 13 |
| 2 | Aged | 1200 | 27 | 1.0 | 14 |
Values in parentheses represent 95% confidence intervals determined from the replicate data
Parameter uncertainty for a single experiment is approximately 10% based on analysis of sensitivity simulations (data not shown)
In addition to varying the contact time by using different sizes of input pulse, two experiments were conducted with soil that was pre-equilibrated with TCE for 30 days and 420 days, respectively, to further test the impact of contact time. For these experiments, soil was placed in a basket constructed of stainless-steel fine mesh that was suspended in a 3 L glass container filled with electrolyte solution, with TCE liquid emplaced in the bottom. The soil was suspended such that it did not directly contact the TCE liquid. Aqueous subsamples were collected from the bottle periodically to ensure the solution remained saturated with TCE. After the designated contact time, a subsample of the soil was collected (after mixing of the sample) and packed into the column. Several pore volumes of TCE-saturated solution were injected to ensure the column was water-saturated prior to the initiation of flushing with electrolyte solution.
2.2. Chemical Analysis
PFBA samples were analyzed using ultraviolet-visible (UV-Vis) spectrophotometry (Shimadzu SPD-10A) at a wavelength of 262 nm (quantifiable detection limit approximately 1 mg/L). Trichloroethene and PCE were analyzed by headspace gas chromatography (Tekmar-Dohrmann 7050 coupled with a Shimadzu GC-17A) using either a flame ionization (FID) or electron capture (ECD) detector depending on sample concentration. Chromatographic analysis was done using a glass capillary column (SPB-624, 30-m length, 5-μm film thickness) with oven temperature programming. Specifically, analysis began with oven temperature set for two minutes at 40 °C, ramped to 150 °C at a rate of 10 °C per minute, and held for two minutes. The injection port temperature was set at 180 °C, with the detectors at 180 °C and 210 °C for the FID and ECD, respectively. Aqueous-phase standards were analyzed every 48 h with check standards and blanks analyzed for quality assurance every 10 to 15 samples. The quantifiable detection limit for TCE and PCE using headspace GC/ECD was 0.1 μg L−1. Selected samples were also analyzed using UV-Vis spectrophotometry (QDL = 1 mg L−1) to provide additional confirmation of analytical results. Atrazine was analyzed by UV-Vis spectrophotometry (QDL = 0.05 mg L−1) for higher concentrations, and by enzyme-linked immunosorbent assay (QDL = 0.05 μg L−1) for lower concentrations.
2.3. Data Analysis
The measured breakthrough curve data were simulated with a one-dimensional advective-dispersive transport equation wherein nonlinear, rate-limited sorption/desorption was described by a continuous-distribution reaction function. The governing equation for describing one-dimensional transport of contaminant in a macroscopically homogenous porous medium is given by:
where C is the concentration in the aqueous phase, Seq is the sorbed-phase concentration for the sorbent domain for which sorption is instantaneous, Si is the sorbed-phase concentration for the sorbent domain for which sorption is rate limited, ρb is bulk density, θ is the fractional volumetric water content, D is the dispersion coefficient, v is pore-water velocity, k2 is the first-order desorption rate coefficient, and m is the total number of retention domains.
Sorption dynamics for the equilibrium domain is described by: , where Kf and n are the Freundlich sorption coefficients and F represents the fraction of the sorbent for which sorption is instantaneous. Rate-limited sorption/desorption is described using first-order kinetics: . A log-normal function is used to represent the desorption-rate distribution:
where f(k2) is the probability density function (or fraction of sorption domains) for the first-order desorption rate coefficient k2, μ is the mean of ln k2, and σk2 is the variance of ln k2. Model flexibility was enhanced by adding capability to address sorption-desorption hysteresis. This was accomplished by implementing two sets of sorption-kinetics parameters (μ and σk2).
Boundary conditions, numerical methods, and optimization procedures used for the modeling have been presented elsewhere (Johnson et al., 2003; Zhang and Brusseau, 2004). Two (μ and σk2) variables were optimized through calibration of the model to the measured data. Initial simulations were conducted to evaluate the impact of the F parameter, with simulations conducted for F set to 0 and F optimized. The results showed that the best simulations were produced with F > 0, with a mean of ~0.75 for all simulations. Simulations were conducted for both linear (n = 1) and nonlinear (n = 0.75, based on batch-experiment results) sorption. We will focus on the results with nonlinear sorption. For the two experiments wherein the soil was pre-contaminated for 30 and 420 days, respectively, the input pulse was set equal to 1000 and 4000 pore volumes, respectively, based on approximate residence time equivalences to represent the aging effect. The input-pulse magnitude has no significant impact on simulation results and parameter optimization when they are of sufficient magnitude to produce quasi sorption-equilibrium conditions prior to the start of elution.
3. Results and Discussion
The breakthrough curves for the non-reactive tracer (PFBA) exhibited minimal spreading and tailing, and essentially complete mass recovery (data not shown). These results indicate relatively ideal hydrodynamic transport conditions. Mass recoveries for the TCE experiments ranged from 98–102%, which is within the range of analytical uncertainty. This indicates that the transport of TCE was not measurably influenced by transformation or irreversible-sorption effects.
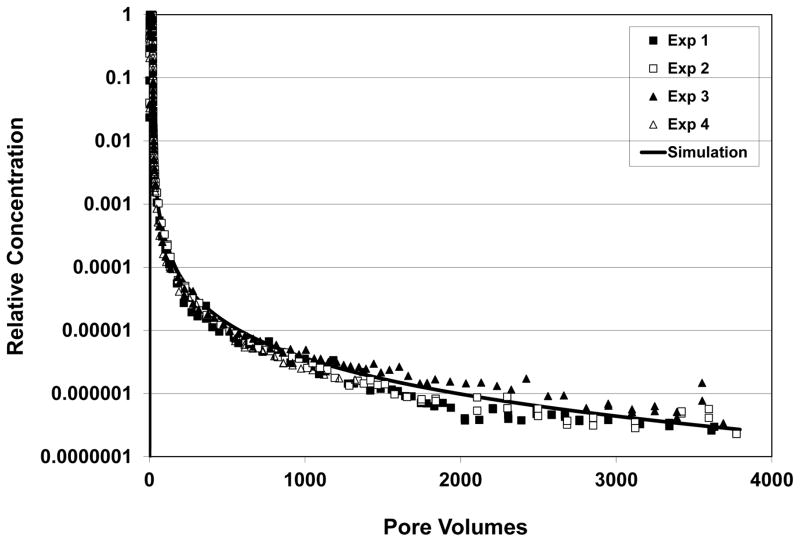
Trichloroethene exhibited extensive elution tailing for all experiments, as illustrated by the data presented in Figure 1. The columns required several thousand pore volumes of water flushing to reduce effluent TCE concentrations to the quantifiable detection limit, despite relatively low retardation factors of ~2.5. The extensive tailing observed is a manifestation of nonideal sorption behavior that has been attributed to sorbate interactions with hard-carbon components of the soil (Brusseau et al., 2012a,b). The results of replicate experiments showed good reproduction, as exemplified by the data presented in Figure 1.
Figure 1.
Results of replicate miscible-displacement experiments for baseline conditions (first row in Table 1)- 20 pore-volume input pulse, pore-water velocity = 27 cm/h, input concentration = 1200 mg/L. Simulated curve produced with a one-dimensional transport model for which sorption-desorption is represented by a continuous-distribution function. Figure from Brusseau et al. (2012a).
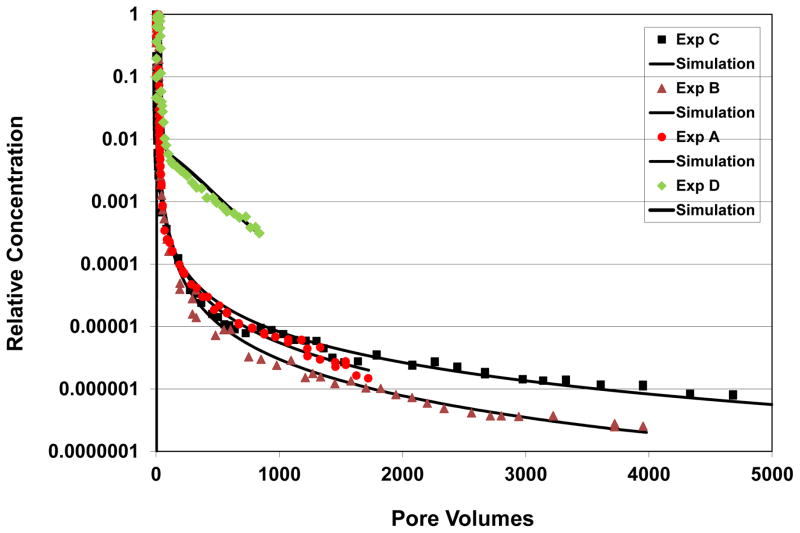
The transport model incorporating a continuous-distribution function for sorption/desorption produced good simulations of the measured data, as illustrated in Figures 1–4. The model provides a good fit to the full elution curve, including the rapid decrease during the initial stage of flushing as well as the asymptotic elution tail. The match to the measured data was improved by incorporating sorption-desorption hysteresis.
Figure 4.
Comparison of simulated and measured TCE and PCE transport; representative examples for non-baseline conditions (referenced to Table 1). Exp A has an input concentration of 68 mg/L; exp B has a pore-water velocity of 73 cm/h; exp C used soil that was aged with TCE for 30 days; exp D is for PCE rather than TCE. Note that the truncated elution curve for PCE is due to the low (1 mg/L) input concentration used for this experiment. Simulated curves are produced with a one-dimensional transport model for which sorption-desorption is represented by a continuous-distribution function.
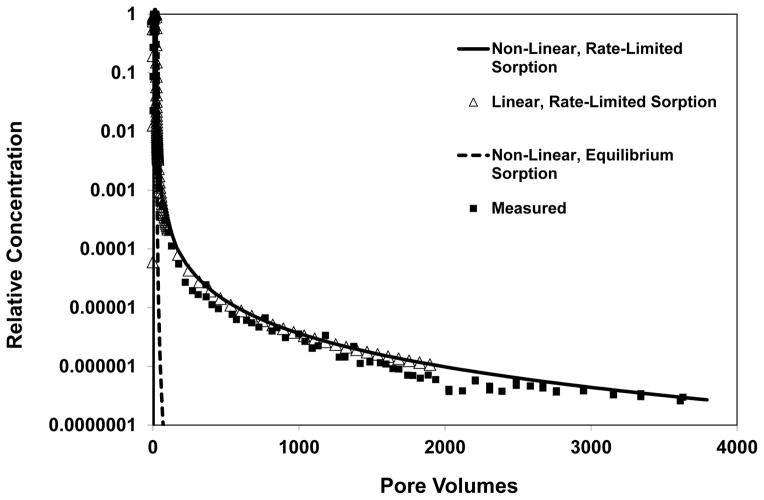
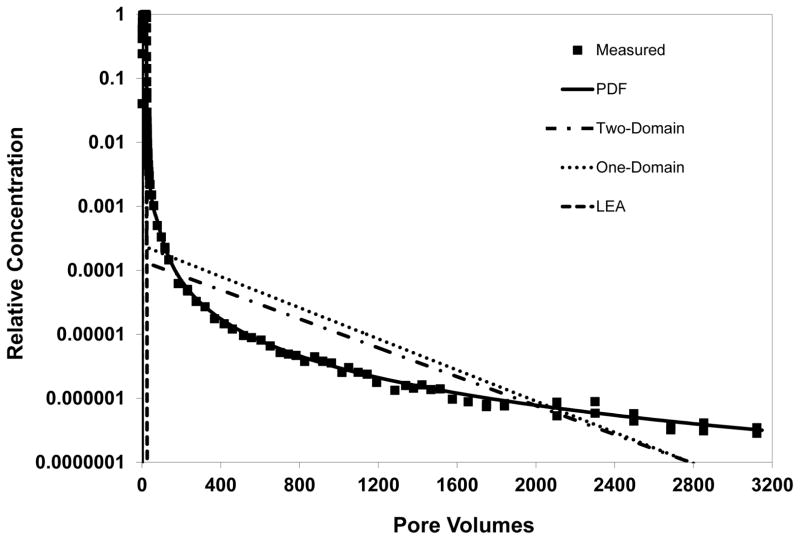
A comparison of model simulations including and excluding nonlinear sorption indicates that nonlinear sorption has a minor impact on the observed elution tailing (see Figure 2). Thus, the extensive tailing is attributed primarily to the impact of rate-limited desorption. The nonideal elution behavior observed for these experiments could not be accurately simulated using transport models employing the widely used one- or two-domain approaches for representing rate-limited sorption/desorption (see Figure 3).
Figure 2.
Comparison of simulated and measured TCE transport. Simulations produced with a model wherein sorption-desorption kinetics are represented with a continuous-distribution function for three cases: (1) linear, rate-limited sorption-desorption, (2) nonlinear, instantaneous sorption-desorption, and (3) nonlinear, rate-limited sorption-desorption. The data symbols representing the “linear, rate-limited sorption” simulation are truncated to improve overall data visualization.
Figure 3.
Comparison of simulated and measured TCE transport. Simulations produced with three different transport models, wherein rate-limited sorption-desorption is represented with the one-domain, two-domain, or continuous-distribution (PDF) function. An ideal control case with instantaneous sorption-desorption (LEA) is also presented.
The values for the mean and variance of ln k2 obtained from the simulations are reported in Table 1 for the elution curve. The results of sensitivity analyses (data not shown) indicates that the fitted parameters are robust, wherein it was observed that relatively small (~10%) changes in the parameter values resulted in significant differences in simulated behavior. The mean values of the optimized parameters for the baseline experiments (input pulse = 21 pore volumes, input concentration = 1200 mg/L, velocity = 27 cm/hr) were 1.2 (0.8–1.6) and 12 (11–13) for mean ln k2 and variance of ln k2, respectively (with values in parentheses representing 95% confidence intervals). Inspection of Table 1 reveals that the parameter values obtained for experiments with different input pulses, different input concentrations, different pore-water velocities, and different contact times are similar to the values obtained for the baseline experiments. This suggests that the model provides a robust representation of sorption-desorption for this system.
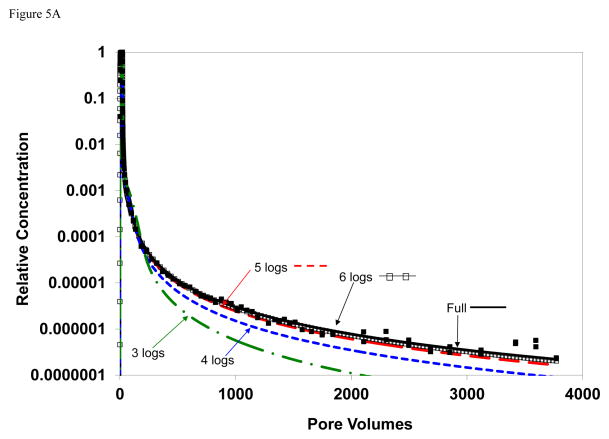
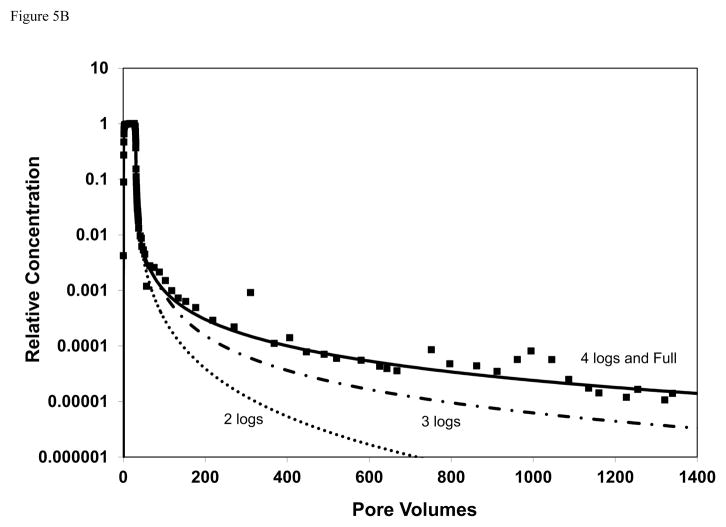
The impact of analytical detection limit was examined by calibrating the model to subsets of the breakthrough curves wherein the extent of the elution tail was artificially reduced to mimic a poorer detection limit. Examples of the results of these analyses are presented in Figure 5. For TCE, it is observed that the simulated curves for the cases wherein the elution tail was truncated at relative concentrations of 0.001 (3 logs) and 0.0001 (4 logs) deviate significantly from the simulation obtained for calibration to the complete elution tail. Conversely, the simulated curves for the cases wherein the elution tail was truncated at 5 and 6 logs are similar to the simulation obtained for calibration to the complete elution tail. Similar results are observed for the atrazine data.
Figure 5.
Comparison of simulated and measured transport; simulations produced for cases wherein the extent of the elution tail used for model calibration was reduced. For example, the simulated curve for “3 logs” represents a case for which the measured elution curve was truncated at a relative concentration of 0.001 prior to calibration. The solid square symbols are measured data and the solid black curve represents the simulation for calibration to the entire elution curve. Simulated curves are produced with a one-dimensional transport model for which sorption-desorption is represented by a continuous-distribution function. A) TCE baseline conditions (row 1 of Table 1); B) Atrazine.
The values of the optimized parameters varied as a function of the extent of elution tail used for the calibrations (see Table 2). For TCE for example, the values for mean ln k2 and variance of ln k2 are 1.1 and 12.6, respectively, for calibration to the full elution curve presented in Figure 5a. The values for the calibration using 6 logs of the elution tail are similar (1.3 and 12.7). Conversely, the values are significantly different (e.g., greater than 10% difference, the approximate level of sensitivity) for the calibration using only 5 logs (1.7, 12.1) or less of the elution tail. Similarly for atrazine, the values for mean ln k2 (0.1) and variance of ln k2 (13) obtained using 4 logs of the elution tail are identical to the values obtained from calibration to the full elution curve presented in Figure 5b. However, the values are significantly different for the calibrations using only 3 logs (0.7, 15) or 2 logs (0.9, 5) of the elution tail. These results indicate the importance of measuring as full an extent of the tail as possible when conducting miscible-displacement experiments.
4. Summary
A series of miscible-displacement experiments was conducted to examine the impact of experiment conditions (detection limit, input-pulse size, input concentration, pore-water velocity, contact time) on the performance of a mathematical solute-transport model incorporating nonlinear, rate-limited sorption/desorption described by a continuous-distribution reaction function. Effluent solute concentrations were monitored over a range of approximately seven orders of magnitude, allowing characterization of asymptotic tailing phenomenon. The model successfully simulated the extensive elution tailing observed for the measured data.
Values for the mean desorption rate coefficient (ln k2) and the variance of ln k2 were obtained through calibration of the model to measured data. Similar parameter values were obtained for experiments with different input-pulse size, input concentration, pore-water velocity, and contact times. This suggests that the model provided a robust representation of sorption-desorption for this system tested. The similarity of the parameter values obtained for the aged treatments (for which the soil was pre-contaminated with TCE) to those obtained for the standard treatments suggests that model robustness may extend beyond standard laboratory conditions. The testing of experiment conditions was done only for TCE. However, the continuous-distribution based model was shown to produce good fits for breakthrough curves obtained from single sets of experiments conducted with two additional compounds (PCE and atrazine). In addition, Russo et al. (2010) reported that the model produced good simulations for TCE transport in six soils and sediments. These results suggest that the model has some degree of robustness beyond the specific system used herein.
The impact of analytical detection limit was examined by calibrating the model to subsets of the breakthrough curves wherein the extent of the elution tail was artificially reduced to mimic a poorer detection limit. The parameters varied as a function of the extent of elution tail used for the calibrations, indicating the importance of measuring as full an extent of the tail as possible. Notably, the use of elution curves truncated at relative concentrations of 0.001, which is roughly coincident with typical detection limits for widely used UV-Vis spectrophotometry, produced significantly different results. The use of parameter values obtained from fitting the model to the truncated data set would for example under-predict the impact of rate-limited desorption on contaminant transport and mass removal, thus leading to under-prediction of the time required for remediation.
Acknowledgments
This research was supported by the NIEHS Superfund Research Program (Grant # P42 ES 4940). We thank Aaron Kempf for his assistance with conducting the atrazine and PCE experiments. We thank the reviewers for their constructive comments.
References
- Ahn I, Lion LW, Shuler MW. Validation of a hybrid “two-site gamma” model for naphthalene desorption kinetics. Environ Sci Technol. 1999;33:3241–3248. [Google Scholar]
- Brusseau ML, Rao PSC. Sorption nonideality during organic contaminant transport in porous media. Crit Rev Environ Control. 1989;19:33–99. [Google Scholar]
- Brusseau ML, Rao PSC, Jessup RE, Davidson JM. Flow Interruption: A Method for Investigating Sorption Nonequilibrium. J Contam Hydrol. 1989;4:223–240. [Google Scholar]
- Brusseau ML, Russo AE, Schnaar G. Nonideal transport of contaminants in heterogeneous porous media: 9- Impact of contact time on desorption and elution tailing. Chemosphere. 2012a;89:287–292. doi: 10.1016/j.chemosphere.2012.04.038. [DOI] [PMC free article] [PubMed] [Google Scholar]
- Brusseau ML, Schnaar G, Johnson GR, Russo AE. Nonideal transport of contaminants in heterogeneous porous media: 10- Impact of co-solutes on sorption by porous media with low organic-carbon contents. Chemosphere. 2012b;89:1302–1306. doi: 10.1016/j.chemosphere.2012.05.027. [DOI] [PMC free article] [PubMed] [Google Scholar]
- Buffham BA, Mason G. Holdup and Dispersion: Tracer Residence Times, Moments and Inventory Measurements. Chem Eng Sci. 1993;48:3879–3887. [Google Scholar]
- Chen W, Wagenet RJ. Solute transport in porous media with sorption-site heterogeneity. Environ Sci Technol. 1995;29:2725–2734. doi: 10.1021/es00011a005. [DOI] [PubMed] [Google Scholar]
- Connaughton DF, Stedinger JR, Lion LW, Shuler ML. Description of time-varying desorption kinetics: release of naphthalene from contaminated soils. Environ Sci Technol. 1993;27:2397–2403. [Google Scholar]
- Culver TB, Hallisey SP, Sahoo D, Deitsch JJ, Smith JA. Modeling the desorption of organic contaminants from long-term contaminated soil using distributed mass transfer rates. Environ Sci Technol. 1997;31:1581–1588. [Google Scholar]
- De Lasa H, Hazlett J, Fuller OM. Evaluation of the Moment Method Technique for the Definition of Adsorption Parameters in a Packed Bed. Chem Eng Sci. 1986;41:1233–1242. [Google Scholar]
- Deng J, Jiang X, Zhang X, Hua W, Crawford JW. Continuous time random walk model better describes the tailing of atrazine transport in soil. Chemosphere. 2008;70:2150–2157. doi: 10.1016/j.chemosphere.2008.01.001. [DOI] [PubMed] [Google Scholar]
- Haggerty R, Gorelick SM. Modeling mass transfer processes in soil columns with pre-scale heterogeneity. Soil Sci Soc Am J. 1998;62:62–74. [Google Scholar]
- Johnson GR, Zhang Z, Brusseau ML. Characterizing and quantifying the impact of immiscible-liquid dissolution and nonlinear, rate-limited sorption/desorption on low-concentration elution tailing. Water Resour Res. 2003;39:6-1–6-8. [Google Scholar]
- Johnson GR, Norris DK, Brusseau ML. Mass removal and low-concentration tailing of tricholoroethene in freshly-amended, synthetically-aged, and field-contaminated aquifer material. Chemosphere. 2009;75:542–548. doi: 10.1016/j.chemosphere.2008.12.004. [DOI] [PMC free article] [PubMed] [Google Scholar]
- Kempf A, Brusseau ML. Impact of non-deal sorption on low-concentration tailing behavior for atrazine transport in two natural porous media. Chemosphere. 2009;77:877–882. doi: 10.1016/j.chemosphere.2009.07.059. [DOI] [PMC free article] [PubMed] [Google Scholar]
- Kleineidam S, Rugner H, Grathwohl P. Desorption kinetics of phenanthrene in aquifer material lacks hysteresis. Environ Sci Technol. 2004;38:4169–4175. doi: 10.1021/es034846p. [DOI] [PubMed] [Google Scholar]
- Li Z, Brusseau ML. Nonideal transport of reactive solutes in heterogeneous porous media. 6 Microscopic and macroscopic approaches for incorporating heterogeneous rate-limited mass transfer. Water Resour Res. 2000;36:2853–2867. [Google Scholar]
- Luthy RG, Aiken GR, Brusseau ML, Cunningham SD, Gschwend PM, Pignatello JJ, Reinhard M, Traina SJ, Weber WJ, Jr, Westall JC. Sequestration of hydrophobic organic contaminants by geosorbents. Environ Sci Technol. 1997;31:3341–3347. [Google Scholar]
- Pedit JA, Miller CT. Heterogeneous sorption processes in subsurface systems. 1.Model formulations and applications. Environ Sci Technol. 1994;28:2094–2104. doi: 10.1021/es00061a018. [DOI] [PubMed] [Google Scholar]
- Piatt JJ, Brusseau ML. Rate-limited sorption of hydrophobic organic compounds by soils with well-characterized organic matter. Environ Sci Technol. 1998;32:1604–1608. [Google Scholar]
- Russo A, Johnson GR, Schnaar G, Brusseau ML. Nonideal transport of contaminants in heterogeneous porous media: 8. Characterizing and modeling asymptotic contaminant-elution tailing for several soils and aquifer sediments. Chemosphere. 2010;81:366–371. doi: 10.1016/j.chemosphere.2010.07.018. [DOI] [PMC free article] [PubMed] [Google Scholar]
- Saiers JE, Tao G. Evaluation of continuous distribution models for rate-limited solute adsorption to geologic media. Water Resour Res. 2000;36:1627–1639. [Google Scholar]
- Schnaar G, Brusseau ML. Measuring equilibrium sorption coefficients with the miscible-displacement method. J Environ Sci Health, Part A. 2013;48:355–359. doi: 10.1080/10934529.2013.727733. [DOI] [PMC free article] [PubMed] [Google Scholar]
- Young DF, Ball WP. Column experimental design requirements for estimating model parameters from temporal moments under nonequilibrium conditions. Adv Water Resour. 2000;23:449–460. [Google Scholar]
- Zhang Z, Brusseau ML. Nonideal transport of reactive porous media: 7. Distributed-domain model incorporating immiscible-liquid dissolution and rate-limited sorption/desorption. J Contam Hydrol. 2004;74:83–103. doi: 10.1016/j.jconhyd.2004.02.006. [DOI] [PubMed] [Google Scholar]


