

SUMMARY
TP53 is the most frequently mutated gene among all human cancers. Prevalent p53 missense mutations abrogate its tumor suppressive function and lead to “gain-of-function” (GOF) that promotes cancer. Here we show that p53 GOF mutants bind to and upregulate chromatin regulatory genes, including the methyltransferases KMT2A (MLL1) and KMT2D (MLL2), and acetyltransferase KAT6A (MOZ or MYST3), resulting in genome-wide increases of histone methylation and acetylation. Analysis of The Cancer Genome Atlas shows specific upregulation of MLL1, MLL2, and MOZ in p53 GOF patient-derived tumors, but not in p53 wildtype or p53 null tumors. Cancer cell proliferation is dramatically lowered by genetic knockdown of MLL1, or by pharmacological inhibition of the MLL1 methyltransferase complex. Our study reveals a novel chromatin mechanism underlying the progression of tumors with GOF p53, and suggests new possibilities for designing combinatorial chromatin-based therapies for treating individual cancers driven by prevalent GOF p53 mutations.
Most mutant forms of p53 are caused by single amino acid substitutions mapping to the DNA binding domain1. These mutations result in expression of full-length p53 protein, but loss of wildtype (WT) tumor suppressive function2-4. The high prevalence of missense substitutions, particularly certain “hotspot” mutations, suggests a selective advantage during cancer progression. Indeed, these mutants gain neomorphic oncogenic functions, including altered cancer spectrum2,3, deregulated metabolic pathways4,5, increased metastasis6,7 and enhanced chemotherapy resistance8. Evidence from recent studies points to one potential mechanism of GOF p53, functioning through association with other transcription factors, and driving gene transcription in oncogenic pathways, such as the mevalonate pathway4 and etoposide resistance pathway8. A transcription mechanism is further supported by the importance of retaining an intact transactivation domain for oncogenic GOF p53 function4,9. Nonetheless, how GOF p53 contributes to massive changes of the cancer genome and transcriptome remains to be elucidated9,10. Altered chromatin pathways have been implicated in various aspects of cancer11,12, given their regulation of genome-wide transcription programs13,14. However, to date there has not been evidence of direct crosstalk between GOF p53 mutants and chromatin regulation.
Genome-wide binding of GOF p53 mutants
We carried out chromatin immunoprecipitation followed by sequencing (ChIP-seq) to determine genome-wide binding locations of p53 in a panel of breast cancer cell lines – MCF7 (p53 WT), MDA-MB-175VII (p53 WT), HCC70 (p53 R248Q), BT-549 (p53 R249S) and MDA-MB-468 (p53 R273H). We found that the binding of p53 to gene-proximal regions (less than 10 kb) of transcription start sites (TSS) in the two WT p53 cell lines strongly resembled each other, whereas these WT p53 peaks were highly dissimilar from the peaks in any of the GOF p53 mutants. Strikingly, p53 binding patterns in the three GOF p53 cell lines were similar among themselves (Fig. 1a; Extended Data Fig. 1a). In addition, we aligned published p53 R248W ChIP-seq data from Li-Fraumeni Syndrome (LFS) MDAH087 cells8, and again, TSS-proximal peaks of p53 R248W resembled those of p53 R273H and p53 R248Q (Extended Data Fig. 1b, c), but were distinct from the WT p53 peaks (Extended Data Fig. 1d, e).
Figure 1. Genome-wide binding of GOF p53 mutants.

a. Area under the curve analysis showing p53 enrichment (ChIP/Input) in five cell lines over TSS-proximal peak regions identified in each cell line. Mann-Whitney tests were performed to compute significance for combined WT and combined GOF p53 peaks: MCF7 (p=2.78×10⁻⁶), MDA-MB-175VII (p=2.15×10⁻⁴), MDA-MB-468 (p<2.2×10⁻¹⁶), HCC70 (p=1.09×10⁻³), BT-549 (p=3.7×10⁻⁵).
b. Co-immunoprecipitation of HEK293T cell expressed Flag-ETS2 with in vitro expressed GFP or HA tagged p53, followed by western blot.
c. GO analysis of p53 R273H TSS-proximal peaks (statistics are shown in Table S1). (Uncropped blots shown in Supplementary Fig. 1)
Figure 5. COMPASS inhibitors specifically reduce GOF p53 cell growth.

a, b. Growth curve analysis of LFS (a) MDAH087 and (b) MDAH041 cells treated with DMSO, and 10 μM or 20 μM MI-2-2.
c, d. Growth curve analysis of LFS (c) MDAH087 and (d) MDAH041 cells treated with DMSO, and 2 μM or 4 μM OICR-9429.
e. Growth analysis of p53 R172H MEFs carrying control or p53 knockdown, treated with DMSO or 4 μM OICR-9429.
f. Growth analysis of p53 R172H or p53 null MEFs treated with DMSO or 4μM OICR-9429.
g. Boxplots of TCGA RNA expression profiles in tumors with p53 WT, p53 GOF or p53 null. Mann-Whitney tests were performed to compute significance, n.s.: p>0.05.
We performed motif analysis for TSS-proximal peaks of the p53 R273H mutant and predict the E26 Transformation-Specific (ETS) motif as the most enriched (Extended Data Fig. 2a), which is distinct from the WT p53 motif (Extended Data Fig. 2b). Consistently, one ETS family member, ETS2, has been shown to associate with mutant p538. We confirmed that ETS2 interacts with various GOF p53 mutants, but to a much lesser extent with WT p53 (Fig. 1b; Extended Data Fig. 2c), as previously noted8. Co-immunoprecipitation at endogenous protein levels also demonstrated that ETS2 interacts with GOF p53, but not with WT p53 (Extended Data Fig. 2d, e). We analyzed ChIP-seq datasets from the ENCODE project for all transcription factors15,16, and observed that, compared to other transcription factors, ETS family proteins have significantly higher overlap with GOF p53 TSS-proximal peaks, but not with WT p53 TSS-proximal peaks (Extended Data Fig. 2f, g). Notably, in both WT and GOF p53 cases, RNA polymerase II (PolII) group has the highest percentage overlap with p53 peaks, indicative of transcriptional activity. The extent of PolII overlap is similar to the ETS group in GOF p53 cells, but much higher than the ETS group in WT p53 cells (Extended Data Fig. 2f, g).
GOF p53 targets chromatin regulators
To determine specific functional categories, we performed gene ontology (GO) analysis on TSS-proximal peaks. As expected, DNA damage response pathways were most enriched in WT p53 targets (Extended Data Fig. 2h; Table S1). In contrast, p53 R273H bound to genes related to translation and ribosomal synthesis (Fig. 1c; Table S1), which was reasonable given the rapid growth rate of these cells. We were particularly intrigued by GOF p53 binding to a group of genes functionally related to histone methylation (Fig. 1c). Indeed, this was seen in track views of kmt2a (mll1) and kmt2d (mll2), genes encoding methyltransferases of histone H3 Lysine 4 (H3K4) (Fig. 2a), that are components of alternative forms of the COMPASS complex (complex proteins associated with Set1). The other two GOF p53 mutants that we examined, as well as p53 R248W from LFS MDAH087 cells8, all showed similar binding at mll1 and mll2 (Extended Data Fig. 3a, b, e, f). Track views confirmed binding of GOF p53 to a gene encoding a common subunit of COMPASS complexes, rbbp5 (Extended Data Fig. 3h). In contrast, WT p53 did not appear to bind any of these genes, although as expected, it bound promoter regions of its canonical targets, including cdkn1a (p21), mdm2 and bbc3 (puma) (Fig. 2a; Extended Data Fig. 3c, i, j). We then analyzed a large set of 600 chromatin regulators for potential GOF p53 binding, and found an additional group of chromatin regulatory genes that showed peak enrichment (Table S2). Of great interest among these was kat6a (moz), a histone acetyltransferase, and track views confirmed the presence of GOF p53 but not WT p53 (Fig. 2a; Extended Data Fig. 3d, g).
Figure 2. GOF p53 mutants directly target chromatin regulators.
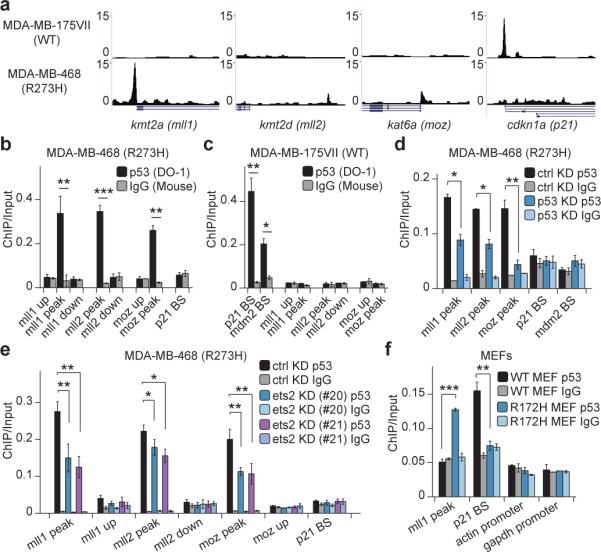
a. Track views of p53 occupancy over promoter regions of mll1, mll2, moz and p21.
b, c. ChIP-qPCR showing p53 or IgG enrichment (ChIP/Input) in (b) MDA-MB-468 and (c) MDA-MB-175VII cells. BS: p53 binding site. Primer locations shown in Extended Data Fig. 4a.
d, e. ChIP-qPCR showing p53 enrichment changes upon (d) p53 or (e) ets2 knockdown. #20 and #21 denote two short hairpins, sequences of which are shown in Table S3.
f. ChIP-qPCR showing p53 or IgG enrichment in MEFs bearing p53 WT or R172H. (Error bars represent mean ± s.e.m., n=3. Two-tailed Student's t-test: *p<0.05; **p<0.01; ***p<0.001)
Using ChIP-quantitative PCR (ChIP-qPCR), we validated the binding of GOF p53 to mll1, mll2, and moz genes, but not adjacently upstream or downstream of the peak regions (Fig. 2b; Extended Data Fig. 4a-c). Moreover, we confirmed GOF p53 binding to all other targets in the “histone methylation” GO category (rbbp5, ogt and ppp1cc), and to a few additional chromatin factors (including smarcd2 and dcaf10), in all three GOF p53 cell lines (Extended Data Fig. 4d-f). We verified the ChIP-qPCR results with a second p53 polyclonal antibody, FL393 (Extended Data Fig. 4g). In parallel experiments with both p53 antibodies, WT p53 showed binding to the p21 and mdm2 canonical binding sites, but not to any of the GOF p53 targets tested (Fig. 2c; Extended Data Fig. 4h). We also examined a pancreatic cancer cell line, PANC-1 (p53 R273H), and observed a similar binding pattern (Extended Data Fig. 4i), suggesting a general phenomenon in various cancer types. Furthermore, the ChIP-qPCR signal of GOF p53 was attenuated upon p53 knockdown (Fig. 2d). Knockdown of ets2 also led to reduced binding of GOF p53 over mll1 and moz, and to a lesser extent, over the mll2 peak region (Fig. 2e). To test the association of GOF p53 near mll1 in a non-tumor background, we performed ChIP-qPCR in primary mouse embryonic fibroblasts (MEFs) bearing GOF p53 or WT p53, and consistently, mouse GOF p53 showed significant enrichment over the mll1 promoter region (Fig. 2f).
GOF p53 regulates MLL, MOZ, and histone PTMs
To examine whether GOF p53 is required for expression of the chromatin regulators, we reduced GOF p53 level and found that the mRNA levels of mll1, mll2 and moz were also decreased (Fig. 3a; Extended Data Fig. 5a); whereas no change was detected when WT p53 level was reduced (Extended Data Fig. 5b). Simply increasing WT p53 protein level via Nutlin-mediated stabilization did not recapitulate activation of the chromatin regulators (Extended Data Fig. 5c, d). MLL1 protein level was also decreased in the GOF p53 knockdown (Fig. 3b), but not by WT p53 knockdown (Extended Data Fig. 5e), as was also observed for reduction of MOZ protein level upon GOF p53 knockdown (Extended Data Fig. 5f). Reduction of ETS2 level led to decreased expression of mll1 and moz, and to a lesser extent, mll2 (Fig. 3c; Extended Data Fig. 5g), which was in accordance with the relative binding changes of GOF p53 to these genes (Fig. 2e). We verified the ets2 knockdown result in another GOF p53 cell line, BT-549, and detected similarly decreased expression of mll1 and moz, and to a lesser extent, mll2 (Extended Data Fig. 5h, i). We also performed PolII ChIP-qPCR and observed concomitantly decreased PolII occupancy specifically over mll1, mll2, and moz TSS regions upon ets2 knockdown (Fig. 3d). We examined the importance of another ETS family member, ETS1. In contrast, ets1 knockdown had no effect on the expression of mll1, mll2, or moz (Extended Data Fig. 5j, k), nor did it alter GOF p53 or PolII binding (Extended Data Fig. 5l, m). Since ETS family proteins consist of 28 members17, it is likely that additional ETS protein(s) other than ETS1 may be involved. Nevertheless, our observations are consistent with previous studies showing that ETS2, but not ETS1, is important in mediating GOF p53 function8,18.
Figure 3. GOF p53 mutants regulate MLL and MOZ, and thereby histone PTMs.

a. RT-qPCR measuring mRNA level changes upon shRNA-mediated p53 knockdown.
b, c. Western blot of MLL1 protein level changes upon (b) p53 or (c) ets2 knockdown.
d. ChIP-qPCR showing PolII enrichment changes upon shRNA-mediated ets2 knockdown.
e. Western blot showing histone modification changes upon p53 knockdown over time.
f. Western blot (left) and quantification (right) of endogenous MLL1 protein levels in MEFs with p53 WT, R172H or null.
g. Western blot measuring MLL1 level changes upon p53 knockdown in MEFs bearing p53 R172H. #54549 and #12359 denote two short hairpins, sequences of which are shown in Table S3.
h. Western blot measuring endogenous histone modification levels in MEFs bearing p53 WT, R172H or null.
i. Overlaid track views of H3K4me3 and RNA levels in MEFs with p53 WT or R172H, over hoxa gene cluster.
j. ChIP-qPCR showing H3K4me3 enrichment (H3K4me3 ChIP/H3 ChIP) in MEFs with p53 WT, R172H or null.
(Uncropped blots shown in Supplementary Fig. 1. Error bars represent mean ± s.e.m., n=3. Two-tailed Student's t-test: *p<0.05; **p<0.01; ***p<0.001)
The regulation of histone modifying enzymes led to investigation of the cognate histone post-translational modifications (PTMs). We observed a global decrease in histone H3 Lysine 9 acetylation (H3K9ac, catalyzed by MOZ19) in response to knockdown of GOF p53, whereas other histone acetylation marks did not show significant changes (Fig. 3e; Extended Data Fig. 5n, o, p). The reduction of H3K9ac was also observed when MOZ level itself was decreased by shRNA (Extended Data Fig. 5q). In contrast, H3K4 tri-methylation and H3K4 mono-methylation (H3K4me3 and H3K4me1, catalyzed by MLL1 and MLL2, respectively20) showed only slight global reduction upon GOF p53 knockdown (Fig. 3e; Extended Data Fig. 5n, o, p). This is reasonable, however, given that H3K4 is methylated by six members of the COMPASS complexes20, and indeed, previous studies showed that inhibiting or knocking out one of them did not substantially change global H3K4 methylation21,22.
We further validated the regulation of mll1, mll2, and moz by GOF p53 in the knock-in MEFs. We found significantly higher expression of these genes in GOF p53 MEFs than in WT p53 MEFs or in MEFs derived from p53 knockout mice (p53 null MEFs) (Fig. 3f; Extended Data Fig. 6a-c). Furthermore, when GOF p53 was reduced, mll1 expression was also lowered (Fig. 3g; Extended Data Fig. 6d), and ectopically expressing GOF p53 in p53 null MEFs enhanced mll1 expression (Extended Data Fig. 6e, f). GOF p53 MEFs also showed higher global level of H3K9ac, and a slight elevation of H3K4me3, compared with WT p53 or p53 null MEFs (Fig. 3h; Extended Data Fig. 6g). Notably, other histone modifications associated with active gene transcription, including H3K27ac and H3K36me3, remained at comparable levels (Fig. 3h). In addition, H3K4me3 or H3K9ac did not change upon knockdown of WT p53 (Extended Data Fig. 6h), even though cell growth was increased as expected (Extended Data Fig. 6i). Taken together, these data suggest that changes in H3K4me3 and H3K9ac are specific to GOF p53 directly activating MLL1 and MOZ enzymes.
The modest global change in H3K4me3 in the presence of GOF p53 prompted investigation of local changes in H3K4 methylation. We performed RNA-seq and H3K4me3 ChIP-seq in MEFs with endogenous WT p53 or GOF p53. Compared with the genome-wide average, known MLL1 target genes22 were more highly expressed and displayed higher H3K4me3 enrichment in GOF p53 MEFs (Extended Data Fig. 6j). For example, we observed increased H3K4me3 level and RNA expression within the hoxa gene cluster (Fig. 3i; Extended Data Fig. 6k), a well-studied target of MLL1 and commonly upregulated in leukemia23,24. Conversely, WT p53 targets, such as p21, showed decreased RNA expression and TSS-associated H3K4me3 in GOF p53 MEFs (Extended Data Fig. 6l). Notably, H3K4me3 enrichment at the TSS of genes in GOF p53 MEFs was slightly, but significantly higher at a genome-wide level than in WT p53 MEFs (Extended Data Fig. 6m), consistent with the slight global increase of H3K4me3 (Fig. 3h). We validated the H3K4me3 ChIP-seq and RNA-seq results by ChIP-qPCR and RT-qPCR, respectively, observing in GOF p53 MEFs significantly higher H3K4me3 enrichment, and higher expression, of hox genes, than in WT p53 or p53 null MEFs (Fig. 3j; Extended Data Fig. 6n).
MLL1 is essential for cancer phenotype of GOF p53 cells
Previous studies have revealed that cells expressing GOF p53 rely on it for cell growth and survival25,26. Consistently, we observed that GOF p53 knockdown in cancer cells led to strong decrease in cell proliferation (Extended Data Fig. 7a). In contrast, lowering of WT p53 levels resulted in elevated growth (Extended Data Fig. 6i, 7b). To investigate the function of GOF p53 driving chromatin regulators, we carried out the same time course, and found that the reduction of MLL1 or MLL2 in GOF p53 cancer cells led to dramatic loss of cell growth (Extended Data Fig. 7c), phenocopying the knockdown of GOF p53 itself. In contrast, knockdown of mll1 or mll2 had minimal effect on WT p53 cancer cells (Extended Data Fig. 7d, e).
We addressed the importance of this pathway to tumor relevant phenotypes, first by examining the ability of cancer cells to form colonies. Reduction of MLL1 led to decreased colony formation ability of MDA-MB-468 cells (R273H) (Fig. 4a; Extended Data Fig. 7f), but had little effect on colony formation efficiency of MCF7 cells (WT) (Fig. 4b; Extended Data Fig. 7g). Similar results were observed in breast cancer cells BT-549 (R249S) and pancreatic cancer cells PANC-1 (R273H) (Extended Data Fig. 7h, i). We further confirmed the tumor formation phenotype in anchorage-independent growth assays in soft agar, showing that decreasing MLL1 specifically reduced the growth and colony size of GOF p53 cancer cells, but not WT p53 cancer cells (Extended Data Fig. 7j, k). We also investigated tumor growth on NOD-scid-gamma (NSG) immune-deficient mice. Knockdown of mll1 led to strongly reduced tumor formation ability in GOF p53 cells, as compared to GOF p53 cells with non-targeting scrambled control knockdown (Fig. 4c, e). In contrast, mll1 knockdown did not change tumor formation ability of WT p53 cancer cells (Fig. 4d, e), again supporting a specific role of MLL1 in cancers with GOF p53, but not WT p53.
Figure 4. MLL1 knockdown reduces proliferation and cancer phenotype of GOF p53 cells.

a, b. Colony formation (left) and quantification (right) in (a) MDA-MB-468 or (b) MCF7 cells with non-targeting control (ctrl) or mll1 knockdown (KD). Two-tailed Student's t-test: **p<0.01; n.s.: p>0.05. n=3, the other two biological replicates shown in Extended Data Fig. 7f, g.
c, d. Excised xenograft tumors twenty weeks after NSG immune-deficient mice were subcutaneously injected with (c) MDA-MB-468 or (d) MCF7 cells carrying control or mll1 knockdown. Two representative images out of four total in each group are shown.
e. Xenograft tumor volumes measured ten weeks after initial injection described in c, d. Palpable tumors smaller than 4mm3 were recorded as 4mm3 due to difficulties in measurement. Zeros indicate that the mouse did not have palpable tumor. Red horizontal lines shown as average tumor volume of all four mice in each group. Mann-Whitney test: ***p<0.001; n.s.: p>0.05.
f. Growth curve analysis and corresponding western blot in p53 R172H MEFs with control or p53 knockdown, and vector control (Vec) or MLL1 overexpression.
g, h. Growth curve analysis in LFS (g) MDAH087 or (h) MDAH041 cells with control or mll1 knockdown.
(Uncropped blots shown in Supplementary Fig. 1. Error bars represent mean ± s.e.m., n=3.)
To further explore a critical role that these chromatin regulators may play in supporting growth of GOF p53 cells, and to rule out possible confounding factors in established cancer cell lines, we performed mll1 knockdown in the primary MEFs with knock-in GOF p53. Consistently, MLL1 reduction resulted in decreased proliferation of GOF p53 MEFs (Extended Data Fig. 8a). Importantly, re-expression of MLL1 in GOF p53 MEFs with p53 knockdown partially rescued the growth defects (Fig. 4f); partial rescue likely results from GOF p53 driving expression of multiple downstream targets, as described above. These results strongly indicate a direct role of MLL1, functioning downstream of GOF p53 in maintaining proliferation of GOF p53 cells. We also performed mll1 knockdown (Extended Data Fig. 8b) in human non-cancer LFS cells – MDAH087 (p53 R248W) and MDAH041 (p53 null27; Extended Data Fig. 8c). Similar to the results obtained in cancer cells and in MEFs, mll1 knockdown reduced the growth rate of GOF p53 LFS cells (Fig. 4g; Extended Data Fig. 8d), again phenocopying the knockdown of GOF p53 itself (Extended Data Fig. 8e), but did not reduce the growth of either p53 null LFS cells (Fig. 4h; Extended Data Fig. 8f), nor primary non-cancer cells with WT p53 (IMR90 lung fibroblasts, Extended Data Fig. 8g, h). Re-expression of MLL1 again partially rescued the growth reduction by GOF p53 knockdown in LFS cells (Extended Data Fig. 8i). In addition, mll2 knockdown also decreased GOF p53 LFS cell proliferation, but not p53 null LFS cells (Extended Data Fig. 8j, k).
COMPASS inhibitors reduce GOF p53 cell growth
Chromatin regulators have emerged as promising targets of small molecule compounds in various human diseases including cancer11,28. Menin is a scaffold protein of the COMPASS complex20, directly interacting with the N-terminal of MLL129-31, and is crucial for MLL1 activity and for maintenance of a subtype of leukemia32,33. We treated both GOF p53 and p53 null LFS cells with the previously reported menin antagonist, MI-2-234,35. In agreement with the mll1 genetic knockdown experiments, MI-2-2 showed a dose-dependent inhibition of GOF p53 cell growth (Fig. 5a), but had very little effect on p53 null cells (Fig. 5b).
Recently, inhibition of MLL1 function has also been demonstrated by targeting its interaction with the WDR5 subunit of the COMPASS complex36,37. As a second approach to pharmacological inhibition of MLL1 activity, we used OICR-9429, a newly characterized antagonist of interaction of WDR5 with MLL138. This non-peptide, drug-like molecule binds to WDR5 in the MLL1 binding site of WDR5 (KD = 93 ± 28 nM), and disrupts the assembly of the WDR5/MLL1/RbBP5 complex in cells with IC50 values below 1 μM38. In striking similarity to MI-2-2, we found a dose-dependent inhibition by OICR-9429 of GOF p53 LFS cell growth (Fig. 5c), and, again, little effect on p53 null LFS cells (Fig. 5d). Moreover, in the genetically controlled MEF cells, we observed similar results, that OICR-9429 specifically inhibits cell proliferation of GOF p53 MEFs (Fig. 5e, f), but not when GOF p53 is reduced (Fig. 5e), or in p53 null MEFs (Fig. 5f). These results provide strong evidence for a specific growth inhibitory effect of pharmacological drugs in targeting MLL COMPASS complex activity downstream of GOF p53.
We examined the significance of our findings in the context of human tumor samples, by analyzing The Cancer Genome Atlas (TCGA). Based on p53 mutational status, we grouped tumor samples into: (1) WT (no detectable p53 mutation); (2) GOF (missense mutation of R175H, R248Q, R248W, R249S, or R273H); and (3) p53 null (p53 nonsense mutations or frameshift truncations). Tumors with other types of p53 mutations (other missense mutations, inframe insertion/deletion, or splicing mutations) were not included in further analysis, due to an unpredictable effect on the downstream chromatin regulators. We also focused our analysis on cancer types that include more than 5% samples in the group comprising GOF p53. We first combined all samples from these cancer types, and observed significantly higher RNA expression of mll1, mll2 and moz in GOF p53 tumors, compared to either WT p53 or p53 null tumors (Fig. 5g, top panels). As controls, expression levels of housekeeping genes including actin and gapdh are consistent across the three groups (Fig. 5g, middle panels), whereas expression levels of WT p53 targets p21, mdm2 and puma are significantly higher in the WT p53 group than the GOF p53 or p53 null group (Fig. 5g, lower panels). Next, we examined individual cancer types and observed similar gene expression patterns as the combination of all cancers (Extended Data Fig. 9a-f). Notably, given the heterogeneous population of tumor samples, and the small sample size of certain groups, not all pairwise comparisons are statistically significant, although the same trends always hold that GOF p53 tumors express higher levels of mll1, mll2, and moz than the other two groups. This is also true with canonical WT p53 targets, that is, although not all comparisons are statistically significant, the WT p53 groups always show higher levels of p21, mdm2 and puma than the GOF p53 or p53 null tumor groups.
Discussion
Our results indicate that distinct prevalent GOF p53 mutants bind to a common newly identified group of gene targets genome-wide, to drive expression of genes comprising a chromatin signature. The GOF p53 mapping occurs immediately associated with ETS motifs, and GOF p53 binds directly to ETS2, indicating that the substitutions in the DNA binding domain of p53 unleash a latent interaction with ETS family transcription factors, as previously suggested8. Within this chromatin signature gene group targeted by GOF p53, the COMPASS methyltransferase pathway appears to be particularly well represented, but the new binding includes other chromatin regulators, such as the acetyltransferase, moz. We find that expression of these modifying enzymes is dependent on GOF p53, which in turn elevates activating histone modifications, including H3K4me3 and H3K9ac. Our evidence points to MLL downstream pathways as key targets of GOF p53. Thus, as is the case in leukemia bearing translocations of MLL, MLL pathways may contribute to GOF p53 oncogenic phenotypes and therefore cancer progression.
Importantly, our findings in both human cancer cells and LFS cells show that GOF p53 cells lose growth and tumor formation potential with similar timing kinetics upon knockdown of mll1 as they do with knockdown of GOF p53. A key comparison - to cancer and LFS cells that express WT p53 or are null for p53 - shows very little response to mll1 knockdown. Hence, GOF p53 cells appear exquisitely dependent for growth on the MLL1 pathway. We provide further evidence of GOF p53 cell growth dependence on the COMPASS complex, by analyzing cell sensitivity to two different pharmacological small compound inhibitors. These compounds target menin or WDR5 interaction with MLL1, and inhibit proliferation of LFS cells and MEFs expressing GOF p53 but not p53 null. The effects of the inhibitors are thus analogous to direct knockdown of mll1. Hence, we conclude that a large cohort of GOF p53 driven cancers, not previously known to be growth dependent on chromatin pathways, may be amenable to epigenetic therapeutics.
METHODS
Cell culture
MCF7, MDA-MB-175VII, HCC70, BT-549, and MDA-MB-468 cell lines were obtained from American Type Culture Collection (ATCC), and were cultured in 37°C incubator at 20% oxygen, in standard tissue culture medium (DMEM with 10% FBS, 100 units per ml penicillin and 100 μg per ml streptomycin) supplied with non-essential amino acids. Li-Fraumeni Syndrome cell lines MDAH087 and MDAH041 were obtained from Dr. Michael A. Tainsky (Wayne State University, Detroit, MI) as a kind gift, and were cultured in 37°C incubator at 3% oxygen, in standard tissue culture medium. R172H knock-in mice were generated by Dr. Tyler Jacks (Massachusetts Institute of Technology)3 and obtained from the NCI Mouse Repository. Primary MEFs from 13.5-day embryos were generated as previously described39, and cultured in standard tissue culture medium in 37°C incubator at 3% oxygen condition.
Western blot and antibodies
Cells were lysed in modified RIPA buffer containing 150 mM NaCl, 1% NP-40, 50 mM Tris-Cl, pH 8.0, and 1% SDS, supplemented with protease inhibitors (Life Technologies, #78446) before use. Protein concentration was determined by BCA protein assay (Life Technologies, #23227), following which equal amount of proteins were loaded and separated in polyacrylamide gels. Proteins were then transferred to nitrocellulose membrane. Antibodies used in this study were as follows: p53 monoclonal antibody DO-1 (Calbiochem EMD); p53 polyclonal antibody FL393 (Santa Cruz Biotechnology Inc., sc-6243). Flag (Sigma, M2, F1804), HA (Rockland, 600-401-384), histone H3 (abcam, ab1791), H3K4me1 (abcam, ab8895), H3K4me2 (Active Motif, 39142), H3K4me3 (abcam, ab8580), H3K9ac (Active Motif, 39137), H3K14ac (Active Motif, 39616), H3K27ac (abcam, ab4729), H3K36me3 (abcam, ab9050), ETS2 (Santa Cruz Biotechnology Inc., sc-351), MLL1 (Bethyl Laboratories Inc., A300-086A), MOZ (Novus Biologicals, 21620002), mouse p53 antibody for ChIP experiments (Santa Cruz Biotechnology Inc., sc-1312 (M-19)), mouse p53 antibody for western blot analysis (Cell Signaling Technology, #2524), RNA polymerase II (abcam, ab817).
Co-Immunoprecipitation
Flag tagged ETS2 protein was transfected (Life Technologeis, #11668019) and expressed in HEK293T cells, which was then subjected to immunoprecipitation with Flag antibody conjugated protein G Dynabeads (Life Technologies, #10004D). Following stringent washes, HA tagged WT or GOF p53 (generated by in vitro translation (Thermo, #88881)) was added to co-immunoprecipitate with Flag-ETS2 in buffer containing: 20 mM Tris, pH 8.0, 137 mM NaCl, 1 mM MgCl2, 1 mM CaCl2, 1% NP-40, and protease inhibitors. Endogenous co-immunoprecipitation experiments were performed in buffer containing: 20 mM Tris, pH 8.0, 137 mM NaCl, 1 mM MgCl2, 1 mM CaCl2, 1% NP-40, 10% glycerol, with protease and phosphatase inhibitors, and 12.5 U/ml benzonase (Novagen, 70746).
Bacterial expression and GST pulldown
GST-tagged ETS2 constructs were transformed and expressed in BL21-CodonPlus E. coli. Bacterial lysates were incubated with glutathione beads (Life Technologies, #G2879) at 4°C for 2 hours, and washed 4 times with buffer containing 50 mM Tris, pH 7.5, 150 mM NaCl, 1% Triton, 1 mM DTT, supplemented with 100 μM PMSF. The in vitro translated (Thermo, #88881) HA tagged WT or GOF p53 proteins were pre-cleared with GST at 4°C for 1 h and the resulting supernatant was subjected to GST pulldown with GST or GST-ETS2. The product was then washed and subjected to western blot analysis.
RT-qPCR, ChIP-qPCR and ChIP-sequencing
RNA was isolated from cells using RNeasy kit (Qiagen, #74106). RNA was then reverse transcribed to cNDA (Life Technologies, #4387406), following which qPCR was performed for quantification using standard procedures on a 7900HT Fast-Real-Time PCR platform (ABI). ChIP was performed as previously described40, with modifications. In brief, cells were crosslinked in 1% formaldehyde (Thermo, #28906) in PBS for 10 min at room temperature. After glycine quenching, cell pellets were collected and lysed as previously described40, and then subjected to sonication with the Covaris sonicator (S220). The supernatant was then diluted in the same sonication buffer but without N-Lauroylsarcosine, and subjected to immunoprecipitation with corresponding antibodies at 4°C overnight. The beads were then washed and DNA was reverse-crosslinked and purified. Following ChIP, DNA was quantified by qPCR using standard procedures on a 7900HT Fast-Real-Time PCR platform (ABI), or sequencing libraries were prepared using NEBNext Ultra library preparation procedure, and then sequenced on Illumina Hi-Seq platform at the Next-Generation Sequence Core at University of Pennsylvania, or on Illumina Next-Seq platform in the Epigenetics Program at the University of Pennsylvania. All primer sequences used in this study are available in Supplementary Table 3.
Growth curve measurement
200,000 cells were seeded on 950 mm2 surface area (one well of 6-well plate) on Day 0. Cell number was measured every two days with Countess automated cell counter (Life Technologies) following standard procedure and default parameter settings, after which 200,000 cells were plated back for the next count. For shRNA-mediated knockdown experiments, cells were seeded seven days after the initial infection of shRNA-containing lentivirus, during which puromycin selection was completed and cells were returned to normal growth medium. For small compound inhibitor treatment experiments, inhibitors or DMSO vehicle control were added on Day 0 as cells were seeded, and refreshed every other day as cells were counted and replated. All short hairpin sequences used in this study are available in Supplementary Table 3.
Colony-formation assay
After lentiviral infection of shRNA constructs and puromycin selection, 2000 cells were seeded per well in 6-well plates. After three weeks, cell colonies were fixed with 1% paraformaldehyde and stained with 0.1% crystal violet (for 15 minutes). For quantification, the crystal violet dye was released into 10% acetic acid and measured at OD590.
Soft agar anchorage-independent growth assay
The base layer of soft agar contained complete DMEM media (10% FBS, 100 units per ml penicillin and 100 μg per ml streptomycin) with 1% agar; the top layer of soft agar contained complete DMEM media with 0.7% agarose and was mixed with 5000 cells and plated over the base layer. Colonies were fixed and stained with 0.005% crystal violet (for 1 hour), and visible colonies were counted.
Tumor xenograft assay
4 male and 4 female mice (Mus musculus, strain NOD.Cg-Prkdcscid Il2rgtm1Wjl/SzJ, Jackson Labs (stock # 005557)) between the ages of 38 and 45 days old were used per treatment for tumor xenograft experiments. All animal experiments described within adhere to policies and practices approved by the University of Pennsylvania Institutional Biosafety Committee (IBC) and the Institutional Animal Care and Use Committe (IACUC). Cells were harvested after shRNA (MLL1 or non-targeting control) mediated knockdowns. 1.5 million cells were injected subcutaneously per mouse. Tumor size was measured by calipers ten weeks after subcutaneous injection. Tumor size was measured in two dimensions, and tumor volume was calculated as: ½ × Length × Width2. All mice were euthanized twenty weeks after subcutaneous injection. Tumors were then excised and photographed.
ChIP-sequencing and RNA-sequencing analysis
Human cell sequencing reads were aligned to human genome hg18 using Bowtie241. For p53 ChIP-seq, significant regions of enrichment (peaks) were called using HOMER (Salk Institute, http://homer.salk.edu). For area under the curve analysis, ChIP-seq tags from each cell line were counted at TSS proximal peaks (+/−200bp around peak centers) of every cell line (including itself) as indicated. Heat maps of p53 enrichment across a 5kb region (−/+ 2.5kb from peak center, bin=10) in MCF7, MDA-MB-175VII, MDA-MB-468, HCC70, BT-549 cell lines were generated using HOMER and visualized using JavaTreeView. Sequencing reads from MEFs ChIP-seq experiments were aligned to the mouse reference genome mm9 using Bowtie2. Strand-specific mouse RNA-seq experiments were aligned to the mm9 reference genome and reference transcriptome. FPKM expression values were counted for each exon and merged into a single gene model using HOMER.
Motif analysis
To determine associated sequence motifs for WT p53 or GOF p53 peaks, all TSS proximal peaks (filtered to remove peaks overlapping with satellite DNA) were pared down to the central 50bp and used as input to MEME and the SeqPos utility in Cistrome (central 100bp as required by SeqPos). MEME was instructed to search for the top 10 motifs appearing 0 or more times in each sequence, and SeqPos was run with default parameters.
Gene ontology analysis
GO terms associated with WT p53 or GOF p53 binding sites were determined in the following way. ChIP-seq TSS proximal peaks were associated with the nearest ENSEMBL transcript and processed using DAVID. The FDR was controlled at 1% and GO terms with fewer than 5 associated transcripts or a fold-enrichment over the genomic background under 5-fold were discarded.
Intersection with ENCODE transcription factor datasets
Transcription factor peak coordinates (hg18 assembly) were obtained from the ENCODE project repository (www.encodeproject.org) in BED format. TSS proximal p53 ChIP-seq peak regions were intersected with all transcription factor binding site data using BEDTools, with overlap inferred if a minimum of a single base pair was in common.
TCGA analysis
Exome sequencing and RNA sequencing datasets were obtained from TCGA (https://tcga-data.nci.nih.gov/tcga/). Based on p53 mutational status from the exome sequencing datasets, we grouped tumor samples into: (1) WT (tumors without detectable p53 mutation); (2) GOF (tumors with p53 single missense mutation of R175H, R248Q, R248W, R249S, or R273H); and (3) Null (tumors with p53 nonsense mutations or frameshift truncations). Tumors with other types of p53 mutations (other missense mutations, inframe insertion/deletion, or splicing mutations) were not included in further analysis, due to an unpredictable effect on the downstream chromatin regulators. Cancer types that include more than 5% samples in group 2 were included for the combined analysis, in which RNA expression values were normalized to the WT group median. For individual cancer type analysis, original RNA expression values (normalized read counts or RPKM values) from TCGA datasets were used.
OICR-9429
OCIR-9429 was developed using structure-guided medicinal chemistry and peptide displacement assays starting from ‘Compound 3’ previously reported in Senisterra et al42, as part of the Chemical Probe Program of the Structural Genomics Consortium. OICR-9429 is highly specific for WDR5 and was shown to have >100-fold selectivity over 300 other chromatin “reader” domains, methyl-transferases, and other non-epigenetic targets. The details of its structure, discovery and characterization are described in Grebien et al38.
Extended Data
Extended Data Figure 1. Distinct GOF p53 mutants have similar genome-wide binding patterns, but are different from that of WT p53.

a. Heatmaps showing the enrichment of p53 peaks (+/− 2500 bp around peak center) identified from each cell line (rows) in all five cell lines (columns) examined by ChIP-seq.
b, c, d, e. Area under the curve, meta-peak analysis showing GOF p53 R248W or IgG ChIP-seq signal enrichment from MDAH087 cells over TSS-proximal peaks identified in (b) MDA-MB-468, (c) HCC70, (d) MCF7 and (e) MDA-MB-175VII cells.
Extended Data Figure 2. GOF p53 genome-wide binding is in association with ETS family proteins.

a. Canonical ETS binding motif (up), and discovered motif from all TSS-proximal peaks in MDA-MB-468 predicted by MEME/TomTom (middle), or SeqPos (down).
b. MEME/TomTom discovered WT p53 motif from MDA-MB-175VII TSS-proximal peaks.
c. GST pulldown of bacterially expressed GST or GST-ETS2 with in vitro translated p53 WT or p53 R175H.
d, e. Co-immunoprecipitation at endogenous protein levels of ETS2 and (d) GOF p53 R273H or (e) WT p53 in (d) MDA-MB-468 or (e) MCF7 cells.
f, g. Boxplots showing overlap of (f) GOF p53 TSS-proximal peaks from MDA-MB-468 cells or (g) WT p53 TSS-proximal peaks from MCF7 cells, with ETS family proteins (blue), all other transcription factors (grey), or PolII (white) peaks from ENCODE ChIP-seq datasets. Mann-Whitney tests were performed to compute significance.
h. GO analysis of WT p53 TSS-proximal peaks (statistics are shown in Supplementary Table S1).
Extended Data Figure 3. Genome browser track views showing distinct WT p53 and GOF p53 binding patterns over representative canonical WT p53 targets and novel GOF p53 targets.

a, b, c, d. Track views of p53 occupancy over promoter regions of (a) mll1, (b) mll2, (c) p21 and (d) moz, in MCF7, HCC70 and BT-549 cells.
e, f, g. Re-aligned GOF p53 R248W and IgG ChIP-seq data from LFS MDAH087 cells, showing enrichment of GOF p53 at promoter regions of (e) mll1, (f) mll2, and (g) moz.
h, i, j. Track views of p53 occupancy over promoter regions of (h) rbbp5, (i) mdm2 and (j) puma, in MCF7, MDA-MB-175VII, HCC70, BT-549 and MDA-MB-468 cells.
Extended Data Figure 4. ChIP-qPCR validation of GOF p53 binding at newly identified chromatin regulator genes.

a. Schematic of amplicon locations for ChIP-qPCR validations performed in this study.
b, c. ChIP-qPCR showing p53 (DO-1 antibody) or IgG (Mouse) enrichment (ChIP/Input) over mll1, mll2 and moz peak regions, in (b) BT-549 and (c) HCC70 cells.
d, e, f. ChIP-qPCR showing p53 (DO-1 antibody) or IgG (Mouse) enrichment over ogt, ppp1cc, rbbp5, smarcd2 and dcaf10 peak regions, in (d) BT-549, (e) HCC70 and (f) MDA-MB-468 cells.
g, h. ChIP-qPCR showing p53 (FL393 antibody) or IgG (Rabbit) enrichment over mdm2, p21, mll1, mll2 and moz regions, in (g) MDA-MB-468 and (h) MDA-MB-175VII cells.
i. ChIP-qPCR showing p53 (DO-1 antibody) or IgG (Mouse) enrichment over mll1, mll2 and moz peak regions in PANC-1 cells.
(Error bars represent mean ± s.e.m., n=3. Two-tailed Student's t-test: *p<0.05; **p<0.01; ***p<0.001)
Extended Data Figure 5. GOF p53 regulates expression of MLL1, MLL2 and MOZ, and corresponding histone PTMs, in cancer cells.

a, b. RT-qPCR analysis measuring mRNA level changes upon (a) siRNA-mediated GOF p53 knockdown in MDA-MB-468 cells, and (b) shRNA-mediated WT p53 knockdown in MDA-MB-175VII cells.
c, d. (c) RT-qPCR analysis of mRNA levels, and (d) western blot analysis of protein levels upon DMSO or Nutlin treatment in MCF7 cells.
e. Western blot analysis of MLL1 protein level upon shRNA-mediated WT p53 knockdown in MDA-MB-175VII cells.
f. Western blot analysis of MOZ protein level change upon shRNA-mediated GOF p53 knockdown in MDA-MB-468 cells.
g. RT-qPCR measuring mRNA levels changes upon shRNA-mediated ets2 knockdown in MDA-MB-468 cells.
h, i. (h) RT-qPCR measuring mRNA levels and (i) western blot measuring protein levels upon shRNA-mediated ets2 knockdown in BT-549 cells.
j, k. RT-qPCR measuring mRNA levels changes upon shRNA-mediated ets1 knockdown in (j) BT-549 and (k) MDA-MB-468 cells. #89 and #91 denote two short hairpins targeting ets1, sequences of which are shown in Table S3.
l, m. ChIP-qPCR showing (l) p53 occupancy and (m) PolII occupancy upon shRNA-mediated ets1 knockdown in MDA-MB-468 cells.
n, o. Western blot analysis of histone methylation and acetylation level changes upon (n) siRNA-mediated or (o) shRNA-mediated knockdown of GOF p53 in MDA-MB-468 cells.
p. Western blot analysis of histone methylation and acetylation level changes upon GOF p53 knockdown in PANC-1 cells.
q. Western blot of H3K9ac change upon moz knockdown in MDA-MB-468 cells.
(Uncropped blots shown in Supplementary Fig. 1. Error bars represent mean ± s.e.m., n=3. Two-tailed Student's t-test: *p<0.05; **p<0.01; ***p<0.001)
Extended Data Figure 6. GOF p53 regulates expression of MLL1, MLL2 and MOZ, and corresponding histone PTMs, in primary MEFs.

a. RT-qPCR analysis comparing mll1 expression levels between MEFs bearing WT p53, GOF p53 R172H, and p53 null.
b. Western blot comparing MLL1 protein level between MEFs with WT p53 and GOF p53.
c. RT-qPCR analysis comparing mll2 and moz expression levels between MEFs bearing WT p53, GOF p53 R172H, and p53 null.
d. RT-qPCR measuring mRNA changes upon shRNA-mediated p53 knockdown in GOF p53 R172H knock-in MEFs.
e, f. (e) RT-qPCR analysis of mRNA levels and (f) western blot of protein levels upon retroviral expression of GOF p53 R172H in MEFs with p53 knockout.
g. Western blot comparing H3K4me3 and H3K9ac levels between MEFs with WT p53 and GOF p53 R172H.
h. Western blot showing H3K4me3 and H3K9ac levels upon p53 knockdown in WT p53 MEFs.
i. Growth curve analysis of WT p53 MEF proliferation upon shRNA-mediated p53 knockdown.
j, k. Boxplot analysis of RNA levels (left) and H3 normalized H3K4me3 levels (right) at (j) previously discovered MLL1 target genes, or (k) hoxa cluster genes compared with all genes, from RNA-seq and H3K4me3 ChIP-seq in MEFs with WT p53 or GOF p53 R172H. Plots are presented as ratios of GOF p53 R172H values over WT p53 values.
l. Track views of H3K4me3 enrichment (up) and RNA levels (down) of p21, from H3K4me3 ChIP-seq and RNA-seq of MEFs with WT p53 or GOF p53 R172H. Tracks are presented as overlay of WT p53 and GOF p53 signals. Blue denotes more enriched in WT p53, red denotes more enriched in GOF p53 R172H, black denotes overlap.
m. Boxplot of H3 normalized H3K4me3 levels over all gene TSSs, from H3K4me3 ChIP-seq in MEFs with WT p53 or GOF p53 R172H.
n. RT-qPCR analysis comparing hox gene expression levels between MEFs bearing WT p53, GOF p53 R172H and p53 null.
(Uncropped blots shown in Supplementary Fig. 1. For all bar graphs, two-tailed Student's t-test: *p<0.05; **p<0.01; ***p<0.001. Error bars represent mean ± s.e.m., n=3. For all boxplots, Mann-Whitney test: *p<0.05; **p<0.01; ***p<0.001.)
Extended Data Figure 7. MLL knockdown reduces proliferation and cancer phenotype specifically of GOF p53 cancer cells.

a, b. Growth curve analysis of (a) MDA-MB-468 and (b) MDA-MB-175VII cells with either non-targeting control shRNA or p53 shRNA knockdown.
c, d. Growth curve analysis of (c) MDA-MB-468 and (d) MDA-MB-175VII cells with non-targeting control shRNA, mll1 shRNA, or mll2 shRNA knockdown.
e. Growth curve analysis of MCF7 cells with non-targeting control shRNA or mll1 shRNA knockdown.
f, g. Colony-formation assay of (f) MDA-MB-468 cells and (g) MCF7 cells with either non-targeting control shRNA or mll1 shRNA knockdown. Corresponding to Fig. 4a, b.
h, i. Colony-formation assay of (h) BT-549 cells and (i) PANC-1 cells with either non-targeting control shRNA, or two different mll1 shRNA knockdown, and quantification by crystal violet staining over three biological replicates. Reduction of MLL1 protein is also shown by western blot.
j, k. Anchorage-independent soft agar assay of (j) MDA-MB-468 cells and (k) MCF7 cells with either non-targeting control shRNA or mll1 shRNA knockdown. Dashed boxes denote enlarged images of the selected areas. White arrows indicate visible colonies in (j). Quantifications are shown as number of visible colonies.
(Error bars represent mean ± s.e.m., n=3. Two-tailed Student's t-test: **p<0.01; ***p<0.001.)
Extended Data Figure 8. MLL knockdown reduces proliferation specifically of GOF p53 MEFs and LFS cells.

a. Growth curve analysis of GOF p53 R172H MEFs with either non-targeting control shRNA or two different mll1 shRNA knockdown.
b. Western blot analysis of MLL1 levels upon shRNA-mediated knockdown in LFS MDAH087 and MDAH041 cells.
c. Western blot analysis of p53 protein levels in LFS MDAH087 and MDAH041 cells.
d, e. Growth curve analysis of LFS MDAH087 cells upon (d) mll1 knockdown or (e) p53 knockdown.
f. Growth curve analysis of LFS MDAH041 cells upon mll1 knockdown.
g, h. (g) Western blot analysis of MLL1 level and (h) growth curve analysis of proliferation upon shRNA-mediated mll1 knockdown in IMR90 cells.
i. Growth curve analysis of LFS MDAH087 cells with non-targeting control shRNA plus empty vector, p53 shRNA plus vector, and p53 shRNA plus MLL1 expressing vector.
j, k. Growth curve analysis of (j) LFS MDAH087 and (k) LFS MDAH041 cells with either non-targeting control shRNA or mll2 shRNA knockdown.
Extended Data Figure 9. TCGA RNA expression profile analysis.

a-f. TCGA RNA expression profile of GOF p53 target genes (top), housekeeping genes (middle), and WT p53 target genes (bottom) in (a) brain lower grade glioma, (b) head and neck squamous cell carcinoma, (c) bladder urothelial carcinoma, (d) colon adenocarcinoma, (e) esophageal carcinoma, or (f) pancreatic adenocarcinoma tumors with WT p53 (blue), GOF p53 (orange), or p53 null (white). Expression values are normalized read counts ((a), (b), (c), (d) and (f)), or RPKM values (e) from TCGA RNA-seq datasets. Mann-Whitney tests were performed to compute significance.
Supplementary Material
Acknowledgements
We thank M. Tainsky for the LFS cell lines; A. Weller, J. Glover and the Stem Cell and Xenograft Core at the University of Pennsylvania for help with the tumor xenograft experiments. S.L.B. is supported by NIH grant R01 CA078831. M.A.S. is supported by a Postdoctoral Fellowship from the American Cancer Society. X.H. is supported in part by a pilot grant from ITMAT of the University of Pennsylvania. The SGC is a registered charity (number 1097737) that receives funds from AbbVie, Boehringer Ingelheim, Canada Foundation for Innovation (CFI), the Canadian Institutes for Health Research (CIHR), Genome Canada through the Ontario Genomics Institute [OGI-055], GlaxoSmithKline, Janssen, Lilly Canada, the Novartis Research Foundation, the Ontario Ministry of Economic Development and Innovation, Pfizer, Takeda, and the Wellcome Trust [092809/Z/10/Z]. The Ontario Institute for Cancer Research is funded by the Government of Ontario.
Footnotes
Author Contributions
J.Z. and S.L.B. initiated and led the project. J.Z., M.A.S., Z.D. and S.L.B. designed the experiments and interpreted the data. J.Z. and M.A.S. performed the experiments. J.Z., M.A.S. and G.D. analyzed all next-generation sequencing data. M.V., M.G., D.B.-L., R.A.-A. and C.H.A. developed OICR9429. B.W.K. and X.H. contributed to the use of menin inhibitor. A.S. and J.H. contributed to reagents used in this study. J.Z., M.A.S., C.H.A. and S.L.B. composed the manuscript. All authors reviewed and commented on the manuscript.
Author Information
ChIP-seq and RNA-seq data can be accessed through NCBI Gene Expression Omnibus (GEO) database with accession number GSE59176. The authors declare no competing financial interests.
REFERENCES
- 1.Lawrence MS, et al. Discovery and saturation analysis of cancer genes across 21 tumour types. Nature. 2014;505:495–501. doi: 10.1038/nature12912. doi:10.1038/nature12912. [DOI] [PMC free article] [PubMed] [Google Scholar]
- 2.Lang GA, et al. Gain of function of a p53 hot spot mutation in a mouse model of Li-Fraumeni syndrome. Cell. 2004;119:861–872. doi: 10.1016/j.cell.2004.11.006. doi:10.1016/j.cell.2004.11.006. [DOI] [PubMed] [Google Scholar]
- 3.Olive KP, et al. Mutant p53 gain of function in two mouse models of Li-Fraumeni syndrome. Cell. 2004;119:847–860. doi: 10.1016/j.cell.2004.11.004. doi:10.1016/j.cell.2004.11.004. [DOI] [PubMed] [Google Scholar]
- 4.Freed-Pastor WA, et al. Mutant p53 disrupts mammary tissue architecture via the mevalonate pathway. Cell. 2012;148:244–258. doi: 10.1016/j.cell.2011.12.017. doi:10.1016/j.cell.2011.12.017. [DOI] [PMC free article] [PubMed] [Google Scholar]
- 5.Zhang C, et al. Tumour-associated mutant p53 drives the Warburg effect. Nat Commun. 2013;4:2935. doi: 10.1038/ncomms3935. doi:10.1038/ncomms3935. [DOI] [PMC free article] [PubMed] [Google Scholar]
- 6.Subramanian M, et al. A mutant p53/let-7i-axis-regulated gene network drives cell migration, invasion and metastasis. Oncogene. 2014 doi: 10.1038/onc.2014.46. doi:10.1038/onc.2014.46. [DOI] [PMC free article] [PubMed] [Google Scholar]
- 7.Weissmueller S, et al. Mutant p53 drives pancreatic cancer metastasis through cell-autonomous PDGF receptor beta signaling. Cell. 2014;157:382–394. doi: 10.1016/j.cell.2014.01.066. doi:10.1016/j.cell.2014.01.066. [DOI] [PMC free article] [PubMed] [Google Scholar]
- 8.Do PM, et al. Mutant p53 cooperates with ETS2 to promote etoposide resistance. Genes Dev. 2012;26:830–845. doi: 10.1101/gad.181685.111. doi:10.1101/gad.181685.111. [DOI] [PMC free article] [PubMed] [Google Scholar]
- 9.Scian MJ, et al. Modulation of gene expression by tumor-derived p53 mutants. Cancer Res. 2004;64:7447–7454. doi: 10.1158/0008-5472.CAN-04-1568. doi:10.1158/0008-5472.CAN-04-1568. [DOI] [PubMed] [Google Scholar]
- 10.Garritano S, Inga A, Gemignani F, Landi S. More targets, more pathways and more clues for mutant p53. Oncogenesis. 2013;2:e54. doi: 10.1038/oncsis.2013.15. doi:10.1038/oncsis.2013.15. [DOI] [PMC free article] [PubMed] [Google Scholar]
- 11.Dawson MA, Kouzarides T. Cancer epigenetics: from mechanism to therapy. Cell. 2012;150:12–27. doi: 10.1016/j.cell.2012.06.013. doi:10.1016/j.cell.2012.06.013. [DOI] [PubMed] [Google Scholar]
- 12.Tam WL, Weinberg RA. The epigenetics of epithelial-mesenchymal plasticity in cancer. Nat Med. 2013;19:1438–1449. doi: 10.1038/nm.3336. doi:10.1038/nm.3336. [DOI] [PMC free article] [PubMed] [Google Scholar]
- 13.Kouzarides T. Chromatin modifications and their function. Cell. 2007;128:693–705. doi: 10.1016/j.cell.2007.02.005. doi:10.1016/j.cell.2007.02.005. [DOI] [PubMed] [Google Scholar]
- 14.Li B, Carey M, Workman JL. The role of chromatin during transcription. Cell. 2007;128:707–719. doi: 10.1016/j.cell.2007.01.015. doi:10.1016/j.cell.2007.01.015. [DOI] [PubMed] [Google Scholar]
- 15.Bernstein BE, et al. An integrated encyclopedia of DNA elements in the human genome. Nature. 2012;489:57–74. doi: 10.1038/nature11247. doi:10.1038/nature11247. [DOI] [PMC free article] [PubMed] [Google Scholar]
- 16.Gertz J, et al. Distinct properties of cell-type-specific and shared transcription factor binding sites. Mol Cell. 2013;52:25–36. doi: 10.1016/j.molcel.2013.08.037. doi:10.1016/j.molcel.2013.08.037. [DOI] [PMC free article] [PubMed] [Google Scholar]
- 17.Hollenhorst PC, McIntosh LP, Graves BJ. Genomic and biochemical insights into the specificity of ETS transcription factors. Annu Rev Biochem. 2011;80:437–471. doi: 10.1146/annurev.biochem.79.081507.103945. doi:10.1146/annurev.biochem.79.081507.103945. [DOI] [PMC free article] [PubMed] [Google Scholar]
- 18.Xiong S, et al. Pla2g16 phospholipase mediates gain-of-function activities of mutant p53. Proc Natl Acad Sci U S A. 2014;111:11145–11150. doi: 10.1073/pnas.1404139111. doi:10.1073/pnas.1404139111. [DOI] [PMC free article] [PubMed] [Google Scholar]
- 19.Voss AK, Collin C, Dixon MP, Thomas T. Moz and retinoic acid coordinately regulate H3K9 acetylation, Hox gene expression, and segment identity. Dev Cell. 2009;17:674–686. doi: 10.1016/j.devcel.2009.10.006. doi:10.1016/j.devcel.2009.10.006. [DOI] [PubMed] [Google Scholar]
- 20.Shilatifard A. The COMPASS family of histone H3K4 methylases: mechanisms of regulation in development and disease pathogenesis. Annu Rev Biochem. 2012;81:65–95. doi: 10.1146/annurev-biochem-051710-134100. doi:10.1146/annurev-biochem-051710-134100. [DOI] [PMC free article] [PubMed] [Google Scholar]
- 21.Cao F, et al. Targeting MLL1 H3K4 methyltransferase activity in mixed-lineage leukemia. Mol Cell. 2014;53:247–261. doi: 10.1016/j.molcel.2013.12.001. doi:10.1016/j.molcel.2013.12.001. [DOI] [PMC free article] [PubMed] [Google Scholar]
- 22.Wang P, et al. Global analysis of H3K4 methylation defines MLL family member targets and points to a role for MLL1-mediated H3K4 methylation in the regulation of transcriptional initiation by RNA polymerase II. Mol Cell Biol. 2009;29:6074–6085. doi: 10.1128/MCB.00924-09. doi:10.1128/MCB.00924-09. [DOI] [PMC free article] [PubMed] [Google Scholar]
- 23.Milne TA, et al. MLL targets SET domain methyltransferase activity to Hox gene promoters. Mol Cell. 2002;10:1107–1117. doi: 10.1016/s1097-2765(02)00741-4. [DOI] [PubMed] [Google Scholar]
- 24.Nakamura T, et al. ALL-1 is a histone methyltransferase that assembles a supercomplex of proteins involved in transcriptional regulation. Mol Cell. 2002;10:1119–1128. doi: 10.1016/s1097-2765(02)00740-2. [DOI] [PubMed] [Google Scholar]
- 25.Lim LY, Vidnovic N, Ellisen LW, Leong CO. Mutant p53 mediates survival of breast cancer cells. Br J Cancer. 2009;101:1606–1612. doi: 10.1038/sj.bjc.6605335. doi:10.1038/sj.bjc.6605335. [DOI] [PMC free article] [PubMed] [Google Scholar]
- 26.Alexandrova EM, et al. Improving survival by exploiting tumour dependence on stabilized mutant p53 for treatment. Nature. 2015 doi: 10.1038/nature14430. doi:10.1038/nature14430. [DOI] [PMC free article] [PubMed] [Google Scholar]
- 27.Zhu Q, Wani G, Wani MA, Wani AA. Human homologue of yeast Rad23 protein A interacts with p300/cyclic AMP-responsive element binding (CREB)-binding protein to down-regulate transcriptional activity of p53. Cancer Res. 2001;61:64–70. [PubMed] [Google Scholar]
- 28.Dawson MA, Kouzarides T, Huntly BJ. Targeting epigenetic readers in cancer. N Engl J Med. 2012;367:647–657. doi: 10.1056/NEJMra1112635. doi:10.1056/NEJMra1112635. [DOI] [PubMed] [Google Scholar]
- 29.Huang J, et al. The same pocket in menin binds both MLL and JUND but has opposite effects on transcription. Nature. 2012;482:542–546. doi: 10.1038/nature10806. doi:10.1038/nature10806. [DOI] [PMC free article] [PubMed] [Google Scholar]
- 30.Yokoyama A, et al. Leukemia proto-oncoprotein MLL forms a SET1-like histone methyltransferase complex with menin to regulate Hox gene expression. Mol Cell Biol. 2004;24:5639–5649. doi: 10.1128/MCB.24.13.5639-5649.2004. doi:10.1128/MCB.24.13.5639-5649.2004. [DOI] [PMC free article] [PubMed] [Google Scholar]
- 31.Caslini C, et al. Interaction of MLL amino terminal sequences with menin is required for transformation. Cancer Res. 2007;67:7275–7283. doi: 10.1158/0008-5472.CAN-06-2369. doi:10.1158/0008-5472.CAN-06-2369. [DOI] [PMC free article] [PubMed] [Google Scholar]
- 32.Thiel AT, Huang J, Lei M, Hua X. Menin as a hub controlling mixed lineage leukemia. Bioessays. 2012;34:771–780. doi: 10.1002/bies.201200007. doi:10.1002/bies.201200007. [DOI] [PMC free article] [PubMed] [Google Scholar]
- 33.Yokoyama A, et al. The menin tumor suppressor protein is an essential oncogenic cofactor for MLL-associated leukemogenesis. Cell. 2005;123:207–218. doi: 10.1016/j.cell.2005.09.025. doi:10.1016/j.cell.2005.09.025. [DOI] [PubMed] [Google Scholar]
- 34.Grembecka J, et al. Menin-MLL inhibitors reverse oncogenic activity of MLL fusion proteins in leukemia. Nat Chem Biol. 2012;8:277–284. doi: 10.1038/nchembio.773. doi:10.1038/nchembio.773. [DOI] [PMC free article] [PubMed] [Google Scholar]
- 35.Shi A, et al. Structural insights into inhibition of the bivalent menin-MLL interaction by small molecules in leukemia. Blood. 2012;120:4461–4469. doi: 10.1182/blood-2012-05-429274. doi:10.1182/blood-2012-05-429274. [DOI] [PMC free article] [PubMed] [Google Scholar]
- 36.Karatas H, et al. High-affinity, small-molecule peptidomimetic inhibitors of MLL1/WDR5 protein-protein interaction. Journal of the American Chemical Society. 2013;135:669–682. doi: 10.1021/ja306028q. doi:10.1021/ja306028q. [DOI] [PMC free article] [PubMed] [Google Scholar]
- 37.Karatas H, Townsend EC, Bernard D, Dou Y, Wang S. Analysis of the binding of mixed lineage leukemia 1 (MLL1) and histone 3 peptides to WD repeat domain 5 (WDR5) for the design of inhibitors of the MLL1-WDR5 interaction. Journal of medicinal chemistry. 2010;53:5179–5185. doi: 10.1021/jm100139b. doi:10.1021/jm100139b. [DOI] [PMC free article] [PubMed] [Google Scholar]
- 38.Grebien F, et al. Pharmacological targeting of the Wdr5-MLL interaction in C/EBP[alpha] N-terminal leukemia. Nat Chem Biol advance online publication. 2015 doi: 10.1038/nchembio.1859. doi:10.1038/nchembio.1859 http://www.nature.com/nchembio/journal/vaop/ncurrent/abs/nchembio.1859.html#supple mentary-information. [DOI] [PMC free article] [PubMed]
- 39.Lee KH, et al. A genomewide study identifies the Wnt signaling pathway as a major target of p53 in murine embryonic stem cells. Proc Natl Acad Sci U S A. 2010;107:69–74. doi: 10.1073/pnas.0909734107. doi:10.1073/pnas.0909734107. [DOI] [PMC free article] [PubMed] [Google Scholar]
- 40.Shah PP, et al. Lamin B1 depletion in senescent cells triggers large-scale changes in gene expression and the chromatin landscape. Genes Dev. 2013;27:1787–1799. doi: 10.1101/gad.223834.113. doi:10.1101/gad.223834.113. [DOI] [PMC free article] [PubMed] [Google Scholar]
- 41.Langmead B, Salzberg SL. Fast gapped-read alignment with Bowtie 2. Nat Methods. 2012;9:357–359. doi: 10.1038/nmeth.1923. doi:10.1038/nmeth.1923. [DOI] [PMC free article] [PubMed] [Google Scholar]
- 42.Senisterra G, et al. Small-molecule inhibition of MLL activity by disruption of its interaction with WDR5. The Biochemical journal. 2013;449:151–159. doi: 10.1042/BJ20121280. doi:10.1042/BJ20121280. [DOI] [PMC free article] [PubMed] [Google Scholar]
Associated Data
This section collects any data citations, data availability statements, or supplementary materials included in this article.