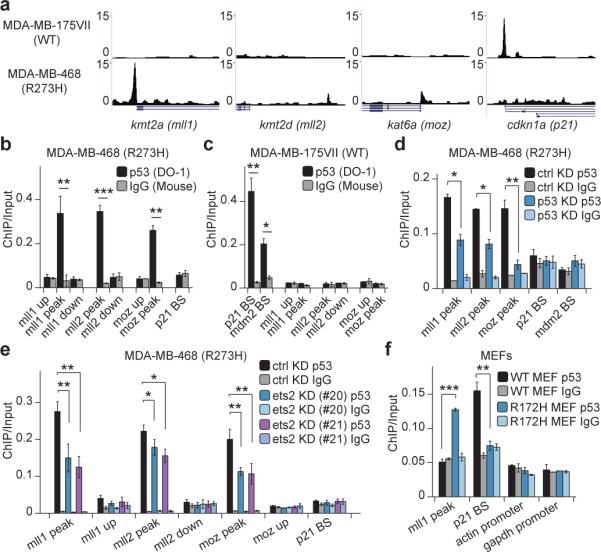
Figure 2. GOF p53 mutants directly target chromatin regulators.

a. Track views of p53 occupancy over promoter regions of mll1, mll2, moz and p21.
b, c. ChIP-qPCR showing p53 or IgG enrichment (ChIP/Input) in (b) MDA-MB-468 and (c) MDA-MB-175VII cells. BS: p53 binding site. Primer locations shown in Extended Data Fig. 4a.
d, e. ChIP-qPCR showing p53 enrichment changes upon (d) p53 or (e) ets2 knockdown. #20 and #21 denote two short hairpins, sequences of which are shown in Table S3.
f. ChIP-qPCR showing p53 or IgG enrichment in MEFs bearing p53 WT or R172H. (Error bars represent mean ± s.e.m., n=3. Two-tailed Student's t-test: *p<0.05; **p<0.01; ***p<0.001)
