. 2015 Aug 24;4:e08088. doi: 10.7554/eLife.08088

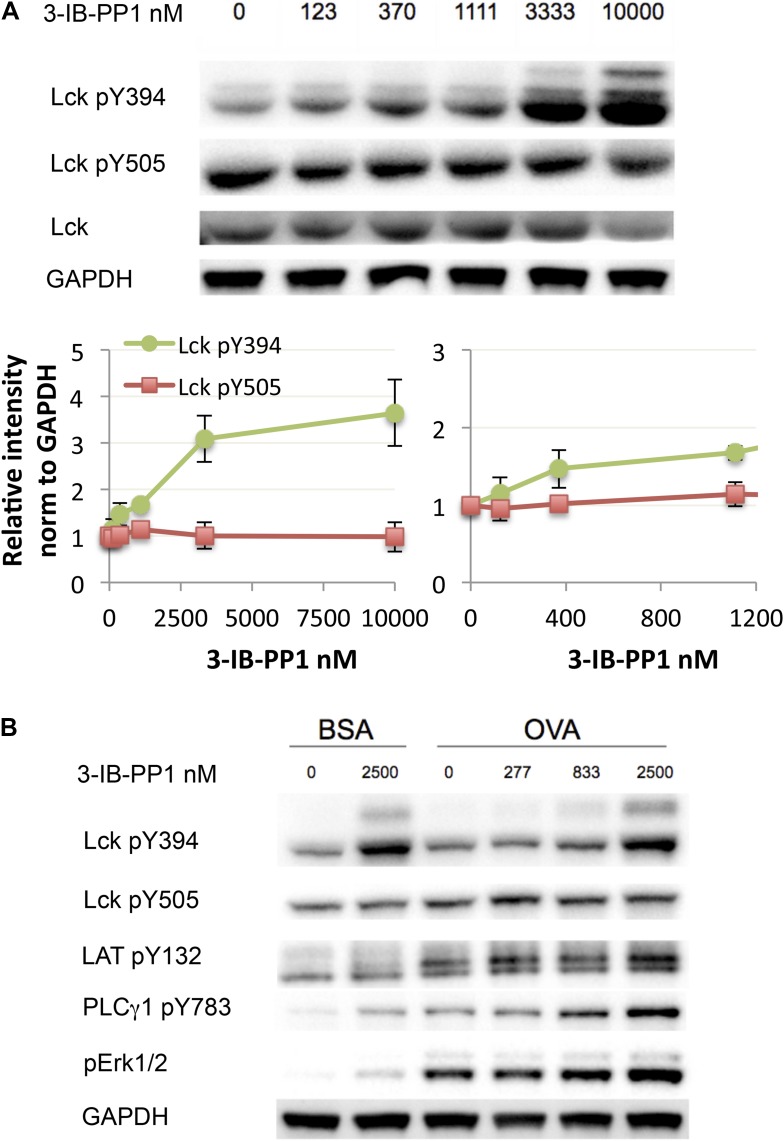
Figure 3. Weak Csk inhibition and Lck activation potentiate agonist signaling.

(A) CskAS CD8+ T cells were rested and stimulated with indicated doses of 3-IB-PP1 for 3 min, lysed, and immunoblotted for activating (pY394) and inhibitory (pY505) site Lck phosphorylation. Below is quantification (± sem) of three independent experiments immunoblot. (B) CskAS;OTI naive CD8+ T cells were rested, stimulated with bead-bound BSA or 10 μg/ml pMHC-OVA for 3 min, lysed and assayed by immunoblot. Data are representative of at least two independent experiments.

DOI: http://dx.doi.org/10.7554/eLife.08088.007

Figure 3.

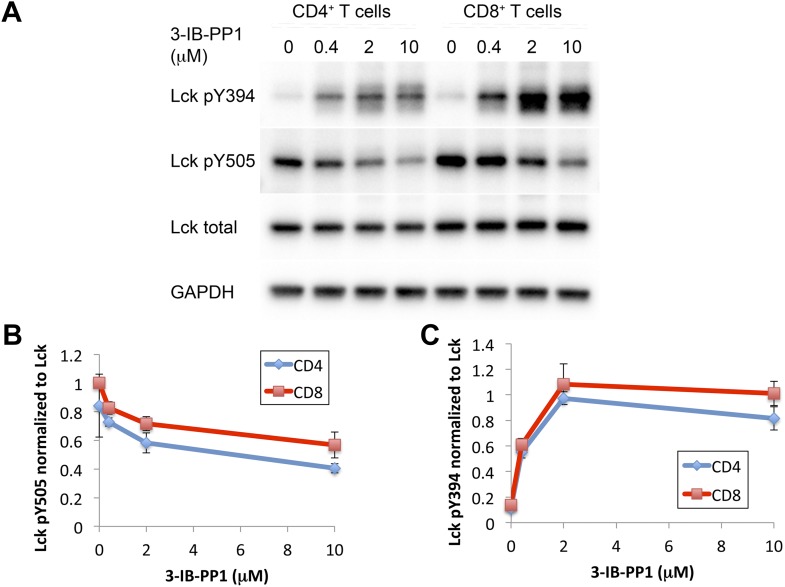
Figure 3—figure supplement 1. Comparison of Csk inhibition and Lck activation in CD4+ vs CD8+ T cells.

Figure 3—figure supplement 1.

(A) CskAS CD4+ and CskAS CD8+ T cells were rested and stimulated with indicated doses of 3-IB-PP1 or DMSO for 2 min and then lysed. Lysates were immunoblotted for activating (pY394) and inhibitory (pY505) site Lck phosphorylation, total Lck, and GAPDH (loading control). Data are representative of three independent experiments. (B, C) Quantification of Lck pY505 and Lck pY394 of three independent experiments (as in A), with levels normalized to Lck levels per cell type. Error bars are standard deviation.