Significance
The general public funds the vast majority of biomedical research and is also the major intended beneficiary of biomedical breakthroughs. We show that increasing research investments, resulting in an increasing knowledge base, have not yielded comparative gains in certain health outcomes over the last five decades. We demonstrate that monitoring scientific inputs, outputs, and outcomes can be used to estimate the productivity of the biomedical research enterprise and may be useful in assessing future reforms and policy changes. A wide variety of negative pressures on the scientific enterprise may be contributing to a relative slowing of biomedical therapeutic innovation. Slowed biomedical research outcomes have the potential to undermine confidence in science, with widespread implications for research funding and public health.
Keywords: biomedical research, health outcomes, innovation, research efficiency
Abstract
Society makes substantial investments in biomedical research, searching for ways to better human health. The product of this research is principally information published in scientific journals. Continued investment in science relies on society’s confidence in the accuracy, honesty, and utility of research results. A recent focus on productivity has dominated the competitive evaluation of scientists, creating incentives to maximize publication numbers, citation counts, and publications in high-impact journals. Some studies have also suggested a decreasing quality in the published literature. The efficiency of society’s investments in biomedical research, in terms of improved health outcomes, has not been studied. We show that biomedical research outcomes over the last five decades, as estimated by both life expectancy and New Molecular Entities approved by the Food and Drug Administration, have remained relatively constant despite rising resource inputs and scientific knowledge. Research investments by the National Institutes of Health over this time correlate with publication and author numbers but not with the numerical development of novel therapeutics. We consider several possibilities for the growing input-outcome disparity including the prior elimination of easier research questions, increasing specialization, overreliance on reductionism, a disproportionate emphasis on scientific outputs, and other negative pressures on the scientific enterprise. Monitoring the efficiency of research investments in producing positive societal outcomes may be a useful mechanism for weighing the efficacy of reforms to the scientific enterprise. Understanding the causes of the increasing input-outcome disparity in biomedical research may improve society’s confidence in science and provide support for growing future research investments.
Few forces have transformed society more than science. Knowledge gained through the scientific method has lifted billions out of poverty, fueled industrialization and mass communication, eradicated smallpox, and placed human footprints on the moon. During the 20th century, science was increasingly funded by governments and corporations vying for military and economic advantage. Furthermore, the realization that investments in biomedical research translated into medical advances garnered strong societal support for the expenditure of public funds to support science. Today, science is a vast industry producing new knowledge, usually to address particular problems or questions facing humankind. Like any industry, the scientific enterprise uses tools and resources—scientists, money, and time—to produce an output: scientific knowledge, which can be represented by publications in the scientific literature.
To remain competitive, corporations have long sought to maximize production efficiency, defined here as the ratio of output to input, by trimming waste and producing more (1). With increasing competition for research grants and jobs, funders and employers have turned to measures of efficiency and productivity to evaluate scientists (2). Such pressures have created well-documented incentives for scientists to maximize apparent productivity through publication numbers, citation counts, and publishing in high-impact journals (3, 4). Although this approach is designed to reward those who contribute most to the knowledge base, recent studies have raised questions about the quality of the biomedical literature (5–8). One such study found that only 11% of findings could be confirmed in 53 “landmark” hematology and oncology publications (6). Another study found that 43 of 67 published cardiovascular, oncological, and women’s health findings could not be reproduced (7). Recently, it was estimated that more than $28 billion is spent each year in the United States on irreproducible preclinical research and that the prevalence of these studies in the literature exceeds 50% (8). We note that this lack of reproducibility was identified by the National Institutes of Health (NIH) as a major problem and has led to initiatives for enhancing reproducibility and transparency (9). The irreproducibility of published data could potentially waste limited funding, years of work, and threatens to undermine public confidence in the scientific enterprise.
A pure focus on scientific outputs can ignore the quality of those outputs. This is partially due to the fact that the quality and importance of scientific publications, unlike most human products, is subjective and difficult to assess in the present (10, 11). The true measure of a study’s quality would involve time-consuming and costly independent replication and an analysis of the work’s outcomes, including assessing its downstream utility to other applications and its effects on society. However, given the length of time needed and low probability of any given study generating substantial societal impact, it is very difficult to judge individual scientists or their work using simple outcome measures. Valid scientific research can have tremendous intrinsic societal value in producing information without the need for tangible outcomes. However, we also assume that all valid scientific research has some probability of generating tangible outcomes, even though such outcomes can be unpredictable and distant in both time and subject matter. For example, the theory of general relativity proposed in 1916 did not produce a useful outcome to the public until the late 20th century, when it provided a means to account for differences in clock rates under different gravitational influences, thereby enabling the global positioning systems found in a majority of modern cell phones and vehicles (12). Despite the intrinsic social value of biomedical knowledge, it is evident that public agencies, such as the NIH, support biomedical research with outcome-oriented goals, including benefitting health, preventing disease, and increasing return on investment (13). Although it is impractical to measure the outcomes generated by individual researchers, we believe that it is possible to estimate the outcomes of the biomedical research enterprise. In contrast to the production-based definition of efficiency (outputs ÷ inputs), we believe that evaluating research outcomes relative to inputs can be used to monitor the efficiency of biomedical innovation and the impact of research investments. Without studying outcomes, there is no way of knowing if society’s investment in research is paying off, and there is no way of evaluating the efficacy of systemic modifications to the scientific enterprise.
Results
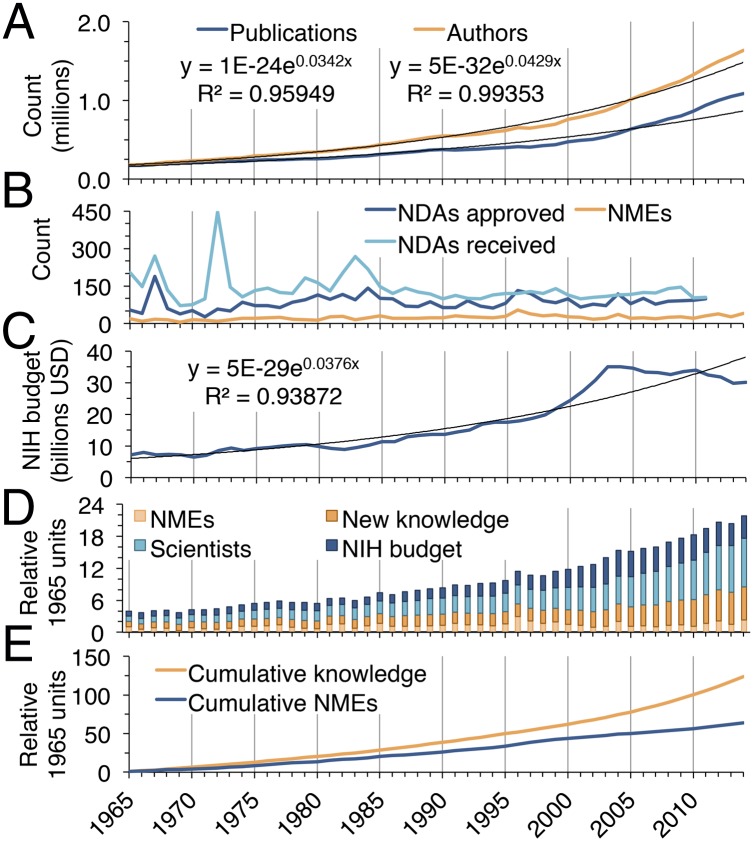
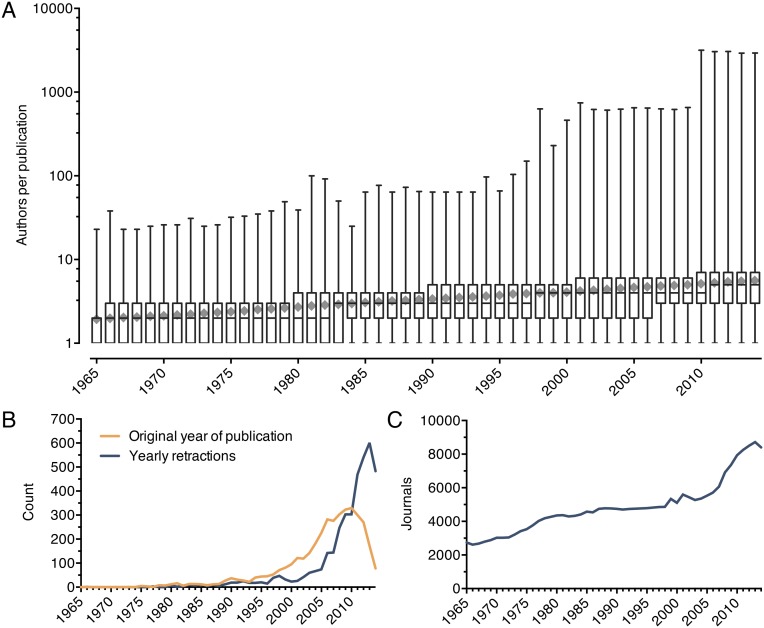
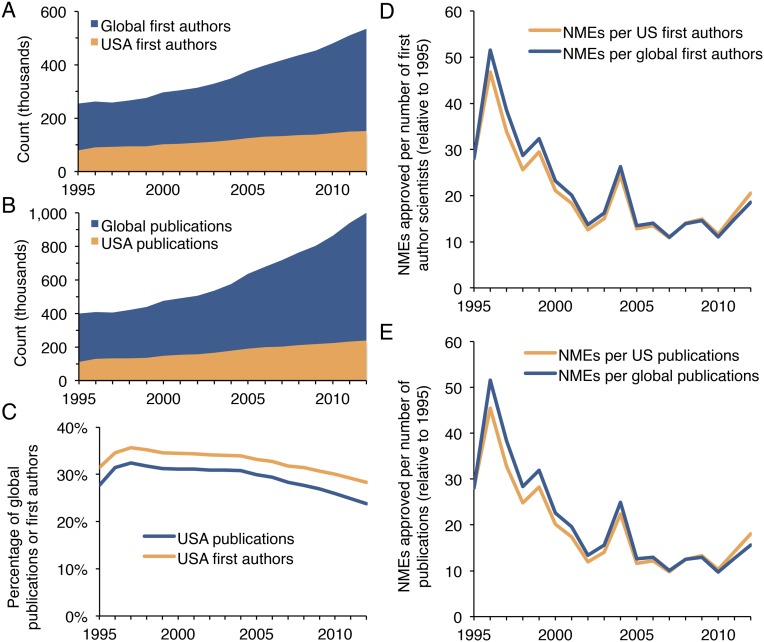
We used the annual number of PubMed publications to estimate total biomedical research output, whereas the number of uniquely named authors was used to estimate the number of contributing scientists. Both publication number and author number have risen exponentially since 1965 (Fig. 1A). PubMed now adds more than 1 million new biomedical publications annually, a 527% increase over 1965. The number of authors has risen even faster—809% since 1965—with more than 1.63 million individuals contributing in 2014. The pace of increasing authors is an underestimate, because many investigators share common names. Furthermore, the average number of authors per published manuscript in the PubMed database has more than doubled since 1965 (Fig. S1A). The number of retractions found in the literature has also risen rapidly since the late 1990s (Fig. S1B), as documented previously (14, 15). The number of scientific journals represented in PubMed has tripled since 1965 (Fig. S1C). The growth in US-affiliated publications and authors from 1995 to 2012 was substantial, but less than worldwide increases (Fig. S2). Furthermore, total biomedical knowledge is better approximated by the global increase in publications rather than publications affiliated with any particular nation.
Fig. 1.
Changing inputs, outputs, and outcomes in biomedical research from 1965 to 2014. (A) Yearly publication number and author number. (B) Yearly received and approved NDAs and approved NMEs. (C) The annual NIH budget, inflation-adjusted to 2014 dollars. (D) Yearly inputs, outputs, and outcomes in biomedical research are represented by NIH budget, author number, publication number, and number of approved NMEs. All categories are normalized to 1.0 for their respective levels in 1965. (E) Cumulative knowledge in the form of scientific publications since 1965 is compared with cumulative NMEs since 1965. Both publications and NMEs are normalized to 1.0 for their respective levels in 1965.
Fig. S1.
Authorship, retractions, and journals from 1965 to 2014. (A) Boxplots for each year show the minimum, interquartile range, median, and maximum number of authors per publication for all PubMed publications originating in that year. Gray diamonds show the mean number of authors per publication. (B) Retracted papers are plotted by their original publication year (orange) and by the year the retractions were made (blue). (C) The number of uniquely named journals with publications indexed in PubMed is shown from 1965 to 2014.
Fig. S2.
US-affiliated publications and authors from 1995 to 2012. (A) The growth in US-affiliated first authors is compared with the worldwide growth in first authors. (B) The growth in US-affiliated publications is compared with the worldwide growth in publications. (C) The proportion of worldwide publications and authors with US affiliations is plotted from 1995 to 2012. (D) Approved NMEs per number of first authors (relative to 1995) is compared between the US and worldwide. (E) Approved NMEs per number of publications (relative to 1995) is compared between the US and worldwide. Curves in D and E are not identical, but they appear similar at this scale due to the similar growth in publications and authors over time.
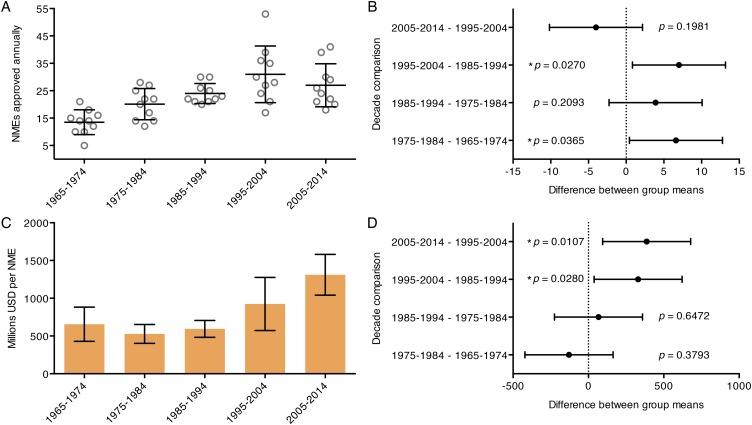
The number of New Molecular Entities (NMEs) approved by the Food and Drug Administration (FDA) was used to estimate the outcomes of the biomedical research enterprise (Fig. 1B). NMEs are defined as drugs containing active moieties, as either a single ingredient or as a combination product, that have not previously been approved by the FDA. Biologic products may be defined as NMEs for the purposes of FDA review even if a closely related moiety has previously been approved (16). NMEs are an attractive outcome measure because they are unequivocal indicators of progress in global biomedical research. NME approvals grew steadily each decade from 1965 to 2004 but regressed over the last 10 y (Fig. S3 A and B). Furthermore, the magnitude of growth observed in annual NME approvals was much smaller than the changes in author or publication number. The numbers of received and approved New Drug Applications (NDAs) have remained relatively constant (Fig. 1B), suggesting that the FDA’s ability to review applications is not a major limiting factor on new therapeutic approvals.
Fig. S3.
Annual NME approvals and costs by decade from 1965 to 2014. (A) The number of NMEs approved per year is plotted by decade from 1965 to 2014. Bars represent the mean and SD for each group. Decade means were significantly different from one another when compared using a standard one-way ANOVA (P < 0.0001). (B) Annual approved NMEs for each decade were compared with the subsequent decade using Fisher’s least significant difference test. The change in mean annual NMEs for each decade comparison is plotted with a 95% CI along with the respective P value. (C) The mean cost per NME, in millions of dollars of inflation-adjusted NIH budget, is shown by decade from 1965 to 2014. Error bars represent the SD. Decade means were significantly different from one another when the groups were compared using a standard one-way ANOVA (P < 0.0001). (D) Average cost per NME for each decade was compared with the subsequent decade using Fisher’s least significant difference test. The difference between the means for each comparison is plotted with a 95% CI along with the respective P value.
As the largest contributor to global biomedical research funds (17), the NIH budget (inflation-adjusted to 2014 dollars) was used as a proxy for total biomedical research funds (Fig. 1C). The budget rose exponentially from 1965 to 1999. Over the next 4 y, the budget doubled before a steady decrease occurred during 2003–2014, which is larger than apparent because of the rapidly rising cost of scientific experiments. The cost per NME, in millions of dollars of NIH budget, was compared for each decade from 1965 to 2014, and has grown rapidly since the mid-1980s (Fig. S3 C and D). When normalized to their 1965 values, NIH budget, author number, publication number, and number of approved NMEs enjoyed a combined 5.5-fold increase over the last 50 y (Fig. 1D). The greatest share of that growth occurred in the number of scientists (9.1-fold) and the number of publications (6.3-fold). NIH budget increased to a lesser extent (4.2-fold), whereas approved NMEs increased least of all (2.3-fold). Consequently, society’s acquisition of new knowledge through biomedical publications drastically outpaced the production of novel therapeutics by the biomedical research enterprise (Fig. 1E).
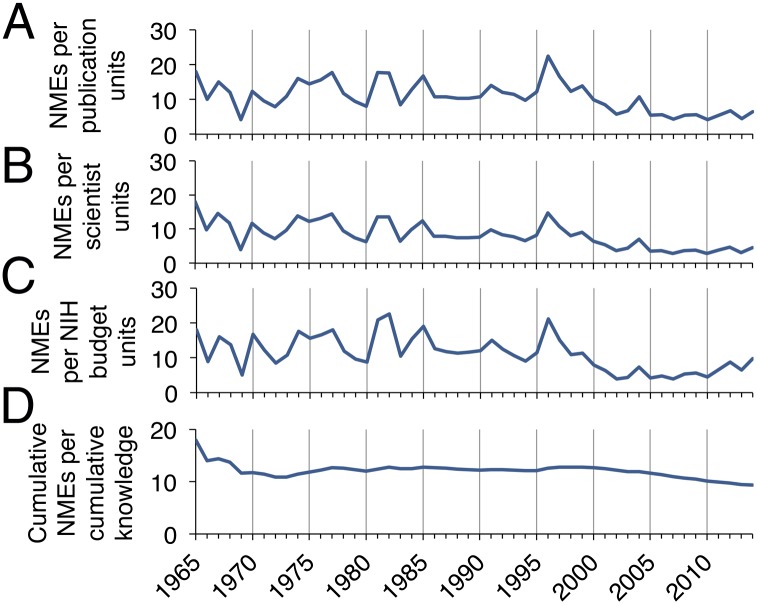
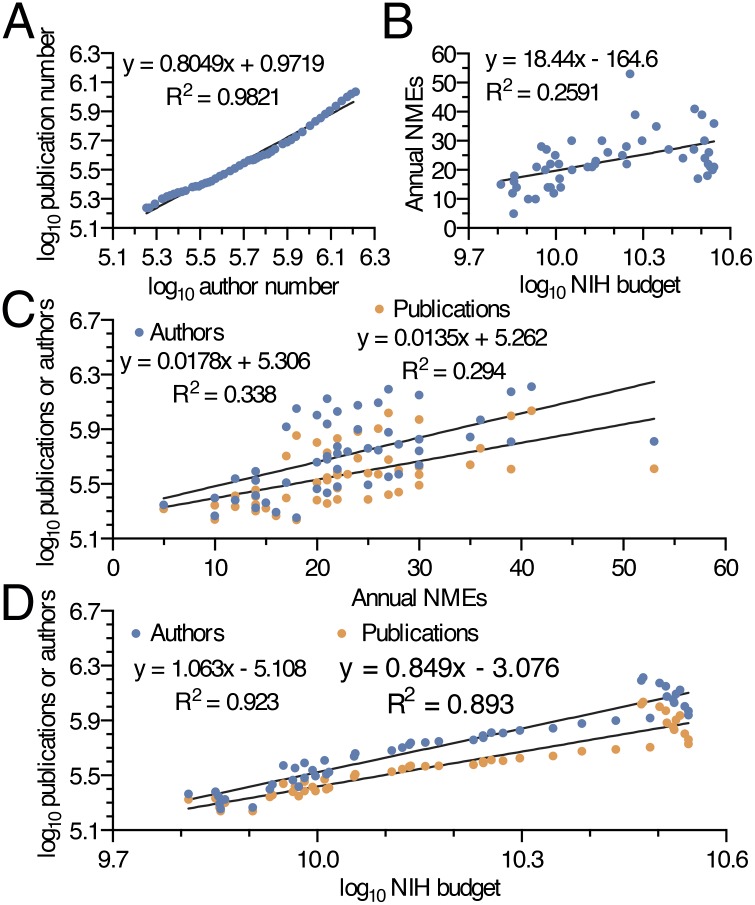
Biomedical research efficiency (outcomes ÷ input) was investigated by calculating approved NMEs each year per relative units of new scientific knowledge, yearly scientific authors, and yearly NIH funding (Fig. 2 A–C). Decreasing research efficiency from 2000 to 2014 is demonstrated by the drop in approved NMEs for each unit of personnel and financial input. Despite 2014 being the most productive year for novel therapeutics since 1996, the number of NMEs developed per billion dollars of NIH funding was 56% lower in 2000–2014 compared with 1965–1999. The same drop is evident in approved NMEs for each unit of published scientific knowledge, illustrating that increasing scientific outputs have not translated into new therapeutics in a proportional manner. Cumulative NMEs since 1965 divided by cumulative biomedical knowledge remained relatively constant from 1976 to 1999, followed by a marked decline through 2014 (Fig. 2D). As might be expected, the number of authors was highly correlated with the number of publications in a year (Fig. 3A). The number of NMEs produced in a given year, however, correlated very poorly with the resources and knowledge needed to develop them (Fig. 3 B and C). Finally, both author number and publication number had closer relationships to the NIH budget over the last 50 y than to NMEs (Fig. 3D).
Fig. 2.
Biomedical research efficiency measured by outcomes ÷ outputs and outcomes ÷ inputs. (A–C) NMEs produced each year divided by yearly units of new knowledge (A), scientific authors (B), and NIH funding (C) relative to 1965 levels. (D) The cumulative number of NMEs produced since 1965 divided by cumulative biomedical knowledge generated since 1965.
Fig. 3.
Correlations between authors, NMEs, NIH budget, and publication numbers from 1965 to 2014. NIH budget, author number, and publication number are plotted in log base 10. (A) Log-log plot of publication vs. author number. (B) Plot of NMEs vs. NIH budget. (C) Plot of publication number and author number vs. NMEs. (D) Plot of publication and author number vs. the NIH budget.
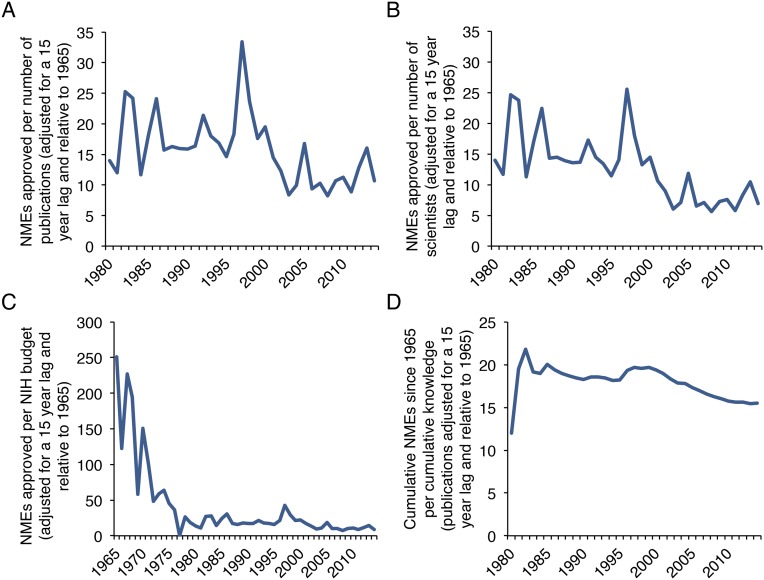
Because discovery takes time to translate into products, we investigated whether the observed effect was due to a growing time lag between these two events. To estimate the time between discovery and product, we analyzed 12 examples of medical breakthroughs resulting from 11 key scientific discoveries during the last century (Table S1). The translation lag time between discovery and implementation was between 10 and 14 y for most discoveries and did not increase with more recent examples. Although this retrospective analysis suffers from selection bias in choosing ultimately productive scientific discoveries, it does provide an estimate for bench-to-bedside translation time. Other more systematic studies have found longer translational lag times, but did not indicate that these lags have increased (18, 19). The observed declines in research efficiency did not change even when approved NMEs per units of new scientific knowledge and yearly scientific authors were adjusted with a discovery to product translation lag of 15 y (Fig. S4 A, B, and D). Research efficiency followed an even sharper decline when the NIH budget was adjusted with a 15-y translation lag (Fig. S4C).
Table S1.
Lag times between major scientific discoveries and their resulting clinical implementations
| Scientific advance | Year | Clinical Implementation | Year | Lag (y) | References |
| Levothyroxine was first synthesized | 1926 | Introduction of synthetic levothyroxine therapy | 1958 | 32 | 60, 61 |
| Discovery of penicillin | 1928 | Pharmaceutical production and use of penicillin to treat patients | 1942 | 14 | 62, 63 |
| Discovery of α and β adrenergic receptors | 1948 | Propranolol is approved as the first β-blocker | 1965 | 17 | 64, 65 |
| First example of one-dimensional MRI | 1952 | First use of 3D MRI to obtain clinical information on a patient | 1980 | 28 | 66, 67 |
| Australia antigen recognized to be part of the virus causing hepatitis B | 1968 | First hepatitis B vaccine approved | 1981 | 13 | 68, 69 |
| Angiotensin-converting enzyme inhibitors characterized from snake venom | 1971 | The first ACE inhibitor is approved by the FDA (captopril) | 1981 | 10 | 70, 71 |
| Development of recombinant DNA technology | 1972 | Human insulin, the first drug produced through recombinant DNA technology, is approved | 1982 | 10 | 72, 73 |
| Production of monoclonal antibodies | 1975 | Approval of the first therapeutic monoclonal antibody (Muromonab-CD3) | 1986 | 11 | 74, 75 |
| Cholesterogenesis inhibitors discovered in a fungal culture | 1976 | Lovastatin is approved for prescription use | 1987 | 11 | 76 |
| HIV identified as causative agent of AIDS | 1984 | AZT is the first drug approved for treatment of HIV | 1987 | 3 | 77, 78 |
| The first instance of HAART is described in the literature | 1996 | 12 | |||
| PD-1 pathway implicated in escape of tumor cells from immune system | 2002 | Keytruda is approved as the first cancer therapy targeting PD-1 | 2014 | 12 | 79, 80 |
Examples of scientific breakthroughs are listed chronologically with their resulting clinical applications and associated translation lag time. Gaps between discovery and implementation are mostly in the 10- to 14-y range with several outliers in either direction. ACE, angiotensin-converting enzyme; AZT, azidothymidine; HAART, highly active antiretroviral therapy.
Fig. S4.
Translation lag-adjusted biomedical research efficiency, as measured by outcomes ÷ outputs and outcomes ÷ inputs. Publication number, scientist number, and NIH budget are adjusted with a translation lag of 15 y. (A–C) NMEs produced each year divided by translation lag-adjusted units of new knowledge (A), scientific authors (B), and NIH funding (C) relative to 1965 levels. (D) The cumulative number of NMEs produced since 1980 divided by translation lag-adjusted cumulative biomedical knowledge is shown from 1980 to 2014.
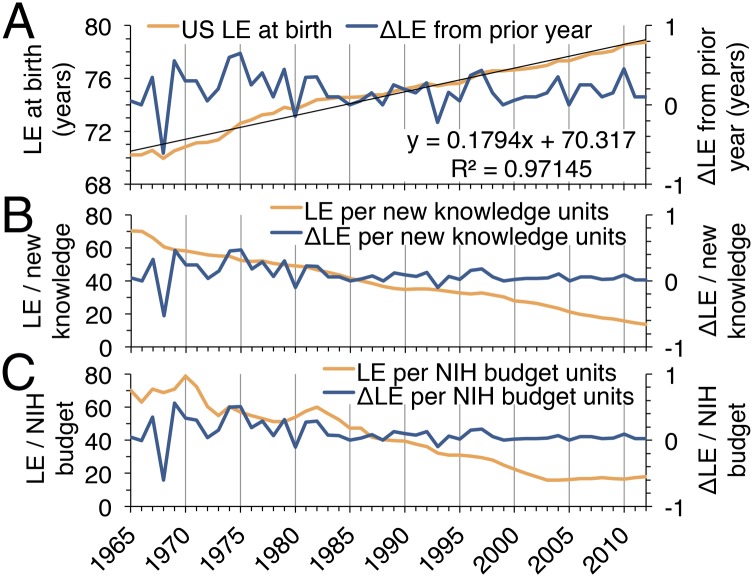
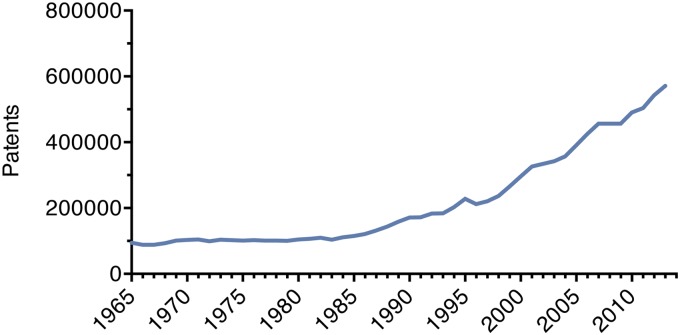
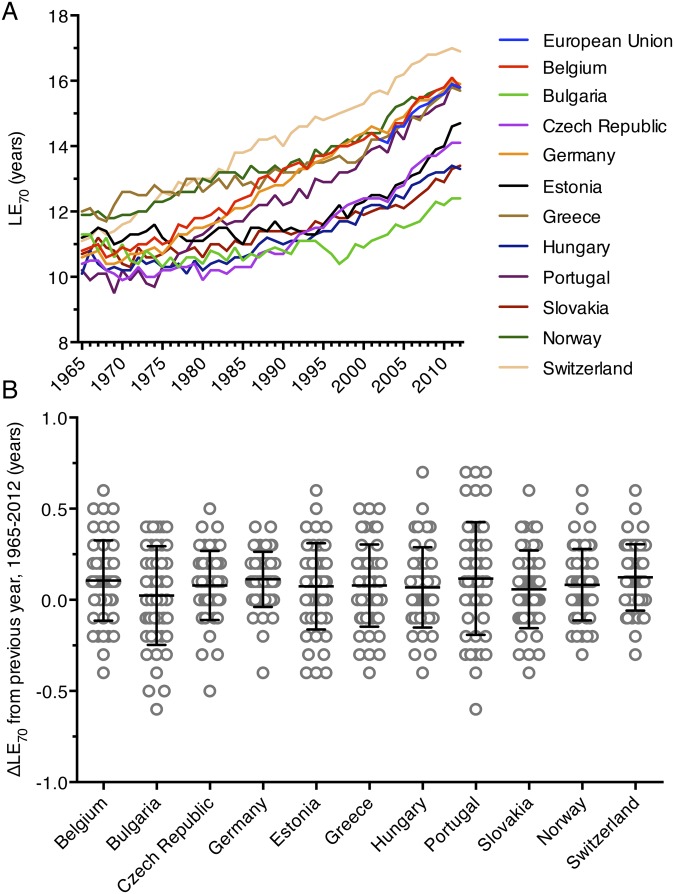
Despite being affected by many factors other than biomedical research, we explored life expectancy and patent applications as alternative outcome and output measures. US life expectancy at birth rose linearly from 1965 to 2012 with an average yearly growth of slightly more than 2 mo (Fig. 4A). Patent applications in the United States increased 504% since 1965, similar to the 527% growth that was observed in publication number (Fig. S5). We used these alternative outcome and output measures to track biomedical research efficiency over time. Dividing life expectancy (LE) and the yearly change in life expectancy (ΔLE) by the output measure of biomedical publication number (Fig. 4B) showed a steady decline. A similar drop in research efficiency is evident when LE and ΔLE per unit of NIH funding is followed over time (Fig. 4C). Many major medical breakthroughs in recent decades have been targeted to diseases affecting older patient populations. To determine whether life expectancy has risen faster in older populations, we examined the life expectancy at age 70 (LE70) of 11 European nations from 1965 to 2012 and the European Union from 2002 to 2012. All LE70 measurements increased linearly, following the pattern of US LE at birth (Fig. S6A). Furthermore, the 11 analyzed European nations experienced an average yearly increase in LE70 of less than 1.5 mo from 1965 to 2012 (Fig. S6B). This result indicates that life expectancy gains among older populations have also not kept pace with rising biomedical research inputs and outputs.
Fig. 4.
Alternative measures of biomedical research efficiency from 1965 to 2012. (A) Mean US life expectancy at birth (LE, blue line) and the yearly change in life expectancy (ΔLE, orange line). (B and C) LE and ΔLE for each divided by that year’s biomedical research publications (B) and NIH budget (C). ΔLE curves in B and C are not identical, but they appear similar at this scale due to the small differences between them.
Fig. S5.
Patent applications as an alternative output measure. Total utility patent applications filed in the United States are shown from 1965 to 2013.
Fig. S6.
Growth in life expectancy at age 70. (A) Life expectancy at age 70 (LE70) is shown from 1965 to 2012 for 11 European nations along with data from the European Union from 2002 to 2012. (B) The yearly change in LE70 (ΔLE70) from 1965 to 2012 is plotted for the 11 analyzed European nations. Horizontal bars represent the mean ΔLE70, whereas error bars represent the SD.
Discussion
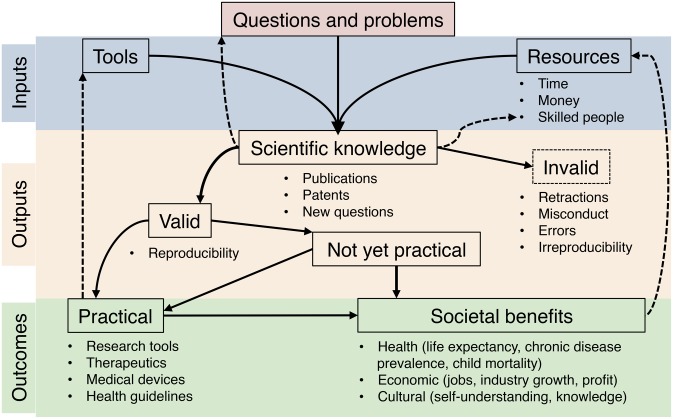
The data presented above suggest an increasing disparity between resource inputs and outcomes in biomedical research. To visualize the relationship between scientific inputs, outputs, and outcomes, we constructed a scheme showing the flow of resources within the biomedical research enterprise (Fig. S7). Increasing resource investments have led to an explosion in scientific knowledge, but the resulting gains in new therapies and improved human health have been proportionally smaller, as measured by NMEs and prolongation of life expectancy. Several possible causes for slowed growth in biomedical research outcomes are considered.
Fig. S7.
A schematic representation of inputs, outputs, and outcomes of biomedical research. The biomedical research enterprise is self-reinforcing as the number of research tools, skilled scientists, and job opportunities all grow with new discoveries. Basic research without immediate practicality has led to some of history’s most impactful discoveries, and it is impossible to predict the long-term outcomes of most basic research. A limitation of this study is the difficulty in quantifying the benefits of basic research that have yet to translate into useful applications. Invalid scientific research can be considered a drain on the entire system by funneling limited resources into perceived outputs that fail to translate to outcomes. Certain practical outcomes, such as new therapeutics and research tools, are easier to quantify than more general societal benefits, which are influenced by many variables.
First, the problems could have become more difficult through prior elimination of easier research questions or the challenge of producing therapies that are better than current standards of care (20). This possibility could account for a decreasing marginal impact of new biomedical innovations. Increasing regulatory requirements over the last half-century—generally in the interest of public safety—have undoubtedly placed larger financial and temporal burdens on the development of new therapies. Furthermore, as scientists now spend nearly half of their time on administrative tasks, they are able to devote less time to research and training responsibilities (21). Other economic factors, such as the recent proliferation of patent trolls (22), may have also contributed to a stifling of biomedical innovation. Additionally, society has seen a shift from acute to chronic illnesses, and the development of therapies for chronic illnesses may be inherently more difficult. We note that improving health outcomes in chronic patients often requires prolonged and coordinated medical care. It is possible that the current health care delivery system and public health policies are not optimally aligned to today’s foremost medical problems.
Second, biomedical research findings may be accurate, but many have little immediate clinical relevance. In this regard, mice are widely used for biomedical discovery, but this species may not accurately predict human outcomes (23). Similarly, reliance on cell lines for basic discovery has many limitations including the facts that experiments may not reflect tissue conditions and that many cell lines are not authenticated or are contaminated (24, 25). A “brute-force bias” in pharmaceutical research and development has been attributed as a likely reason for stagnant NME approvals (20). This bias is manifested by an increasing dependence on high-throughput screening in highly simplified, automated systems for very specific molecular effects (i.e., high affinity binding to a target). A corollary to this bias is the assumption that more funding will directly translate into more drug candidates. Although such reductionist approaches have facilitated the analysis of enormous candidate drug libraries, there is evidence that techniques used decades ago may have been more effective at identifying clinically relevant molecules (20). While a focus on reductionism has greatly expanded our knowledge of biology’s most basic components, the extent to which this applies to complex biological networks is not clear. Specialization in science has also grown with the expansion of the scientific knowledgebase, increasing the necessity of technical collaboration (26). The mean number of authors per PubMed publication has grown from 1.94 to 5.61 since 1965, suggesting that more collaboration is now necessary (Fig. S1A). We note that there is some evidence that increasing authorship may reflect inflationary practices more so than research complexity or collaboration (27). Specialization may also raise barriers to interfield collaboration and cause pertinent findings or techniques to be overlooked by scientists in disparate fields.
A third possibility is that the quality of the scientific literature has decreased. Several articles illustrate a recent surge in retracted publications and widespread irreproducibility in the literature (5–8, 14, 15). The high prevalence of irreproducible research likely reflects the use of highly specialized techniques, the incomplete publication of methods, the failure to share necessary reagents or software, poor experimental design, and the bias toward publication of positive results. A recent study of error in retracted publications suggests that many erroneous findings remain uncorrected in the literature, creating the possibility for friction in the discovery process as scientists are distracted by invalid leads and/or spend time investigating and correcting published errors (28). Common commercial products such as research antibodies suffer from batch-to-batch variability, uncharacterized cross-reactivity, and protocol-specific changes in binding specificity (29). We also note that the documented growth of retracted and irreproducible research likely reflects a combination of increased prevalence and surveillance of problematic manuscripts and science (15). Irreproducible, incorrect, and falsified results in the literature can all contribute to inefficiencies in the process of scientific discovery. The incidence of these publications may be linked to the use of scientific outputs as metrics for the competitive evaluation of scientists (3, 4). We note that certain metrics are easier to game than others, and thus the use of less-pliable scientific output measures may lead to a decline in inappropriate incentives (30). It is also not known whether the use of such metrics might concurrently affect the creativity and work ethic of scientists. Behavioral research has indicated that task-based incentives tend to increase productivity, but with little impact on creative work (31). Finally, the current mania for publishing science in high-impact factor journals delays the publication of key findings as scientists shop for high-impact venues and may be creating perverse incentives that affect outcomes because high-impact science does not necessarily imply high importance (4).
We suspect that slowed biomedical outcomes growth is the result of some combination of the problems detailed above. Suggested remedies to these problems include reforms that could ease the regulatory hurdles for new therapeutics (11, 32), reduce administrative burdens (32), improve the clinical relevance of reductionist biomedical techniques (20), shift incentives away from scientific outputs (3, 4), encourage the publication of negative results (33), mandate public access to government-funded research results and methods (34), facilitate independent reproduction of important studies (35), and/or create a framework for measuring the outcomes of biomedical research (11, 36). A simple focus on boosting any given biomedical research metric, such as the number of approved NMEs, is not likely to solve the problem of slowed outcomes, but may instead contribute to misdirected incentives. To address the systemic problems detailed in this manuscript, it will be essential to consider each of the possible problems and their respective solutions in relation to the entire biomedical research enterprise and the culture of science. However, for policy changes to have the desired effect, they will need to be tested experimentally and that may require the development of new tools to measure the efficiency of science. Efforts to reduce the disparity between biomedical research inputs and outputs and their eventual societal outcomes will likely require a variety of reforms on the part of individual scientists, academic institutions, private corporations, and governmental entities (37, 38).
We acknowledge that any link between biomedical innovations and overall life expectancy is controversial, with many other factors—including political stability, food production, hygiene, education, income, transportation, and communication—potentially having greater impact. However, these factors are more likely to affect developing regions, and for both the United States and Europe, political stability, abundant food, adequate hygiene, and developed communication and transportation networks were available and stable during the time of our study. In this regard, long-term linear mortality reduction may be the result of increasing public health and biomedical resources combined with their decreasing marginal effectiveness (39). Other studies have attributed decreases in disease-specific mortality to certain biomedical innovations (40, 41). A key limitation of these analyses is the difficulty in appropriating patient outcomes that result from a given clinical innovation to the initial funding of many underlying basic research advances. Even in the face of sluggish therapeutic development and constant life expectancy gains, biomedical innovations over the last 50 y have transformed many individual fields, including imaging, criminology, the treatment of some cancers, and HIV/AIDS (40, 42–44). It is also possible that the exponential growth in research investment and scientific knowledge over the previous five decades has simply not yet grown fruit and that a deluge of medical cures are right around the corner, a development that would make us extremely happy. One explanation for such a possibility is humanity’s relatively recent development of the necessary technology to generate and manipulate vast quantities of data coupled with inadequate tools to analyze and make use this of data.
Our results are best interpreted as a cautionary tale that will hopefully motivate new efforts to understand the parameters that influence the efficiency of science and its ability to translate discovery into practical applications. Considering that humanity is currently facing numerous challenges such as climate change, emerging infectious diseases, environmental degradation, and a faltering green revolution, each of which requires scientific advances to provide new solutions, it is essential for science to function at its best. Science’s power to influence society has historically resided in its ability to reliably predict phenomena and improve human lives. A worrisome consequence of the growing input-outcome disparity in biomedical research may be an erosion of society’s trust in the scientific enterprise at a time when science and its findings are often under attack (45, 46), with wide-ranging consequences for public health and future research funding. In support of this concern we note that the number of NMEs flattened from 2004 to 2014, a decade when the NIH budget decreased in real terms. Nevertheless, we are hopeful that the scientific community can use this information to adopt measures that improve the efficiency of the scientific enterprise. The ongoing motivation of scientific research should continually refocus to mirror its historical objectives: making discoveries that expand human knowledge and generating outcomes that positively impact humanity.
Methods
PubMed Data Retrieval.
The PubMed search engine can be used to access the most comprehensive aggregation of global biomedical literature, which contains more than 23 million records and is maintained by the NIH and the US National Library of Medicine (47). An algorithm was written in Perl to query PubMed for all citations per year from 1809 to 2014. All citations with “journal article” publication type were downloaded in MEDLINE format and parsed according to documented field descriptors (48). Unique journal names were determined from the “journal title” data field. Unique author names were determined from the “author” data field, which includes last name, first and middle initials, and a suffix, if applicable. Corporate or group authors were excluded from this analysis. The author count based on distinct names in the database represents a low estimate of the true number of authors because scientists that share a common name are counted as one. Additionally, PubMed limited the maximum author number in its MEDLINE records to 10 per publication from 1984 to 1995 and then to 25 per publication from 1996 to 1999, which further contributes to an undercounting of scientists (48). Yearly publication number was calculated as the number of PubMed citations with at least one individual author. Retracted publications were counted by original year of publication and also by year of retraction. Retraction data were gathered by automatically querying PubMed each year for “retracted publication” and “retraction of publication” publication types.
To gather data on publications and authors arising from the United States, we performed the same analysis as described above but added “USA” affiliation as a search constraint. Affiliation details were only recorded in PubMed citations for first authors from 1988 to 2013. The designation USA was added to author affiliations arising from the United States starting in 1995, and quality control of this field ceased during 2013 to facilitate affiliation details being added for all authors (48). Therefore, our analysis was limited to 1995–2012 and underestimates both the number of US scientists and publications with contributions from US scientists. We compared the number of USA-affiliated first authors to the global number of first authors during the same time period (Fig. S2). PubMed data presented in this manuscript was gathered on March 7, 2015 and reflects the PubMed database as of this date. PubMed’s records do not comprehensively cover the biomedical literature before 1965, so this was chosen as the starting year for most of our analyses. The Perl script and raw data used in this analysis are available and annotated at https://github.com/bowenanthony/biomedical-outcomes.
NIH Investment Data.
For the purposes of this study, the NIH budget was used as an estimate for the annual investment of public funds in the biomedical research enterprise. NIH budget appropriations from 1938 to 2014 were obtained (49, 50) and inflation adjusted to 2014 dollars using the annual average Consumer Price Index (51). Although the NIH is responsible for a fraction of worldwide biomedical research funds, it is the largest public sector contributor by far (17) and has an easily accessible and comprehensive budget history. Including private sector investments and other national research budgets would make year-to-year comparisons over the last five decades prohibitively difficult. Furthermore, including additional sources of private or public biomedical research funds would only increase the input-outcome disparities presented in this article because the NIH funds are just a portion of worldwide investment. It can also be argued that much of the innovation in the private sector is based on the discoveries of government-funded research, presumably because governments are able to take on greater risk than corporations (52).
Research Outcomes Data.
The long-term outcomes of biomedical research on human health and the economy are difficult to quantify due to numerous confounding variables. Therefore, NMEs approved by the FDA were used to estimate the relative yearly outcomes of the biomedical research enterprise. The number of received and approved NDAs and approved NMEs from 1938 to 2014 were obtained from the FDA (53, 54). From 2004 to 2014, these data include Biologic License Applications and approved biological products. Because the United States is the largest market for drug manufacturers (55), most new therapeutics eventually make their way to the FDA’s approval pipeline. We acknowledge that some NMEs, known as “me too drugs” are generated by making minor changes to existing therapeutics, creating compounds with little to no benefit over the original medication (56). Removing such “me too drugs” from our analysis, however, would be somewhat subjective and would only worsen the problem of slowed biomedical research outcomes. Although some NMEs have a much greater impact than others on health outcomes, it is very difficult to quantify the disease-specific outcomes of each NME. Additionally, a comparison of NME-related health outcomes over time would likely overvalue older therapeutics due to the time required for drugs to impact population health and also because new uses for existing drugs are often discovered over time. We recognize that much of the yearly NIH investment in biomedical research does not go directly to creating novel therapeutics. Funds spent on the development of new research tools and new uses for existing therapeutics are not represented by NMEs, but quantifying outcomes of this research is difficult. Additionally, a large part of the NIH budget funds basic research with the potential for long-term utility but no immediate impact on human health. For the purpose of this analysis we assume that all valid contributions to the cumulative scientific knowledgebase have some probability of future therapeutic utility. We also assume that the rate of NME approval is proportional to the rate of overall outcomes in biomedical science.
Alternative Measures.
The products of biomedical research are embodied by more than new pharmaceuticals on the market and peer-reviewed scientific publications. To address this, we examined the average US life expectancy at birth as an outcome measure and the number of utility patent applications in the US as an output measure. Data for these measures from 1965 to 2012 were obtained from the World Bank and the US Patent and Trademark Office (57, 58). Patent application numbers reflect utility patents and exclude design patents. We also recognize that many medical advances throughout the last several decades have targeted illnesses present in older patient populations and therefore might be better represented by measuring life expectancy at age 70. Because these data were not readily available for the United States, life expectancy at age 70 was obtained from Eurostat for 11 European nations with comprehensive data from 1965 to 2012 and for the European Union from 2002 to 2012 (59).
Acknowledgments
We thank our colleagues for comments on this manuscript. A.B. was supported by National Institutes of Health (NIH) Grant T32 GM007288, and A.C. was supported in part by NIH Grant R37 AI033142.
Footnotes
The authors declare no conflict of interest.
This article is a PNAS Direct Submission.
Data deposition: The data provided here can be found at https://github.com/bowenanthony/biomedical-outcomes.
This article contains supporting information online at www.pnas.org/lookup/suppl/doi:10.1073/pnas.1504955112/-/DCSupplemental.
References
- 1.Witzel M. A short history of efficiency. Bus Strateg Rev. 2002;13(4):38–47. [Google Scholar]
- 2.Hirsch JE. An index to quantify an individual’s scientific research output. Proc Natl Acad Sci USA. 2005;102(46):16569–16572. doi: 10.1073/pnas.0507655102. [DOI] [PMC free article] [PubMed] [Google Scholar]
- 3.Brembs B, Button K, Munafò M. Deep impact: Unintended consequences of journal rank. Front Hum Neurosci. 2013;7:291. doi: 10.3389/fnhum.2013.00291. [DOI] [PMC free article] [PubMed] [Google Scholar]
- 4.Casadevall A, Fang FC. Causes for the persistence of impact factor mania. MBio. 2014;5(2):e00064–e14. doi: 10.1128/mBio.00064-14. [DOI] [PMC free article] [PubMed] [Google Scholar]
- 5.Ioannidis JPA. Why most published research findings are false. PLoS Med. 2005;2(8):e124. doi: 10.1371/journal.pmed.0020124. [DOI] [PMC free article] [PubMed] [Google Scholar]
- 6.Begley CG, Ellis LM. Drug development: Raise standards for preclinical cancer research. Nature. 2012;483(7391):531–533. doi: 10.1038/483531a. [DOI] [PubMed] [Google Scholar]
- 7.Prinz F, Schlange T, Asadullah K. Believe it or not: How much can we rely on published data on potential drug targets? Nat Rev Drug Discov. 2011;10(9):712. doi: 10.1038/nrd3439-c1. [DOI] [PubMed] [Google Scholar]
- 8.Freedman LP, Cockburn IM, Simcoe TS. The economics of reproducibility in preclinical research. PLoS Biol. 2015;13(6):e1002165. doi: 10.1371/journal.pbio.1002165. [DOI] [PMC free article] [PubMed] [Google Scholar]
- 9.Collins FS, Tabak LA. Policy: NIH plans to enhance reproducibility. Nature. 2014;505(7485):612–613. doi: 10.1038/505612a. [DOI] [PMC free article] [PubMed] [Google Scholar]
- 10.Casadevall A, Fang FC. Important science: It’s all about the SPIN. Infect Immun. 2009;77(10):4177–4180. doi: 10.1128/IAI.00757-09. [DOI] [PMC free article] [PubMed] [Google Scholar]
- 11.Bornmann L. Measuring the societal impact of research: Research is less and less assessed on scientific impact alone—We should aim to quantify the increasingly important contributions of science to society. EMBO Rep. 2012;13(8):673–676. doi: 10.1038/embor.2012.99. [DOI] [PMC free article] [PubMed] [Google Scholar]
- 12.Ashby N. Relativity in the global positioning system. Living Rev Relativity. 2003;6(1):1–42. doi: 10.12942/lrr-2003-1. [DOI] [PMC free article] [PubMed] [Google Scholar]
- 13.National Institutes of Health 2013 Mission. Available at perma.cc/H7EP-F42S. Accessed June 7, 2015.
- 14.Fang FC, Steen RG, Casadevall A. Misconduct accounts for the majority of retracted scientific publications. Proc Natl Acad Sci USA. 2012;109(42):17028–17033. doi: 10.1073/pnas.1212247109. [DOI] [PMC free article] [PubMed] [Google Scholar]
- 15.Steen RG, Casadevall A, Fang FC. Why has the number of scientific retractions increased? PLoS One. 2013;8(7):e68397. doi: 10.1371/journal.pone.0068397. [DOI] [PMC free article] [PubMed] [Google Scholar]
- 16.US Food and Drug Administration 2015 New drugs at FDA: CDER’s New Molecular Entities and New Therapeutic Biological Products. Available at perma.cc/Z8LX-3Q9E. Accessed March 6, 2015.
- 17.Chakma J, Sun GH, Steinberg JD, Sammut SM, Jagsi R. Asia’s ascent--global trends in biomedical R&D expenditures. N Engl J Med. 2014;370(1):3–6. doi: 10.1056/NEJMp1311068. [DOI] [PubMed] [Google Scholar]
- 18.Contopoulos-Ioannidis DG, Alexiou GA, Gouvias TC, Ioannidis JPA. Medicine. Life cycle of translational research for medical interventions. Science. 2008;321(5894):1298–1299. doi: 10.1126/science.1160622. [DOI] [PubMed] [Google Scholar]
- 19.Contopoulos-Ioannidis DG, Ntzani E, Ioannidis JPA. Translation of highly promising basic science research into clinical applications. Am J Med. 2003;114(6):477–484. doi: 10.1016/s0002-9343(03)00013-5. [DOI] [PubMed] [Google Scholar]
- 20.Scannell JW, Blanckley A, Boldon H, Warrington B. Diagnosing the decline in pharmaceutical R&D efficiency. Nat Rev Drug Discov. 2012;11(3):191–200. doi: 10.1038/nrd3681. [DOI] [PubMed] [Google Scholar]
- 21.Barham BL, Foltz JD, Prager DL. Making time for science. Res Policy. 2014;43(1):21–31. [Google Scholar]
- 22.Ledford H. Congress seeks to quash patent trolls. Nature. 2015;521(7552):270–271. doi: 10.1038/521270a. [DOI] [PubMed] [Google Scholar]
- 23.Seok J, et al. Inflammation and Host Response to Injury, Large Scale Collaborative Research Program Genomic responses in mouse models poorly mimic human inflammatory diseases. Proc Natl Acad Sci USA. 2013;110(9):3507–3512. doi: 10.1073/pnas.1222878110. [DOI] [PMC free article] [PubMed] [Google Scholar]
- 24.Domcke S, Sinha R, Levine DA, Sander C, Schultz N. Evaluating cell lines as tumour models by comparison of genomic profiles. Nat Commun. 2013;4:2126. doi: 10.1038/ncomms3126. [DOI] [PMC free article] [PubMed] [Google Scholar]
- 25.Geraghty RJ, et al. Cancer Research UK Guidelines for the use of cell lines in biomedical research. Br J Cancer. 2014;111(6):1021–1046. doi: 10.1038/bjc.2014.166. [DOI] [PMC free article] [PubMed] [Google Scholar]
- 26.Casadevall A, Fang FC. Specialized science. Infect Immun. 2014;82(4):1355–1360. doi: 10.1128/IAI.01530-13. [DOI] [PMC free article] [PubMed] [Google Scholar]
- 27.Papatheodorou SI, Trikalinos TA, Ioannidis JPA. Inflated numbers of authors over time have not been just due to increasing research complexity. J Clin Epidemiol. 2008;61(6):546–551. doi: 10.1016/j.jclinepi.2007.07.017. [DOI] [PubMed] [Google Scholar]
- 28.Casadevall A, Steen RG, Fang FC. Sources of error in the retracted scientific literature. FASEB J. 2014;28(9):3847–3855. doi: 10.1096/fj.14-256735. [DOI] [PMC free article] [PubMed] [Google Scholar]
- 29.Baker M. Reproducibility crisis: Blame it on the antibodies. Nature. 2015;521(7552):274–276. doi: 10.1038/521274a. [DOI] [PubMed] [Google Scholar]
- 30.Ioannidis JPA. A generalized view of self-citation: Direct, co-author, collaborative, and coercive induced self-citation. J Psychosom Res. 2015;78(1):7–11. doi: 10.1016/j.jpsychores.2014.11.008. [DOI] [PubMed] [Google Scholar]
- 31.Eckartz K, Kirchkamp O, Schunk D. 2012 How do incentives affect creativity? CESifo Working Paper Series No. 4049. Available at perma.cc/ET8J-6KWB. Accessed June 19, 2015.
- 32.Al-Shahi Salman R, et al. Increasing value and reducing waste in biomedical research regulation and management. Lancet. 2014;383(9912):176–185. doi: 10.1016/S0140-6736(13)62297-7. [DOI] [PMC free article] [PubMed] [Google Scholar]
- 33.Young NS, Ioannidis JPA, Al-Ubaydli O. Why current publication practices may distort science. PLoS Med. 2008;5(10):e201. doi: 10.1371/journal.pmed.0050201. [DOI] [PMC free article] [PubMed] [Google Scholar]
- 34.Chan A-W, et al. Increasing value and reducing waste: Addressing inaccessible research. Lancet. 2014;383(9913):257–266. doi: 10.1016/S0140-6736(13)62296-5. [DOI] [PMC free article] [PubMed] [Google Scholar]
- 35. Anonymous (2012) Further confirmation needed. Nat Biotechnol 30(9):806. [DOI] [PubMed]
- 36.Crow MM. Time to rethink the NIH. Nature. 2011;471(7340):569–571. doi: 10.1038/471569a. [DOI] [PubMed] [Google Scholar]
- 37.Casadevall A, Fang FC. Reforming science: Methodological and cultural reforms. Infect Immun. 2012;80(3):891–896. doi: 10.1128/IAI.06183-11. [DOI] [PMC free article] [PubMed] [Google Scholar]
- 38.Fang FC, Casadevall A. Reforming science: Structural reforms. Infect Immun. 2012;80(3):897–901. doi: 10.1128/IAI.06184-11. [DOI] [PMC free article] [PubMed] [Google Scholar]
- 39.Tuljapurkar S, Li N, Boe C. A universal pattern of mortality decline in the G7 countries. Nature. 2000;405(6788):789–792. doi: 10.1038/35015561. [DOI] [PubMed] [Google Scholar]
- 40.Mocroft A, et al. Changing patterns of mortality across Europe in patients infected with HIV-1. EuroSIDA Study Group. Lancet. 1998;352(9142):1725–1730. doi: 10.1016/s0140-6736(98)03201-2. [DOI] [PubMed] [Google Scholar]
- 41.Goldman L, Cook EF. The decline in ischemic heart disease mortality rates. An analysis of the comparative effects of medical interventions and changes in lifestyle. Ann Intern Med. 1984;101(6):825–836. doi: 10.7326/0003-4819-101-6-825. [DOI] [PubMed] [Google Scholar]
- 42.Collins FS. 2010 Revealing the body’s deepest secrets. Parade. Available at perma.cc/RWJ4-C456. Accessed June 18, 2015.
- 43.Jobling MA, Gill P. Encoded evidence: DNA in forensic analysis. Nat Rev Genet. 2004;5(10):739–751. doi: 10.1038/nrg1455. [DOI] [PubMed] [Google Scholar]
- 44.Chabner BA, Roberts TG., Jr Timeline: Chemotherapy and the war on cancer. Nat Rev Cancer. 2005;5(1):65–72. doi: 10.1038/nrc1529. [DOI] [PubMed] [Google Scholar]
- 45.Rosenau J. Science denial: A guide for scientists. Trends Microbiol. 2012;20(12):567–569. doi: 10.1016/j.tim.2012.10.002. [DOI] [PubMed] [Google Scholar]
- 46.Achenbach J. 2015 Why science is so hard to believe. The Washington Post. Available at perma.cc/7N96-DV7E. Accessed March 6, 2015.
- 47.US National Library of Medicine doi: 10.1080/15360280801989377. PubMed search engine. Available at www.ncbi.nlm.nih.gov/pubmed/. Accessed March 7, 2015. [DOI] [PubMed]
- 48.US National Library of Medicine 2014 doi: 10.1080/15360280801989377. MEDLINE/PubMed data element (field) descriptions. Available at perma.cc/Q9XL-CNW2. Accessed January 22, 2015. [DOI] [PubMed]
- 49.National Institutes of Health 2014 The NIH almanac: Appropriations (section 2). Available at perma.cc/62PJ-F3FS. Accessed January 21, 2015.
- 50.National Institutes of Health 2013 National Institutes of Health: Operating plan for FY 2014. Available at perma.cc/F3Z5-XEDS. Accessed January 21, 2015.
- 51.US Bureau of Labor Statistics 2015 CPI detailed report: Data for December 2014. Available at perma.cc/H8SJ-CT2C. Accessed January 21, 2015.
- 52.Madrick J. 2014 Innovation: The government was crucial after all. The New York Review of Books. Available at perma.cc/8J6H-4XXE. Accessed June 18, 2015.
- 53.US Food and Drug Administration 2013 Summary of NDA approvals & receipts, 1938 to the present. Available at perma.cc/6SSM-W4B7. Accessed January 21, 2015.
- 54.US Food and Drug Administration 2015 Novel new drugs: 2014 summary. Available at perma.cc/ZN5J-LLGG. Accessed January 29, 2015.
- 55.The World Health Organization 2004 The World medicines situation. Available at perma.cc/FBH3-XS5X. Accessed February 2, 2015.
- 56.Hollis A. 2004 Me-too drugs: Is there a problem? Available at perma.cc/U4W6-T6VA. Accessed June 18, 2015.
- 57. The World Bank (2014) World Bank open data. Available at data.worldbank.org. Accessed February 2, 2015.
- 58. US Patent and Trademark Office (2014) US patent statistics chart. Available at perma.cc/LN2Q-JFGT. Accessed March 7, 2015.
- 59.European Commission Eurostat 2014 Life expectancy by age and sex. Available at appsso.eurostat.ec.europa.eu/nui/show.do?dataset=demo_mlexpec&lang=en. Accessed October 2, 2014.
- 60.Wilson E. 2005 The top pharmaceuticals that changed the world: Thyroxine. Chemical & Engineering News. Available at perma.cc/4Y2Q-U9TT. Accessed February 2, 2015.
- 61.Santella TM, Wertheimer AI. The levothyroxine spectrum: Bioequivalence and cost considerations. Formulary. 2005;40(8):258–271. [Google Scholar]
- 62.Fleming A. Classics in infectious diseases: On the antibacterial action of cultures of a penicillium, with special reference to their use in the isolation of B. influenzae by Alexander Fleming, Reprinted from the British Journal of Experimental Pathology 10:226-236, 1929. Rev Infect Dis. 1980;2(1):129–139. [PubMed] [Google Scholar]
- 63. American Chemical Society (1999) Discovery and development of penicillin. Available at perma.cc/9NRJ-PZXB. Accessed January 21, 2015.
- 64.Ahlquist RP. A study of the adrenotropic receptors. Am J Physiol. 1948;153(3):586–600. doi: 10.1152/ajplegacy.1948.153.3.586. [DOI] [PubMed] [Google Scholar]
- 65.Quirke V. Putting theory into practice: James Black, receptor theory and the development of the beta-blockers at ICI, 1958-1978. Med Hist. 2006;50(1):69–92. doi: 10.1017/s0025727300009455. [DOI] [PMC free article] [PubMed] [Google Scholar]
- 66.Carr H. 1952. Free precession techniques in nuclear magnetic resonance. PhD thesis (Harvard Univ, Cambridge, MA) [Google Scholar]
- 67. Mallard J (2003) The evolution of medical imaging: From Geiger counters to MRI–a personal saga. Perspect Biol Med 46(3):349–370. [DOI] [PubMed]
- 68.Prince AM. Relation of Australia and SH antigens. Lancet. 1968;2(7565):462–463. doi: 10.1016/s0140-6736(68)90512-6. [DOI] [PubMed] [Google Scholar]
- 69.Gerlich WH. Medical virology of hepatitis B: How it began and where we are now. Virol J. 2013;10:239. doi: 10.1186/1743-422X-10-239. [DOI] [PMC free article] [PubMed] [Google Scholar]
- 70.Erdös EG. The ACE and I: How ACE inhibitors came to be. FASEB J. 2006;20(8):1034–1038. doi: 10.1096/fj.06-0602ufm. [DOI] [PubMed] [Google Scholar]
- 71.Smith CG, Vane JR. The discovery of captopril. FASEB J. 2003;17(8):788–789. doi: 10.1096/fj.03-0093life. [DOI] [PubMed] [Google Scholar]
- 72.Jackson DA, Symons RH, Berg P. Biochemical method for inserting new genetic information into DNA of Simian Virus 40: Circular SV40 DNA molecules containing lambda phage genes and the galactose operon of Escherichia coli. Proc Natl Acad Sci USA. 1972;69(10):2904–2909. doi: 10.1073/pnas.69.10.2904. [DOI] [PMC free article] [PubMed] [Google Scholar]
- 73.Junod SW. 2009 Celebrating a milestone: FDA's approval of first genetically-engineered product. Available at perma.cc/BTN6-LZBZ. Accessed February 2, 2015.
- 74.Köhler G, Milstein C. Continuous cultures of fused cells secreting antibody of predefined specificity. Nature. 1975;256(5517):495–497. doi: 10.1038/256495a0. [DOI] [PubMed] [Google Scholar]
- 75.Smith SL. Ten years of Orthoclone OKT3 (muromonab-CD3): A review. J Transpl Coord. 1996;6(3):109–119, quiz 120–121. doi: 10.7182/prtr.1.6.3.8145l3u185493182. [DOI] [PubMed] [Google Scholar]
- 76.Tobert JA. Lovastatin and beyond: The history of the HMG-CoA reductase inhibitors. Nat Rev Drug Discov. 2003;2(7):517–526. doi: 10.1038/nrd1112. [DOI] [PubMed] [Google Scholar]
- 77.US Food and Drug Administration 2014 HIV/AIDS historical time line 1981-1990. Available at perma.cc/D7JM-9ZQE. Accessed January 21, 2015.
- 78.Bartlett JG. 2006 Ten years of HAART: Foundations for the future. Medscape. Available at perma.cc/XQS4-FD24. Accessed February 2, 2015.
- 79.Okazaki T, Honjo T. PD-1 and PD-1 ligands: From discovery to clinical application. Int Immunol. 2007;19(7):813–824. doi: 10.1093/intimm/dxm057. [DOI] [PubMed] [Google Scholar]
- 80.Iwai Y, et al. Involvement of PD-L1 on tumor cells in the escape from host immune system and tumor immunotherapy by PD-L1 blockade. Proc Natl Acad Sci USA. 2002;99(19):12293–12297. doi: 10.1073/pnas.192461099. [DOI] [PMC free article] [PubMed] [Google Scholar]


