Significance
In animal tissue, most adherent cells round up against confinement to conduct mitosis. Impaired cell rounding is thought to perturb tissue development and homeostasis and contribute to progression of cancer. Due to the lack of suitable experimental tools, however, insight into the mechanical robustness of mitosis in animal cells remains limited. Here we introduce force-feedback–controlled ion beam-sculpted cantilevers to confine single cells and characterize their progression through mitosis. Our approach reveals critical yield forces that trigger cell cortex herniation, loss of F-actin homogeneity, dissipation of intracellular pressure, critical cell-height decrease, mitotic spindle defects, and resultant perturbation of mitotic progression.
Keywords: mitotic cell rounding, mitotic progression, cell cortex, mitotic arrest, cell confinement
Abstract
Despite the importance of mitotic cell rounding in tissue development and cell proliferation, there remains a paucity of approaches to investigate the mechanical robustness of cell rounding. Here we introduce ion beam-sculpted microcantilevers that enable precise force-feedback–controlled confinement of single cells while characterizing their progression through mitosis. We identify three force regimes according to the cell response: small forces (∼5 nN) that accelerate mitotic progression, intermediate forces where cells resist confinement (50–100 nN), and yield forces (>100 nN) where a significant decline in cell height impinges on microtubule spindle function, thereby inhibiting mitotic progression. Yield forces are coincident with a nonlinear drop in cell height potentiated by persistent blebbing and loss of cortical F-actin homogeneity. Our results suggest that a buildup of actomyosin-dependent cortical tension and intracellular pressure precedes mechanical failure, or herniation, of the cell cortex at the yield force. Thus, we reveal how the mechanical properties of mitotic cells and their response to external forces are linked to mitotic progression under conditions of mechanical confinement.
In mitosis, eukaryotic cells down-regulate focal adhesions and increase their cortical tension and intracellular pressure, thereby generating force to round up against external impediments (1–3). Recent studies in the epithelium and epidermis of various organisms indicate that mitotic cell rounding is involved in tissue organization, development, and homeostasis (4–8). Abnormal mitotic cell shape can have adverse consequences for chromosome segregation and tissue growth (9), in some cases contributing to tumorigenesis (7). Despite the importance of cell rounding in mitotic progression and tissue organization, the mechanical robustness of mitotic cells remains poorly investigated even in vitro, probably due to a paucity of suitable experimental tools that can apply precise forces to poorly adherent cells. Confining cell rounding below 5–8 µm with microfabricated polydimethylsiloxane (PDMS) chambers perturbs mitotic progression in several cell types (2, 10), but the forces required to do this remain unquantified. Thus, the magnitude of confinement force required to prevent mitosis and the mechanisms of cell response to such forces are not known.
One approach to applying precise forces to cells is atomic force microscopy (AFM). Originally developed for nanoscale analysis and visualization of inorganic surfaces (11), AFM has found applications in studying the mechanics of soft biological materials, from single molecules to cells and tissues (12–16). However, the ability to conduct experiments on poorly adherent cells, such as nonadherent white blood cells (17) or rounded mitotic cells (18), has been hampered by cantilevers of inappropriate geometry. In these cases, cells become laterally unstable under loading forces of more than several tens of nanonewtons due to the standard 8–12° angle of cantilever mounting (18). Polymer-wedged cantilevers that we recently introduced were promising but, because of hand manufacturing, lacked the required accuracy and reproducibility needed to confine single cells at high submicrometer and nanonewton precision (19). Here we engineer wedged cantilevers from a single piece of silicon by using focused ion beam (FIB) ablation, a technique widely available in physics and materials science laboratories. The resulting FIB-sculpted cantilevers enable confinement of single mitotic cells with precise uniaxial forces and subsequent characterization of their progression through mitosis with optical microscopy. We deploy this method to determine the robustness of mitotic rounding against externally applied forces and provide mechanistic insights into how confinement force affects mitotic progression in animal cells.
Results
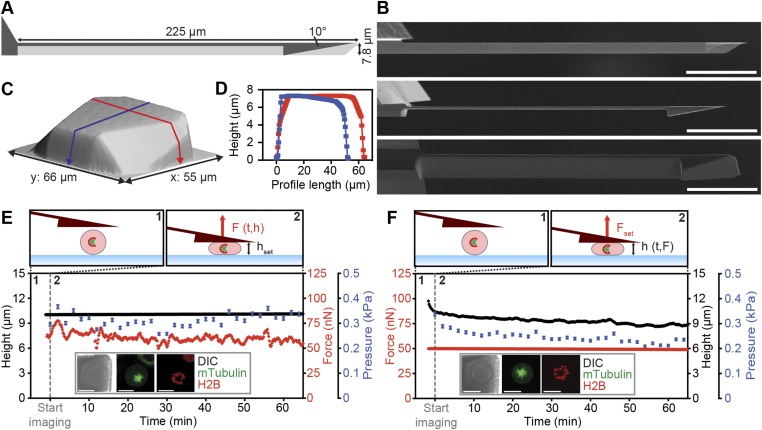
In mitosis, cells round up and reduce adhesion to extracellular matrix or substrate (1–3). When attempting to confine cells with a tilted AFM cantilever, cells easily slide away (18). Even slightly tilted cantilevers of a few degrees will cause rounded cells to slip away so that they cannot be mechanically confined. To properly confine single mitotic cells and enable characterization of their progression through mitosis, we used FIB ablation to reshape standard AFM cantilevers. A larger silicon cantilever is remodeled into a smaller one featuring a flat terminal wedge, which negates the 10° mounting angle of our system and facilitates accurate (<1° error) uniaxial confinement geometry (Figs. S1 A–D and S2). By using FIB to modulate the thickness of the cantilever shaft, the spring constant was tuned to 0.5–1.5 N·m−1, a range sufficiently sensitive to measure and apply forces relevant to most animal cells (1–500 nN) and yet stiff enough to maintain the required uniaxial confinement under variable loading forces. These customized cantilevers thus provide the technical improvements to confine isolated cells with precise force control.
Fig. S1.
FIB-sculpted AFM cantilevers enable stable mechanical confinement of mitotic cells. (A) Cantilever remodeling scheme with shape profiles before (light gray) and after (dark gray) FIB processing. (B) SEM images of the cantilever before and after FIB processing. (C and D) AFM topograph of the wedge surface (C). Blue and red lines contour the length (x axis) and width (y axis), respectively, and are displayed as height profiles (D). (E and F) Examples of AFM height (E) and force (F) confinement experiments on chemically arrested (2 µM S-trityl-l-cysteine; STC) mitotic cells confined to a height of 10 µm or by a force of 50 nN. (Top) Depictions are labeled with the parameters: F, force; Fset, set force; h, height; hset, set height; t, time. Graphs: single-cell data showing implementation of height and force confinement experiments. Cells expressed microtubule (mTubulin-GFP) and chromatin (H2B-mCherry) markers as displayed (Insets) with differential interference contrast (DIC) and fluorescence images. Tubulin and histone morphology shows monopolar spindles characteristic of STC-induced prometaphase arrest. Error bars, ±2% (based on measurement uncertainty from image analysis). [Scale bars, 50 µm (B) and 20 µm (E and F).]
Fig. S2.
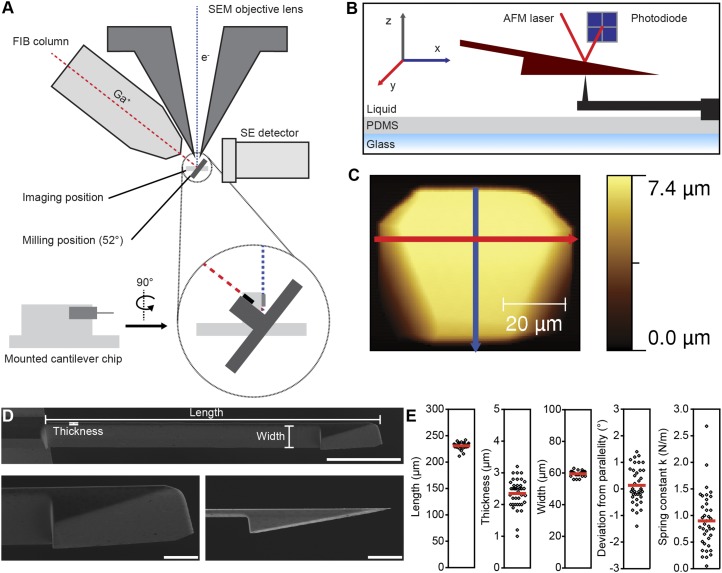
Processing and characterization of FIB-sculpted cantilevers. (A) Schematic of the FIB-SEM setup for remodeling and imaging cantilevers (45). e−, electron beam; Ga+, gallium ion beam; SEM, scanning electron microscope. (B) Principle of AFM force–volume imaging of the FIB-sculpted cantilever using an inverted AFM tip (MPP-11100-10 cantilever; Bruker) embedded in PDMS. (C) AFM topograph of a sample wedge. Blue and red lines contour the length and width of the wedge, respectively (Fig. S1 C and D). (D) SEM image of a cantilever tilted by 15° to show the wedge and cantilever shape (Top). Zoomed shots of wedge geometry from 15° (Bottom Left) and side-on (Bottom Right). [Scale bars, 50 µm (Top) and 10 µm (Bottom).] (E) Geometric parameters and spring constants for FIB-sculpted cantilevers processed for this study (n = 38). By controlling the thickness of the cantilever shaft between 2 and 3 µm while leaving its length (∼225 µm) and width (∼60 µm) unchanged, the spring constant of the majority of cantilevers was tuned to 0.5–1.5 N·m−1. Each processed cantilever is represented by a single dot. Red bars, mean.
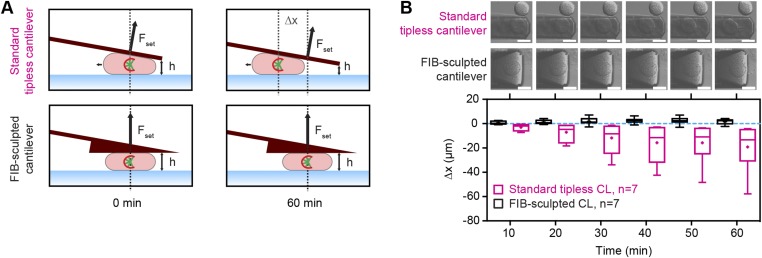
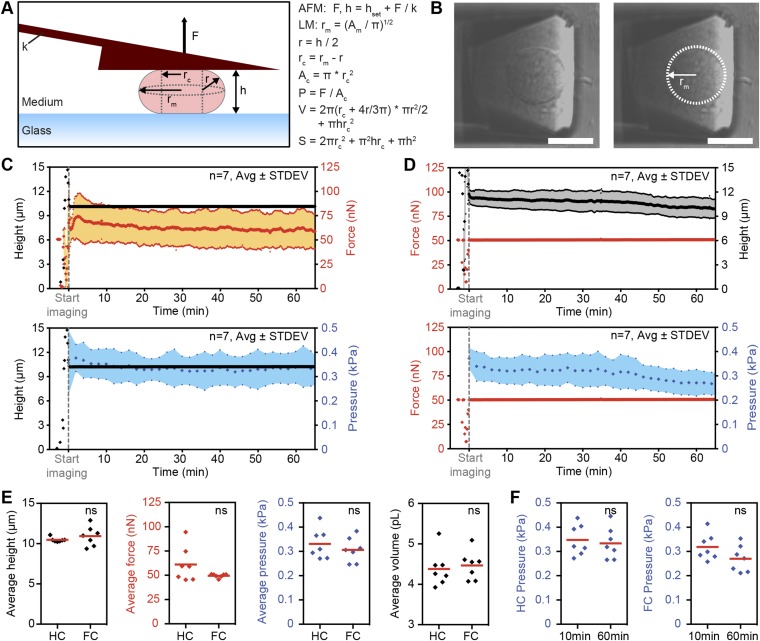
To verify the use of FIB-sculpted cantilevers for confinement of mitotic cells, we performed pilot experiments on rounded HeLa cells chemically arrested in mitosis with an inhibitor of kinesin Eg5, S-trityl-l-cysteine (STC) (20). By exploiting the feedback functionality of AFM, stable deployment of both constant-height and constant-force modes could be demonstrated, which we refer to as “height confinement” and “force confinement” experiments (Fig. S1 E and F). Under a loading force of 50 nN, FIB-sculpted cantilevers held cells in place for over an hour, whereas standard tipless cantilevers caused lateral instability and cell sliding (Fig. S3) (18). In the case of height confinement to 10 µm with a cantilever of spring constant ∼1 N·m−1, a sustained counterforce of ∼50–70 nN was recorded. Flexion was therefore ∼50–70 nm and represented less than 0.1° deviation in angle. Analyzing cell geometry for contact area with a verified model based on the Young–Laplace relationship (21), we observed that the intracellular pressure was steady for both 10-µm height confinement and 50-nN force confinement (Fig. S4). Thus, this setup demonstrates the ability to maintain confinement of mitotic or otherwise poorly adherent cells in a stable and precise manner. It enables cells on rigid substrates to be subjected to defined forces or set heights while gauging the mechanical response of live cells by optical microscopy.
Fig. S3.
FIB-sculpted cantilevers facilitate stable confinement of poorly adherent cells. (A) Depiction of lateral stability over time with standard tipless (Top) versus FIB-sculpted (Bottom) cantilevers for force confinement experiments on chemically (STC) arrested mitotic cells. ∆x, lateral movement of cells subjected to a constant force of 50 nN. (B) Quantification of lateral cell movement in force confinement experiments on STC-arrested mitotic HeLa cells for standard tipless and FIB-sculpted cantilevers. (Top) DIC images. (Bottom) Lateral movement with respect to position at time 0 min (∆x) over time. Box, 25th to 75th percentile. Line, median. Whiskers, minimum to maximum. +, mean. CL, cantilever; n, number of cells characterized. (Scale bars, 20 µm.)
Fig. S4.
Determination of cell geometry and intracellular pressure for height and force confinement experiments. (A) Diagram of the experimental setup, and parameters with formulas for geometry and pressure calculations based on the assumption of semicircular side profiles in nonadherent cells confined by parallel-plate geometry. The semicircular assumption has been reported as a good approximation of cell dimensions with a verified cortical shell-liquid core model of cell shape (21). Ac, contact area; AFM, atomic force microscopy; Am, midplane area; F, measured force; h, set height corrected for cantilever deflection; hset, set height; k, cantilever spring constant; LM, light microscopy; P, pressure; r, radius of semicircular side profile; rc, radius of contact area; rm, midplane radius; S, cell-body surface area; V, cell-body volume. For control experiments conducted in the absence of any cantilever, cell height was estimated from the midplane cell diameter by applying a height-to-width ratio of 0.86 previously measured for HeLa cells (1). (B) Representative midplane DIC images used for determination of circumference and area. (Left) Raw image. (Right) Cell outline trace. (Scale bars, 20 µm.) (C) Height confinement experiments on STC-arrested mitotic HeLa cells confined to 10 µm. Shown are output force (Top) and pressure (Bottom) for n = 7 cells with average (middle line) and average ± SD (colored area). (D) Force confinement experiments on STC-arrested mitotic HeLa cells confined by 50 nN. Shown are output height (Top) and pressure (Bottom) for n = 7 cells with average (middle line) and average ± SD (colored area). (E) Comparison of results from height (10 µm; HC) and force (50 nN; FC) confinement experiments. (F) Comparison of results from 10 and 60 min for height (Left) and force (Right) confinement experiments. Red bars, mean. Statistical significance was determined using the Mann–Whitney t test. ns, not significant (P > 0.05).
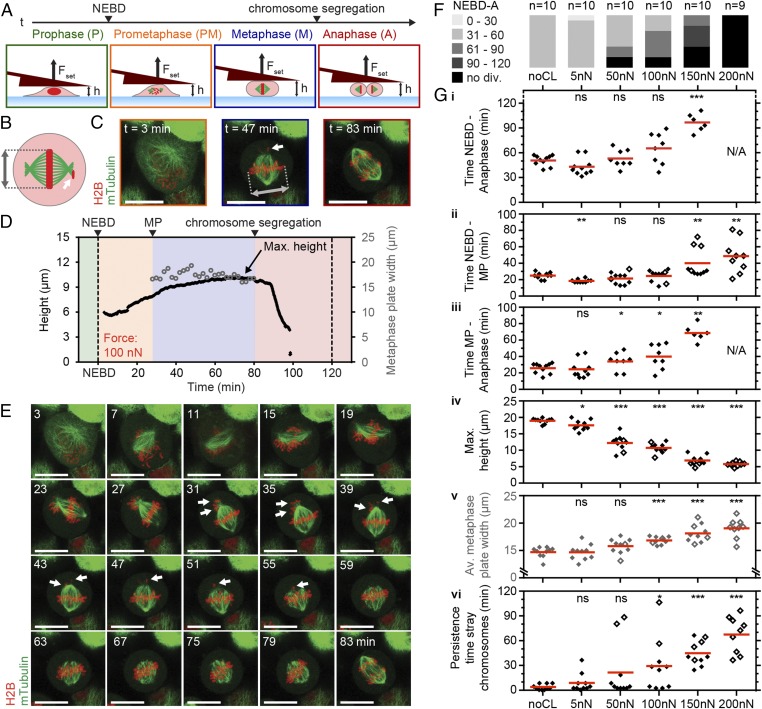
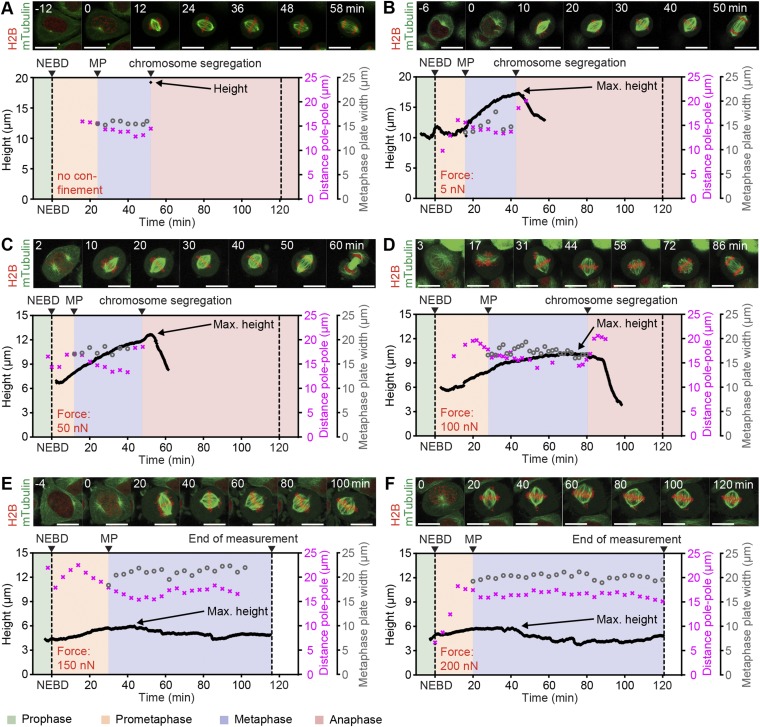
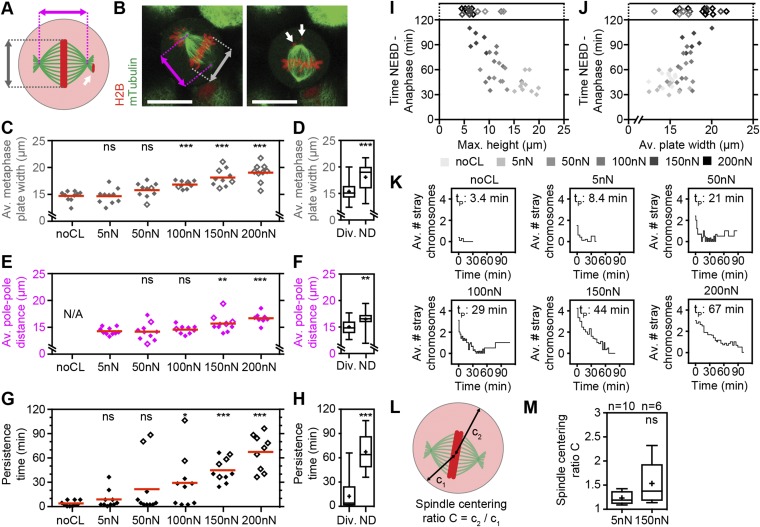
Next, we investigated the effect of constant forces on mitotic cell shape and progression. In mitosis, cells generate actomyosin-dependent (1) intracellular pressure to round up and optimize geometry for proper function of the mitotic spindle, the machinery that organizes and segregates chromosomes (2, 9, 10, 22). Restricting cell rounding height below 5–8 µm with microfabricated PDMS chambers perturbs mitotic progression in several cell types (2, 10), but the forces that cells can withstand remain unquantified. To determine these forces, we selected cells in early mitosis (prophase) by the appearance of condensed chromosomes and performed force confinement experiments (Fig. 1A). HeLa cells that constitutively express a microtubule label, mouse tubulin-GFP, and a chromatin marker, human H2B-mCherry, enabled the identification of cell-cycle phase and evaluation of spindle morphogenesis (Fig. 1 B and C). As cells progressed through mitosis, they became rounder and increased in height. Cells subjected to 5-nN force reached a maximum height of 17.5 ± 1.5 µm (average ± SD) compared with ∼19 µm in the unconfined case (Fig. 1G and Fig. S5). Although metaphase duration remained unchanged, overall time through mitosis was decreased due to a significantly shortened prometaphase of ∼18 min (5 nN) compared with ∼24 min (unconfined) (Fig. 1 F and G). Interestingly, others have reported that rapid subsecond mechanical impulses in the range of 3–8 µm can accelerate mitotic progression, albeit in metaphase (23). Thus, small forces and deformations appear capable of assisting mitotic progression, possibly by biasing the long axis of the cell parallel to the substrate or placing a slight stimulatory tension on the spindle (23, 24). At 50 nN, however, mitotic durations were similar to unconfined controls (52 ± 10 min) with maximum cell heights reaching 12.2 ± 2.3 µm. Increasing force to 100 nN, we found that cell height peaked at 10.6 ± 1.5 µm, whereas mitotic progression was prolonged to 64 ± 19 min (Fig. 1 D, F, and G). Distortion of spindle geometry was evidenced by distended metaphase plate widths and pole-to-pole distances, and correlated with reduced efficiency of the spindle to efficiently gather stray chromosomes (Fig. 1G and Fig. S6). When applied forces were increased to 150 and 200 nN, confined cells were unable to rise above 7 µm, concomitant with even more drastic distortion of spindle morphology, persistent stray chromosomes, and failure of cells to initiate chromosome segregation within 120 min. In accordance with these results, Lancaster et al. also identified ∼7 µm as the critical height that causes severe spindle assembly defects and delay in mitotic progression via an inability to satisfy the spindle assembly checkpoint in HeLa cells (2). Thus, we determined that single mitotic HeLa cells could withstand confinement forces up to 100 nN before succumbing to heights that retard mitotic progression due to spindle dysfunction. Finally, beyond 150 nN, cells were mechanically arrested and could not complete mitosis.
Fig. 1.
Increasing confinement forces perturb mitotic progression by distorting cell shape and spindle geometry. (A) Schematic of transmitotic force confinement experiment with depicted mitotic phases, spindle microtubules (green), and chromosomes (red). NEBD, nuclear envelope breakdown. Fset, set force. h, cantilever height; t, time. (B and C) Top view of spindle characterization scheme of a confined HeLa cell (B) and sample fluorescence snapshots of microtubules (mTubulin-GFP) and chromosomes (H2B-mCherry) (C). Gray marker, metaphase plate width. White arrows, stray chromosomes. t = 0, NEBD. (D) Cell height (black line) and metaphase plate width (gray circles) for a mitotic HeLa cell subjected to a constant force of 100 nN. The colored background indicates the mitotic phases depicted in A. MP, metaphase plate formation. (E) Overlaid confocal midplane images showing microtubule (mTubulin-GFP) and chromosome (H2B-mCherry) dynamics for the mitotic cell from D. (F) NEBD-to-anaphase (NEBD-A) durations for transmitotic force confinement experiments and control cells (noCL, no cantilever). n, number of cells characterized; no div., cells did not divide within 120 min. (G) Graphs showing durations of NEBD to anaphase (i), NEBD to metaphase plate formation (ii), and metaphase plate formation to anaphase (iii), maximum height reached (iv), average metaphase plate width from metaphase plate formation to anaphase (v), and persistence time of stray chromosomes (vi) for all cells where applicable. Empty diamonds designate cells that did not divide within 120 min. N/A, time measurement not applicable. Red bars, mean. (Scale bars, 20 µm.) Statistical significance was determined using the Mann–Whitney t test comparing each condition with the noCL data. ns, not significant (P > 0.05); *P ≤ 0.05, **P ≤ 0.01, ***P ≤ 0.001.
Fig. S5.
Representative transmitotic force confinement experiments at different forces. Single-cell transmitotic no-cantilever control (A) and force confinement experiments for confinement by 5 nN (B), 50 nN (C), 100 nN (D), 150 nN (E), and 200 nN (F). (Top) Confocal midplane fluorescence overlay of microtubule (mTubulin-GFP) and chromosome (H2B-mCherry) markers at the time points indicated. (Bottom) Height (black line), metaphase plate width (gray circles), and pole-to-pole distance (pink crosses) trace, with colored background indicating mitotic phases (see color key below E). MP, metaphase plate formation; NEBD, nuclear envelope breakdown. (Scale bars, 20 µm.)
Fig. S6.
Quantitative analysis of spindle geometry in transmitotic force confinement experiments. (A) Scheme for analyzing spindle geometry parameters. Pink marker, pole-to-pole distance. Gray marker, metaphase plate width. White arrow, stray chromosomes. (B) Midplane confocal fluorescence overlay images of the mitotic spindle in an mTubulin-GFP– and H2B-mCherry–expressing HeLa cell progressing through mitosis against a confinement force of 100 nN. Images are at the beginning of metaphase plate formation (Left; 27 min) and at an intermediate time point between metaphase plate formation and chromosome segregation (Right; 43 min). (Scale bars, 20 µm.) (C–H) Quantification of midplane average metaphase plate width and spindle pole-to-pole distance from metaphase plate formation to anaphase (C and E) and persistence time of stray chromosomes (G) for no-cantilever (noCL) control and different confinement forces and for cells with (Div.) and without (ND) chromosome segregation within 120 min after NEBD (D, F, and H). N/A, pole-pole distance measurement not applicable. (I and J) NEBD-to-anaphase duration versus maximum height reached (I) and versus average metaphase plate width from metaphase plate formation to anaphase (J) for all cells tested (n = 59). Empty diamonds designate cells that did not divide within 120 min. (K) Average number of stray chromosomes versus time for no-cantilever control and different confinement forces. t = 0, metaphase plate formation. tP, average persistence time of stray chromosomes from G. (L) Scheme for analyzing spindle centering depicting the shortest (c1) and longest (c2) distance from spindle center to cell-body boundary. (M) Spindle centering ratio within 2 min before chromosome segregation for different confinement forces. Box, 25th to 75th percentile. Line, median. Whiskers, minimum to maximum. + and red bars, mean. Statistical significance was determined using the Mann–Whitney t test comparing each condition with the noCL (C and G), 5-nN (E and M), or Div. (D, F, and H) data. ns, not significant (P > 0.05); *P ≤ 0.05, **P ≤ 0.01, ***P ≤ 0.001.
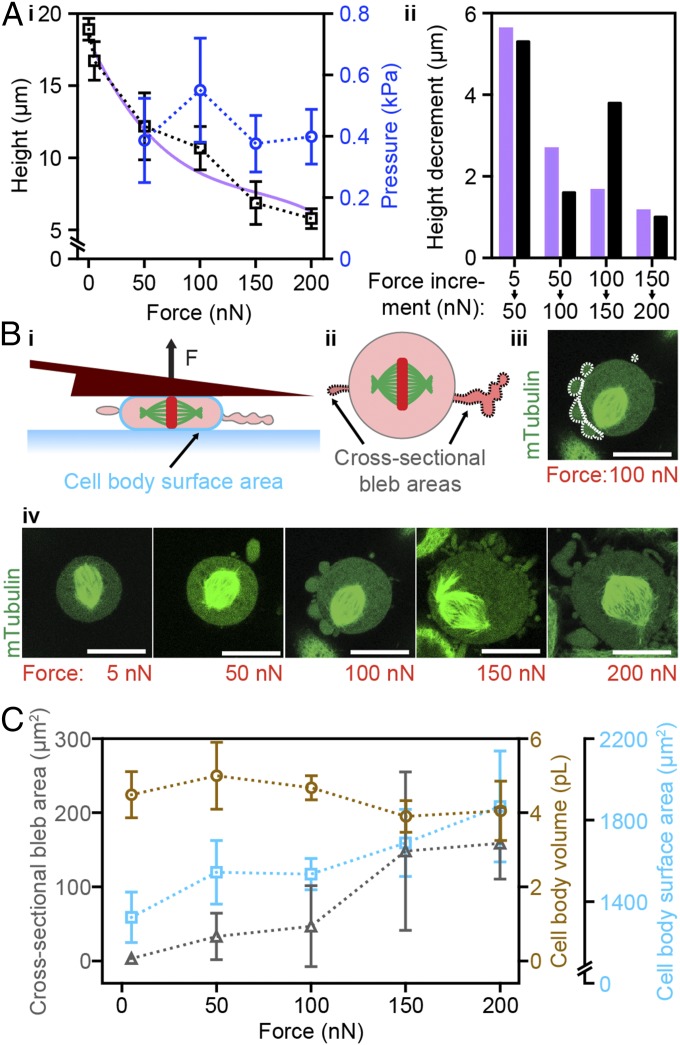
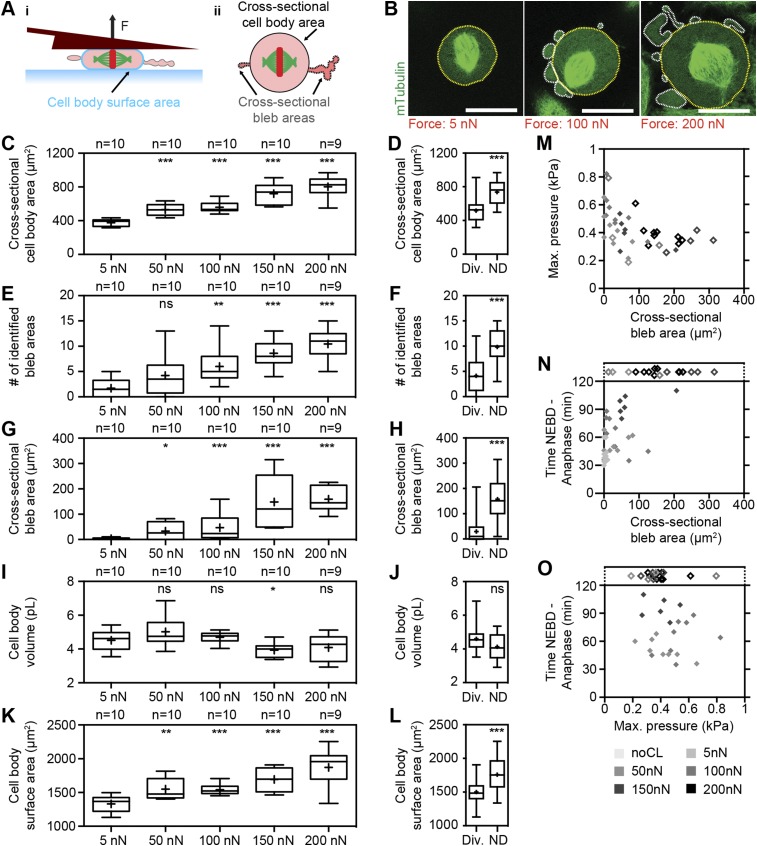
While performing constant-force experiments on cells progressing through mitosis, we noticed that cell height exhibited a nonlinear relationship with respect to input force. In particular, confinement forces greater than 100 nN appeared to potentiate cell-height decrease (Fig. 2A). Height declined ∼1.6 µm from 50 to 100 nN but ∼4 µm from 100 to 150 nN. However, cell-height decrements should decay per unit force increment if intracellular pressure and volume remain constant with confinement (Fig. S4A, equations). Thus, we wondered whether pressure or volume was altered as a function of confinement force. Indeed, analysis of intracellular pressure versus force revealed a pronounced elevation to ∼0.55 kPa at 100 nN, compared with ∼0.4 kPa for the other forces tested. On the other hand, volume of the main cell body showed a small loss for cells confined by 150 nN (Fig. 2C and Fig. S7I). Hence, increased hydrostatic pressure at 100 nN appears to endow mitotic cells with the ability to resist height decline, whereas at 150 nN, loss of cell-body volume and reversal of gained intracellular pressure correlate with augmented height decline. Seeking a mechanism, we examined changes in cell-surface behavior and geometry (Fig. 2B). First, we found that cell-surface area did not expand from 50 to 100 nN, indicating that a buildup of cortical stresses at the cell surface was linked to increased elevated intracellular pressure at this force (21). Second, we observed a significant surge in plasma membrane blebbing above 100 nN, as demonstrated by quantification of the number and cross-sectional area of blebs (Fig. 2 B and C and Fig. S7). Most of these blebs were persistent, exhibiting dynamic movement without fully retracting. Interestingly, cells exhibiting greater than 100-µm2 cross-sectional bleb areas neither sustained intracellular pressures above 0.4 kPa nor efficiently progressed through mitosis (Fig. S7 M and N). Taken together, our results reveal a distinct pattern of changes in intracellular pressure and persistent plasma membrane blebbing that correlates with potentiation of cell-height decline (Fig. 2 and Fig. S7).
Fig. 2.
Threshold confinement forces trigger persistent blebbing to potentiate cell-height decrease. (A) Maximum cell height and pressure (mean ± SD) vs. confinement forces (i) and height decrement per force increment (ii) with n ≧ 9 cells for each force. The purple line and bars represent constant pressure and volume behavior based on the cortical shell-liquid core model (Fig. S4), whereas the black bars represent the actual cell-height data. Note that 5-nN pressure data are not included due to excessive error in determining cell–cantilever contact area at small deformations. (B) Side- (i) and top-view (ii) illustrations of blebbing and cell-body surface-area quantification scheme in confined mitotic cells. (iii) Sample midplane image of a cell confined by 100 nN. Cytoplasm was identified by oversaturation of the mTubulin-GFP channel, and bleb areas were measured as outlined in white. (iv) Sample midplane images of mitotic cells confined by different forces. (Scale bars, 20 µm.) (C) Cross-sectional bleb area, cell-body volume, and cell-body surface area (mean ± SD) vs. confinement forces with n ≧ 9 cells for each force.
Fig. S7.
Quantitative analysis of cell blebbing and geometry in transmitotic force confinement experiments. (A) Side- (i) and top-view (ii) schematics of a confined cell. (B) Representative midplane images of cells progressing through mitosis against confinement forces of 5 nN (Left), 100 nN (Middle), and 200 nN (Right). Cytoplasm was identified by oversaturation of the mTubulin-GFP channel, cross-sectional cell-body areas were measured as outlined in yellow, and cross-sectional bleb areas were measured as outlined in white. (Scale bars, 20 µm.) (C–L) Quantification of cross-sectional cell-body area (C), number of identified bleb areas (E), cross-sectional bleb area (G), cell-body volume (I), and cell-body surface area (K) for different confinement forces and for cells with (Div.) and without (ND) chromosome segregation within 120 min after NEBD (D, F, H, J, and L). (M–O) Maximum pressure (M; n = 39) and NEBD-to-anaphase duration (N; n = 49) versus cross-sectional bleb area and NEBD-to-anaphase duration versus maximum pressure (O; n = 39). Empty diamonds designate cells that did not divide within 120 min. Box, 25th to 75th percentile. Line, median. Whiskers, minimum to maximum. +, mean. Statistical significance was determined using the Mann–Whitney t test comparing each condition with the 5-nN (C, E, G, I, and K) or Div. data (D, F, H, J, and L). ns, not significant (P > 0.05); *P ≤ 0.05, **P ≤ 0.01, ***P ≤ 0.001.
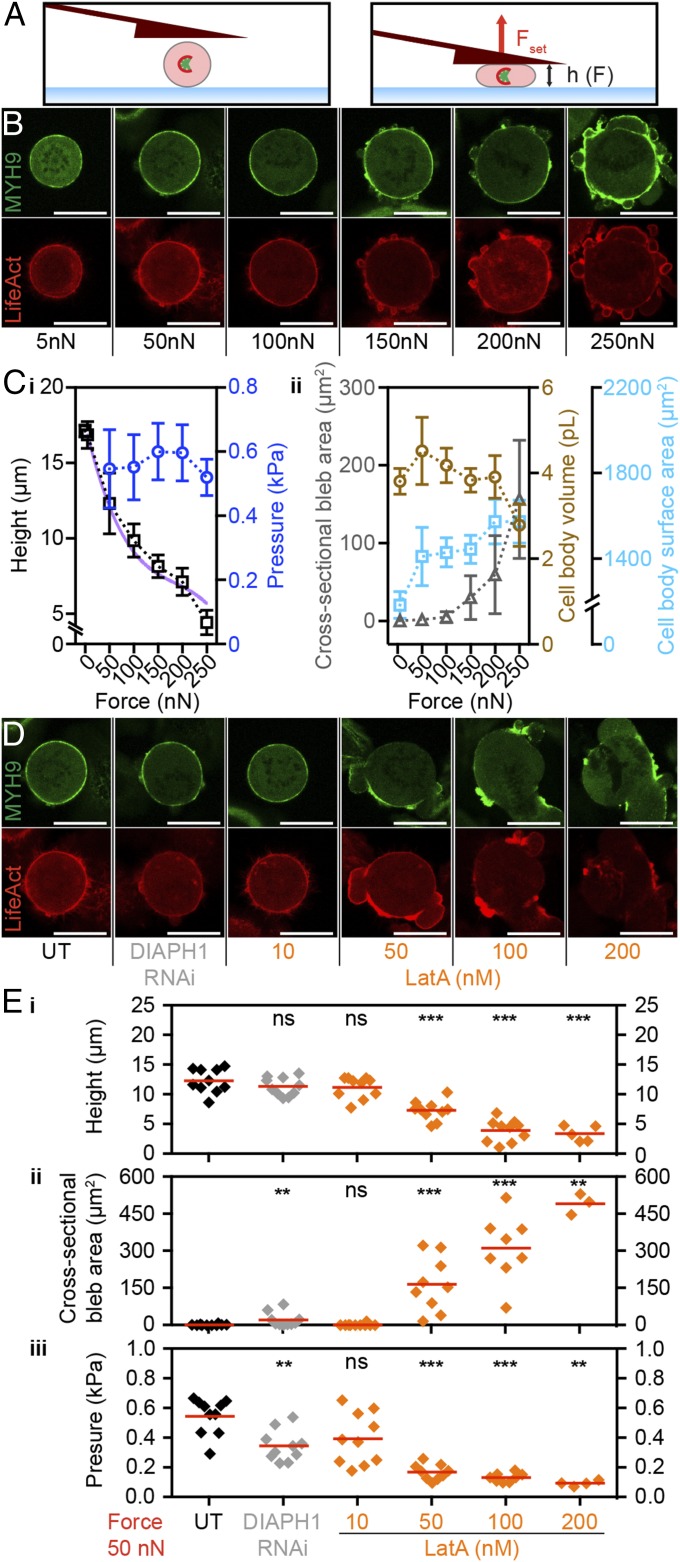
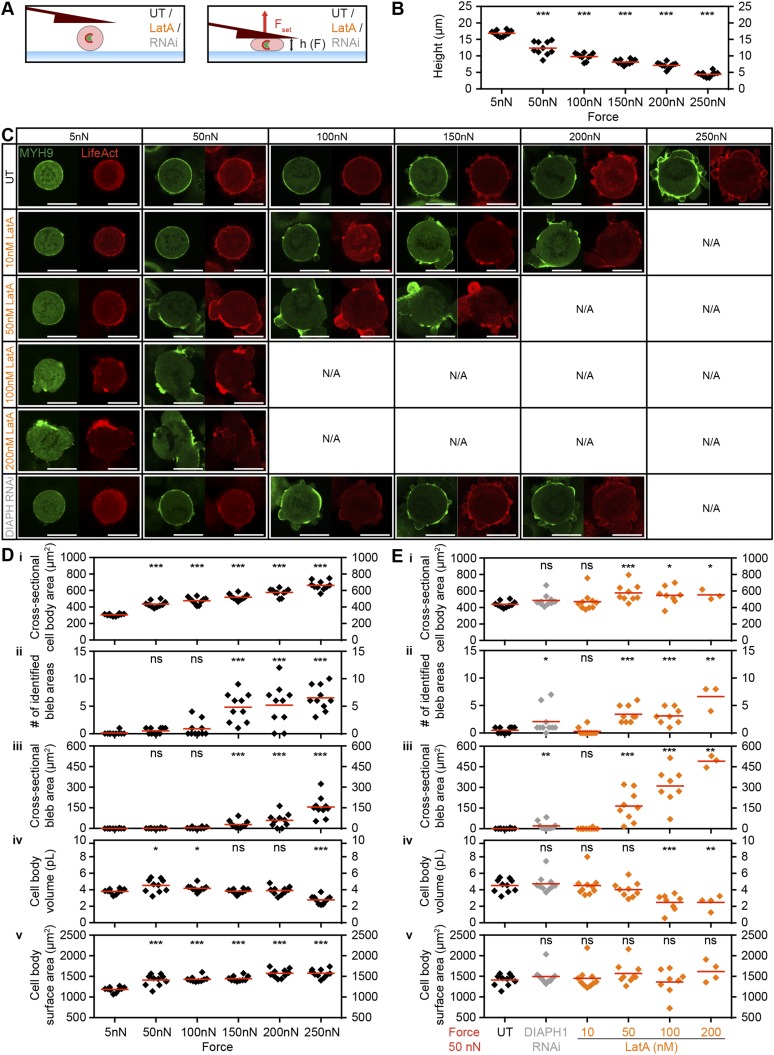
The observed increase in blebbing could be triggered by force-induced defects at the cell cortex. Bleb formation can result from local detachment of the membrane–cortex linkage or local rupture of the cortical actin meshwork (25). To investigate this possibility, we performed force confinement experiments on HeLa cells that stably express human non-muscle myosin heavy chain 9 tagged with green fluorescent protein (MYH9-GFP) and a 17-amino-acid peptide binding filamentous actin (F-actin) tagged with mCherry (Lifeact-mCherry). These fluorescent markers normally reveal a uniform enrichment of F-actin and myosin II at the mitotic cortex (3, 26). Cells were chemically arrested in mitosis with STC and then subjected to confinement forces ranging from 5 to 250 nN (Fig. 3 A–C and Fig. S8) (3). We found that increasing forces promote disorganization of cortical F-actin, in regard to both loss of homogeneous distribution and dynamic blebbing. Here, confined cells exhibited a potentiation in cell-height decrease proportional to blebbing intensity, albeit from 200 to 250 nN. This difference in robustness could be due to the use of prerounded STC-arrested cells or because of clonal variation of the cell line (26). To further probe the role of F-actin distribution in resisting confinement forces, we perturbed it by chemical or genetic means using the actin monomer sequesterer latrunculin A or siRNA targeting diaphanous-related formin 1 (DIAPH1) (3) (Fig. 3 D and E and Fig. S8). At 50 nN confinement force, dose–response lantruculin A treatments and RNAi confirmed a correlation between loss of F-actin homogeneity, persistent blebbing, dissipation of intracellular pressure, and resistance of target cells to deformation.
Fig. 3.
Threshold confinement forces promote loss of cortical F-actin homogeneity concurrent with persistent blebbing. (A) Schematic representation of the experimental setup. (Left) A cell arrested in mitosis by 2 µM STC. (Right) The same cell confined with a set force (Fset). h, cantilever height. (B) Distribution of F-actin and myosin II in HeLa cells expressing Lifeact-mCherry (red) and MYH9-GFP (green). Mitotic cells were confined with forces of 5, 50, 100, 150, 200, or 250 nN. (C) Stable maximum cell height and pressure (i) and cross-sectional bleb area, cell-body volume, and cell-body surface area (ii) (mean ± SD) vs. confinement forces with n = 10 cells for each force. The purple line represents constant pressure and volume behavior based on the cortical shell-liquid core model (Fig. S4). Note that 5-nN pressure data are not included due to excessive error in determining cell–cantilever contact area at small deformations. (D) Distribution of F-actin and myosin II in HeLa cells expressing Lifeact-mCherry (red) and MYH9-GFP (green). Mitotic cells were confined with forces of 50 nN after perturbation with RNAi (siRNA-mediated knockdown of DIAPH1; light gray) or increasing concentrations of latrunculin A (LatA) (orange). UT, untreated control cells. (E) Stable height (i), cross-sectional bleb area (ii), and pressure (iii) of conditions from D. Each diamond represents one cell. Red bars, mean. (Scale bars, 20 µm.) Statistical significance was determined using the Mann–Whitney t test comparing each condition with 5 nN (D) or UT (E) data. ns, not significant (P > 0.05); **P ≤ 0.01, ***P ≤ 0.001.
Fig. S8.
Characterization of actomyosin distribution and persistent blebbing as a function of confinement forces and actin perturbation in STC-arrested cells. (A) Schematic representation of the experimental setup. (Left) A cell arrested in mitosis by STC. (Right) A cell confined to a set force. F, force; Fset, set confinement force; h, cantilever height; LatA, latrunculin A; RNAi, siRNA-mediated knockdown of DIAPH1; UT, untreated. (B) Height data of STC-arrested HeLa cells expressing Lifeact-mCherry and MYH9-GFP confined with 5, 50, 100, 150, 200, and 250 nN. Each diamond corresponds to one cell. (C) Sample fluorescence images of STC-arrested HeLa cells expressing Lifeact-mCherry (red) and MYH9-GFP (green). Cells were confined with 5, 50, 100, 150, 200, or 250 nN upon treatment with either RNAi (siRNA-mediated knockdown of DIAPH1; light gray) or increasing concentrations of latrunculin A (orange). UT, untreated STC-arrested control cells. (Scale bars, 20 µm.) N/A, measurement and imaging not applicable. (D) Cross-sectional cell-body area (i), number of identified bleb areas (ii), cross-sectional bleb area (iii), cell-body volume (iv), and cell-body surface area (v) of STC-arrested HeLa cells expressing Lifeact-mCherry and MYH9-GFP confined with the forces indicated. Each black diamond corresponds to one cell. (E) Cross-sectional cell-body area (i), number of identified bleb areas (ii), cross-sectional bleb area (iii), cell-body volume (iv), and cell-body surface area (v) of STC-arrested HeLa cells expressing Lifeact-mCherry and MYH9-GFP confined with 50 nN upon treatment as indicated. DIAPH1 RNAi, siRNA-mediated knockdown of DIAPH1 (light gray diamonds); LatA, actin perturbation with latrunculin A at the concentrations indicated (orange diamonds); UT, untreated STC-arrested control cells. Each diamond corresponds to one cell. Red bars, mean. Statistical significance was determined using the Mann–Whitney t test comparing each condition with the 5-nN (D) or UT (E) data. ns, not significant (P > 0.05); *P ≤ 0.05, **P ≤ 0.01, ***P ≤ 0.001.
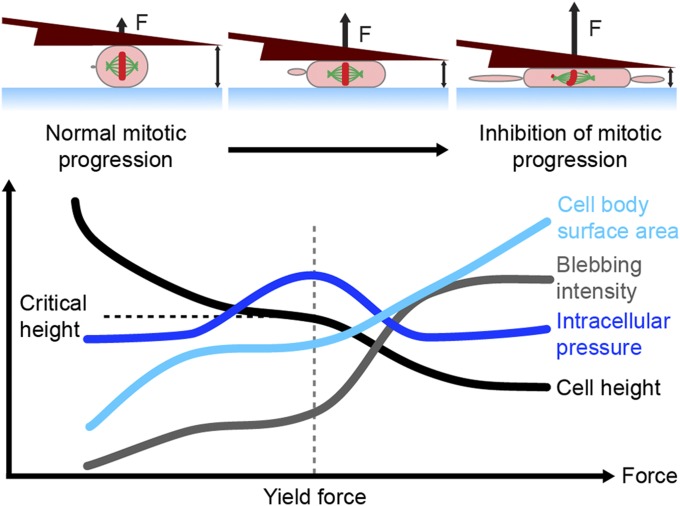
Overall, our results suggest the following model to explain mechanical robustness of mitotic cells against confinement forces (Fig. 4). As applied force expands cell cortex-surface area, elastic resistance causes increased cortical stress and a subsequent rise in intracellular pressure, like a balloon, which follows Laplace’s law (21). At a critical yield point, these effects lead to concurrent persistent blebbing and a loss of cortical F-actin homogeneity, followed by dissipation of intracellular pressure and a potentiation of cell-height decrease. By analogy to the biomechanical failure of pressurized tissues, this yield mechanism is akin to a herniation scenario. Finally, below a critical cell height, distortion of cell shape impinges on mitotic spindle function, thus perturbing mitotic progression.
Fig. 4.
Model for mechanical robustness of mitotic cells against confinement forces. Yield force indicates the threshold whereby applied force triggers persistent blebbing concurrent with loss of cortical F-actin homogeneity. Critical height denotes the point where mitotic progression incurs inhibition due to impingement on spindle function.
Discussion
We sought to determine how applied confinement forces inhibit mitotic progression in single animal cells. To do this, we used an AFM-based approach with FIB-sculpted cantilevers that enabled us to subject individual cells to a wide range of uniaxial confinement forces as they transitioned through mitosis. The approach exploits commercially available instruments (AFM, FIB-SEM, and optical microscopy), is compatible with live cell culture, and offers high precision, dynamically adjustable confinement, and feedback modalities including constant force and constant height (Fig. S1). Furthermore, because FIB-sculpted cantilevers are made from a single piece of silicon, they are fully transparent and do not suffer from autofluorescence, necessary features for optimal imaging of confined cells. As an advancement on earlier attempts to compensate for the standard 8–12° angle of cantilever mounting (19, 27), FIB enabled reproducible sculpting of cantilevers and the ability to tune the cantilever spring constant to match the mechanical properties of the target cell. These technical advances allowed us to probe the effect of controlled forces on mitotic progression in isolated cells (Figs. S1–S4).
To compress or confine mitotic cells, others have reported customized systems with microfluidic chambers of fixed heights (2, 10) or combinations of micromanipulators and microneedles (23, 28, 29). By applying a range of feedback-controlled confinement forces, we confirmed several of their observations including spindle widening and flattening (28, 29), accelerated mitotic progression with small deformations (23), asymmetric spindle positioning (10), and delayed mitotic progression due to ectopic spindle function below a critical height (2). We identified several force regimes according to the cell response: small forces (∼5 nN) that accelerate mitotic progression, intermediate forces (50–100 nN) where increased intracellular pressure was related to resistance to confinement, and, finally, yield forces (>100 nN) where mitotic progression was inhibited by mechanical perturbation of spindle geometry. The yield force coincided with a critical cell height below which we observed distortion of spindle geometry, defective chromosome gathering, and impairment of mitotic progression (Fig. 1).
We noted that the relative drop in cell height at the yield force correlated with a dissipation of built-up intracellular pressure and persistent blebbing (Fig. 2). To investigate the mechanisms of this structural failure, we examined the distribution of F-actin and myosin II in the cell cortex. Increasing confinement forces provoked a loss of cortical F-actin homogeneity necessary to maintain maximum intracellular pressure and resistance to confinement (Fig. 3). Based on these observations, we suggest a model where stretching of the cell surface initially increases actomyosin-dependent surface tension and intracellular pressure. Then, upon reaching a yield point, defects in F-actin uniformity and persistent blebbing conspire to potentiate a nonlinear drop in cell height, by analogy to a herniation scenario (Fig. 4). Interestingly, it has been observed elsewhere that both cortical tension and confinement can promote blebbing (1, 30–32). Recent experiments on confined cells exhibiting spontaneous bleb-based migration indicate that local fluctuations in cortical contractility are amplified by physical confinement, thereby increasing the probability of symmetry breaking and polarization in the cortex (31, 32). We hypothesize that two factors conspire to promote loss of cortical F-actin homogeneity at critical forces: (i) Cdk1-dependent up-regulation of myosin II contractility characteristic of mitosis (3), and (ii) thinning of limited cortical components as cell-surface area is dilated by mechanical confinement. We further speculate that cortical myosin II activity may be akin to a double-edged sword. On one hand, it is necessary to generate the tension for intracellular pressure that endows mitotic cells with the ability to push against confinement (1, 3); on the other hand, it increases the probability of defect formation that can destabilize F-actin cortex homogeneity (30).
We anticipate that further investigations of the mechanical robustness of mitosis across diverse cell types will offer unique insight into the influence of the mechanical environment on cell proliferation. Studies of multicellular spheroids indicate that the mechanical pressure of the tissue environment can impair cell proliferation (33, 34). Moreover, it has been predicted that cells in stiffer or more densely packed tissue environments, such as of an overgrown tumor, would require a more robust cell cortex and mitotic rounding response (9, 35). Indeed, although strategies for chemical perturbation of cell division have been pursued for decades (36), the advent of mechanical approaches opens the door to studies of physical perturbation. Our approach expands the applicability of in vitro cell mechanics studies by providing a platform to understand how confinement forces can affect mitosis (8). Further studies could lead to novel concepts, for example, perturbing cell division with a combination of cortex-weakening agents and external force (37). Finally and more broadly, precise methods to probe cell response to mechanical forces should advance our understanding of cell proliferation, motility, mechanosensitivity, cell-fate determination, and signaling dynamics in confined conditions more indicative of the in vivo microenvironment.
Materials and Methods
Processing of FIB-Sculpted Cantilevers.
Noncoated N-type silicon cantilevers (ACL-TL-10; AppNano) with length, width, and thickness of 225, 60, and 7.8 µm, respectively, were remodeled (Fig. S1A) using FIB-SEM technology (Helios NanoLab 650; FEI) to compensate for the 10° tilt angle intrinsic to the AFM setup. To this end, the cantilever chip was first mounted vertically on the sample holder and brought into the FIB-SEM chamber via the air-lock system. The sample was then tilted by 52° such that the gallium ion beam was perpendicular to the side of the mounted cantilever (Fig. S2A). The front end of the cantilever was milled to an angle of 10° over its whole width (60 µm) using 30-kV ion beam acceleration voltage and 21-nA beam current. Subsequently, the cantilever beam thickness was reduced to ∼2–3 µm between the base of the cantilever and the rear end of the newly created 10° plane using 30-kV ion beam acceleration voltage and 47-nA beam current, leaving a wedge-shaped structure at the end of a thin beam (Fig. S1B). Length, width, and thickness of the modified cantilevers were assessed using SEM and optical imaging (Fig. S2). According to experimental needs, cantilever thickness could be tuned ranging from 1 to 3 µm, resulting in spring constants from 0.1 to 2.7 N·m−1 (Fig. S2E).
Characterization of FIB-Sculpted Cantilevers.
AFM reverse imaging (38) in force–volume mode was performed to assess the quality of the modified cantilevers. To this end, cantilevers were mounted on an atomic force microscope (NanoWizard II; JPK Instruments) and calibrated using point contact with ∼20-µm substrate-immobilized polystyrene beads followed by the thermal noise method (39) as previously described (19). The surface of the modified cantilevers was scanned over an inverted immobilized tip (MPP-11100-10 cantilever; Bruker) embedded in PDMS (Fig. S2), and force–volume images were analyzed to assess the surface topography and roughness using Gwyddion software (gwyddion.net) (Fig. S1 C and D).
AFM Setup and Calibration of FIB-Sculpted Cantilevers.
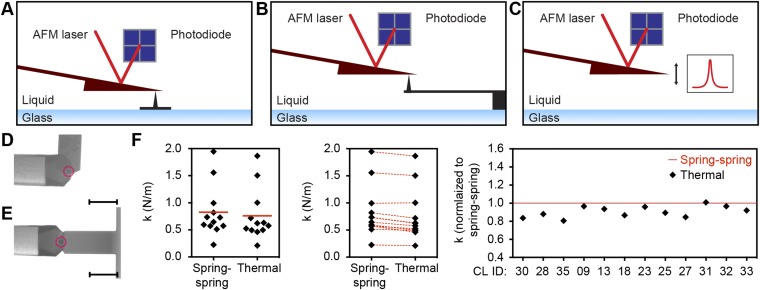
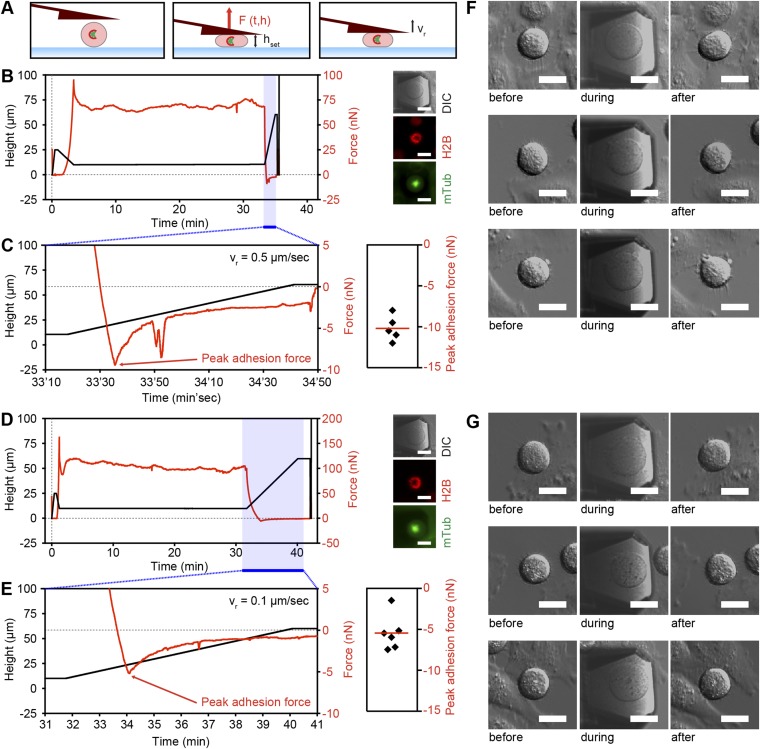
FIB-sculpted cantilevers were fixed on a standard JPK glass block and mounted in the atomic force microscope head (CellHesion 200; JPK Instruments). Cantilever calibration was carried out using the thermal noise method as described above. Alternatively, cantilever deflection sensitivity was determined using point contact with an inverted cantilever tip (OMCL-RC800PSA; Olympus) glued to the substrate. Then, spring constants of the FIB-sculpted cantilevers were calibrated using the spring–spring method against a reference cantilever (OMCL-RC800PSA; Olympus) (40), which beforehand was calibrated using the Sader et al. method (41). For the FIB-sculpted cantilevers used in this study, the differences in the spring constants determined by both methods were between 1% and 19% (Fig. S9), which lies within the accuracy of the thermal noise method (39, 42). Therefore, we consider the thermal noise method to be a suitable calibration approach. The FIB-sculpted cantilevers could typically be used repeatedly, because, similar to earlier work (21), the confined mitotic cells did not stick to the cantilever but rather remained adherent to the glass surface after the experiment (Fig. S10). Thus, confinement of a set of cells could be carried out sequentially in the same dish without intermediate washing steps, and one FIB-sculpted cantilever could be used for many consecutive experiments. If needed in future work, the cantilevers could be cleaned using detergents, bleach, or sulfuric acid. For experiments where cell adhesion to the FIB-sculpted cantilevers could be problematic, we suggest chemical passivation of the cantilever.
Fig. S9.
Comparison of thermal noise and spring–spring calibration methods for the FIB-sculptured cantilevers used in this study. (A–C) Schematics of the calibration of FIB-sculpted cantilevers. Deflection sensitivity determination (A) against an inverted cantilever tip (Olympus; OMCL-RC800PSA; length 200 µm, width 40 µm) glued onto a glass-bottom Petri dish followed by spring constant determination by either (B) pressing the FIB-sculpted cantilever against a reference cantilever [Olympus; OMCL-RC800PSA; length 100 µm, width 40 µm; spring constant determined by the Sader et al. method (41): 0.651 N/m] or by (C) applying the thermal noise calibration method. (D and E) Sample DIC images of a FIB-sculpted cantilever pressed (D) against a fixed inverted cantilever tip and (E) against the reference cantilever for calibration by the spring–spring method. (Scale bars, 50 µm.) Red circles indicate the position of the inverted cantilever tip. (F) Spring constants of 12 FIB-sculpted cantilevers determined by the spring–spring method against a reference cantilever (spring-spring) and by using the thermal noise calibration method (thermal). Each black diamond represents one cantilever calibration. CL ID, identification number of FIB-sculpted cantilever; k, spring constant. Red bars, mean. Red dashed lines connect spring constants of the same cantilever determined with the two methods. Extended red line, the spring constant determined using the spring–spring method, normalized to 1.
Fig. S10.
Quantifying the adhesion force of mitotic HeLa cells to FIB-sculpted cantilevers. (A) Schematic representation of a height confinement experiment on a HeLa cell arrested in prometaphase by the Eg5 inhibitor STC. (Left) Positioning of the FIB-sculpted cantilever above the cell of interest. (Middle) A cell confined to a constant height. (Right) Retraction of the FIB-sculpted cantilever with constant speed vr. (B) (Left) Representative force trace of an STC-arrested cell confined to a height of 10 µm for more than 30 min followed by cantilever retraction with a constant speed of 0.5 µm/s. Red trace, force. Black trace, cantilever height. (Right) DIC, mCherry-H2B, and mTubulin-GFP (mTub) images of the confined cell. (C) (Left) An expanded view of adhesion force during cantilever retraction (time frame colored blue in B). Red arrow, peak adhesion force. (Right) Peak adhesion forces of five cells submitted to the conditions exemplified in B. Each black diamond represents the peak adhesion force of one cell. Red bar, mean. (D) (Left) Representative force trace of an STC-arrested cell confined to a height of 10 µm for more than 30 min followed by cantilever retraction with a constant speed of 0.1 µm/s. (Right) DIC, mCherry-H2B, and mTubulin-GFP images of the confined cell. (E) (Left) Expanded view of the adhesion force during cantilever retraction (time frame colored blue in D). (Right) Peak adhesion forces of six cells submitted to the conditions exemplified in D. Each black diamond represents the peak adhesion force of one cell. Red bar, mean. (F and G) Sample DIC images of three STC-arrested HeLa cells before (Left), during (Middle), and after (Right) confinement to a height of 10 µm and subsequent cantilever retraction with a constant speed of 0.5 (G) and 0.1 (F) µm/s. (Scale bars, 20 µm.)
Cell Culture.
HeLa Kyoto cells expressing mouse tubulin-GFP and human H2B-mCherry or Lifeact-mCherry and human MYH9-GFP were seeded on glass-bottom Petri dishes (FluoroDish; WPI) in culture medium: DMEM (high-glucose, GlutaMAX supplement, pyruvate; Life Technologies) supplemented with 10% (vol/vol) FBS (Life Technologies), 100 µg·mL−1 penicillin, 100 µg·mL−1 streptomycin, and selection antibiotics 0.5 mg·mL−1 geneticin and 0.5 µg·mL−1 puromycin (Life Technologies), and cultured at 37 °C and 5% CO2 until further use (24–48 h). Before AFM experiments, medium was changed to microscopy medium: DMEM (high-glucose, pyruvate; Life Technologies) with 4 mM NaHCO3 (Sigma-Aldrich) buffered with 20 mM Hepes (AppliChem) at pH 7.4 supplemented with 10% (vol/vol) FBS, 100 µg·mL−1 penicillin, and 100 µg·mL−1 streptomycin. For experiments on chemically arrested mitotic cells, 2 µM (+)-S-trityl-l-cysteine (Sigma-Aldrich) was added to the microscopy medium 2 h before measurements.
Acknowledgments
We thank Jonne Helenius, Subramanian P. Ramanathan, and Michael Krieg for feedback and ideas, are grateful to Torsten Mueller and Roxane Sayde for comments on the manuscript, and acknowledge the Hyman laboratory (Dresden) for contributing cell lines as well as Matthieu Piel for stimulating discussion on blebbing under confinement. This work was supported by the Swiss National Science Foundation (Advanced Mobility Fellowship to M.P.S. and Grant 31003A_138093 to D.J.M.), Eidgenössische Technische Hochschule Research Grant ETH-05 11-2, and European Molecular Biology Organization (Long-Term Fellowship 506-2012 to D.M.-M.).
Footnotes
The authors declare no conflict of interest.
This article is a PNAS Direct Submission.
This article contains supporting information online at www.pnas.org/lookup/suppl/doi:10.1073/pnas.1502029112/-/DCSupplemental.
References
- 1.Stewart MP, et al. Hydrostatic pressure and the actomyosin cortex drive mitotic cell rounding. Nature. 2011;469(7329):226–230. doi: 10.1038/nature09642. [DOI] [PubMed] [Google Scholar]
- 2.Lancaster OM, et al. Mitotic rounding alters cell geometry to ensure efficient bipolar spindle formation. Dev Cell. 2013;25(3):270–283. doi: 10.1016/j.devcel.2013.03.014. [DOI] [PubMed] [Google Scholar]
- 3.Ramanathan SP, et al. Cdk1-dependent mitotic enrichment of cortical myosin II promotes cell rounding against confinement. Nat Cell Biol. 2015;17(2):148–159. doi: 10.1038/ncb3098. [DOI] [PubMed] [Google Scholar]
- 4.Meyer EJ, Ikmi A, Gibson MC. Interkinetic nuclear migration is a broadly conserved feature of cell division in pseudostratified epithelia. Curr Biol. 2011;21(6):485–491. doi: 10.1016/j.cub.2011.02.002. [DOI] [PubMed] [Google Scholar]
- 5.Luxenburg C, Pasolli HA, Williams SE, Fuchs E. Developmental roles for Srf, cortical cytoskeleton and cell shape in epidermal spindle orientation. Nat Cell Biol. 2011;13(3):203–214. doi: 10.1038/ncb2163. [DOI] [PMC free article] [PubMed] [Google Scholar]
- 6.Kondo T, Hayashi S. Mitotic cell rounding accelerates epithelial invagination. Nature. 2013;494(7435):125–129. doi: 10.1038/nature11792. [DOI] [PubMed] [Google Scholar]
- 7.Nakajima Y, Meyer EJ, Kroesen A, McKinney SA, Gibson MC. Epithelial junctions maintain tissue architecture by directing planar spindle orientation. Nature. 2013;500(7462):359–362. doi: 10.1038/nature12335. [DOI] [PubMed] [Google Scholar]
- 8.Hoijman E, Rubbini D, Colombelli J, Alsina B. Mitotic cell rounding and epithelial thinning regulate lumen growth and shape. Nat Commun. 2015;6:7355. doi: 10.1038/ncomms8355. [DOI] [PubMed] [Google Scholar]
- 9.Cadart C, Zlotek-Zlotkiewicz E, Le Berre M, Piel M, Matthews HK. Exploring the function of cell shape and size during mitosis. Dev Cell. 2014;29(2):159–169. doi: 10.1016/j.devcel.2014.04.009. [DOI] [PubMed] [Google Scholar]
- 10.Tse HT, Weaver WM, Di Carlo D. Increased asymmetric and multi-daughter cell division in mechanically confined microenvironments. PLoS One. 2012;7(6):e38986. doi: 10.1371/journal.pone.0038986. [DOI] [PMC free article] [PubMed] [Google Scholar]
- 11.Gerber C, Lang HP. How the doors to the nanoworld were opened. Nat Nanotechnol. 2006;1(1):3–5. doi: 10.1038/nnano.2006.70. [DOI] [PubMed] [Google Scholar]
- 12.Benoit M, Gabriel D, Gerisch G, Gaub HE. Discrete interactions in cell adhesion measured by single-molecule force spectroscopy. Nat Cell Biol. 2000;2(6):313–317. doi: 10.1038/35014000. [DOI] [PubMed] [Google Scholar]
- 13.Matzke R, Jacobson K, Radmacher M. Direct, high-resolution measurement of furrow stiffening during division of adherent cells. Nat Cell Biol. 2001;3(6):607–610. doi: 10.1038/35078583. [DOI] [PubMed] [Google Scholar]
- 14.Cross SE, Jin YS, Rao J, Gimzewski JK. Nanomechanical analysis of cells from cancer patients. Nat Nanotechnol. 2007;2(12):780–783. doi: 10.1038/nnano.2007.388. [DOI] [PubMed] [Google Scholar]
- 15.Engel A, Gaub HE. Structure and mechanics of membrane proteins. Annu Rev Biochem. 2008;77:127–148. doi: 10.1146/annurev.biochem.77.062706.154450. [DOI] [PubMed] [Google Scholar]
- 16.Müller DJ, Dufrêne YF. Atomic force microscopy as a multifunctional molecular toolbox in nanobiotechnology. Nat Nanotechnol. 2008;3(5):261–269. doi: 10.1038/nnano.2008.100. [DOI] [PubMed] [Google Scholar]
- 17.Rosenbluth MJ, Lam WA, Fletcher DA. Force microscopy of nonadherent cells: A comparison of leukemia cell deformability. Biophys J. 2006;90(8):2994–3003. doi: 10.1529/biophysj.105.067496. [DOI] [PMC free article] [PubMed] [Google Scholar]
- 18.Stewart MP, Toyoda Y, Hyman AA, Müller DJ. Tracking mechanics and volume of globular cells with atomic force microscopy using a constant-height clamp. Nat Protoc. 2012;7(1):143–154. doi: 10.1038/nprot.2011.434. [DOI] [PubMed] [Google Scholar]
- 19.Stewart MP, et al. Wedged AFM-cantilevers for parallel plate cell mechanics. Methods. 2013;60(2):186–194. doi: 10.1016/j.ymeth.2013.02.015. [DOI] [PubMed] [Google Scholar]
- 20.Skoufias DA, et al. S-trityl-L-cysteine is a reversible, tight binding inhibitor of the human kinesin Eg5 that specifically blocks mitotic progression. J Biol Chem. 2006;281(26):17559–17569. doi: 10.1074/jbc.M511735200. [DOI] [PubMed] [Google Scholar]
- 21.Fischer-Friedrich E, Hyman AA, Jülicher F, Müller DJ, Helenius J. Quantification of surface tension and internal pressure generated by single mitotic cells. Sci Rep. 2014;4:6213. doi: 10.1038/srep06213. [DOI] [PMC free article] [PubMed] [Google Scholar]
- 22.Lancaster OM, Baum B. Shaping up to divide: Coordinating actin and microtubule cytoskeletal remodelling during mitosis. Semin Cell Dev Biol. 2014;34:109–115. doi: 10.1016/j.semcdb.2014.02.015. [DOI] [PubMed] [Google Scholar]
- 23.Itabashi T, et al. Mechanical impulses can control metaphase progression in a mammalian cell. Proc Natl Acad Sci USA. 2012;109(19):7320–7325. doi: 10.1073/pnas.1116749109. [DOI] [PMC free article] [PubMed] [Google Scholar]
- 24.Minc N, Piel M. Predicting division plane position and orientation. Trends Cell Biol. 2012;22(4):193–200. doi: 10.1016/j.tcb.2012.01.003. [DOI] [PubMed] [Google Scholar]
- 25.Charras GT, Coughlin M, Mitchison TJ, Mahadevan L. Life and times of a cellular bleb. Biophys J. 2008;94(5):1836–1853. doi: 10.1529/biophysj.107.113605. [DOI] [PMC free article] [PubMed] [Google Scholar]
- 26.Maliga Z, et al. A genomic toolkit to investigate kinesin and myosin motor function in cells. Nat Cell Biol. 2013;15(3):325–334. doi: 10.1038/ncb2689. [DOI] [PubMed] [Google Scholar]
- 27.Weafer PP, et al. Stability enhancement of an atomic force microscope for long-term force measurement including cantilever modification for whole cell deformation. Rev Sci Instrum. 2012;83(9):093709. doi: 10.1063/1.4752023. [DOI] [PubMed] [Google Scholar]
- 28.Kuhn J, Dumont S. Imaging and physically probing kinetochores in live dividing cells. Methods Cell Biol. 2014;123:467–487. doi: 10.1016/B978-0-12-420138-5.00025-2. [DOI] [PMC free article] [PubMed] [Google Scholar]
- 29.Dumont S, Mitchison TJ. Compression regulates mitotic spindle length by a mechanochemical switch at the poles. Curr Biol. 2009;19(13):1086–1095. doi: 10.1016/j.cub.2009.05.056. [DOI] [PMC free article] [PubMed] [Google Scholar]
- 30.Tinevez JY, et al. Role of cortical tension in bleb growth. Proc Natl Acad Sci USA. 2009;106(44):18581–18586. doi: 10.1073/pnas.0903353106. [DOI] [PMC free article] [PubMed] [Google Scholar]
- 31.Liu YJ, et al. Confinement and low adhesion induce fast amoeboid migration of slow mesenchymal cells. Cell. 2015;160(4):659–672. doi: 10.1016/j.cell.2015.01.007. [DOI] [PubMed] [Google Scholar]
- 32.Ruprecht V, et al. Cortical contractility triggers a stochastic switch to fast amoeboid cell motility. Cell. 2015;160(4):673–685. doi: 10.1016/j.cell.2015.01.008. [DOI] [PMC free article] [PubMed] [Google Scholar]
- 33.Desmaison A, Frongia C, Grenier K, Ducommun B, Lobjois V. Mechanical stress impairs mitosis progression in multi-cellular tumor spheroids. PLoS One. 2013;8(12):e80447. doi: 10.1371/journal.pone.0080447. [DOI] [PMC free article] [PubMed] [Google Scholar]
- 34.Alessandri K, et al. Cellular capsules as a tool for multicellular spheroid production and for investigating the mechanics of tumor progression in vitro. Proc Natl Acad Sci USA. 2013;110(37):14843–14848. doi: 10.1073/pnas.1309482110. [DOI] [PMC free article] [PubMed] [Google Scholar]
- 35.Matthews HK, Baum B. The metastatic cancer cell cortex: An adaptation to enhance robust cell division in novel environments? BioEssays. 2012;34(12):1017–1020. doi: 10.1002/bies.201200109. [DOI] [PubMed] [Google Scholar]
- 36.Manchado E, Guillamot M, Malumbres M. Killing cells by targeting mitosis. Cell Death Differ. 2012;19(3):369–377. doi: 10.1038/cdd.2011.197. [DOI] [PMC free article] [PubMed] [Google Scholar]
- 37.Stewart MP, Toyoda Y, Hyman AA, Muller DJ. Force probing cell shape changes to molecular resolution. Trends Biochem Sci. 2011;36(8):444–450. doi: 10.1016/j.tibs.2011.05.001. [DOI] [PubMed] [Google Scholar]
- 38.Slattery AD, Blanch AJ, Quinton JS, Gibson CT. Accurate measurement of atomic force microscope cantilever deflection excluding tip-surface contact with application to force calibration. Ultramicroscopy. 2013;131:46–55. doi: 10.1016/j.ultramic.2013.03.009. [DOI] [PubMed] [Google Scholar]
- 39.Hutter JL, Bechhoefer J. Calibration of atomic-force microscope tips. Rev Sci Instrum. 1993;64(7):1868–1873. [Google Scholar]
- 40.Torii A, Sasaki M, Hane K, Okuma S. A method for determining the spring constant of cantilevers for atomic force microscopy. Meas Sci Technol. 1996;7(2):179–184. [Google Scholar]
- 41.Sader JE, Chon JWM, Mulvaney P. Calibration of rectangular atomic force microscope cantilevers. Rev Sci Instrum. 1999;70(10):3967–3969. [Google Scholar]
- 42.te Riet J, et al. Interlaboratory round robin on cantilever calibration for AFM force spectroscopy. Ultramicroscopy. 2011;111(12):1659–1669. doi: 10.1016/j.ultramic.2011.09.012. [DOI] [PubMed] [Google Scholar]
- 43.Thoumine O, Ott A. Time scale dependent viscoelastic and contractile regimes in fibroblasts probed by microplate manipulation. J Cell Sci. 1997;110(Pt 17):2109–2116. doi: 10.1242/jcs.110.17.2109. [DOI] [PubMed] [Google Scholar]
- 44.Caille N, Thoumine O, Tardy Y, Meister JJ. Contribution of the nucleus to the mechanical properties of endothelial cells. J Biomech. 2002;35(2):177–187. doi: 10.1016/s0021-9290(01)00201-9. [DOI] [PubMed] [Google Scholar]
- 45.Konrad J, Zaefferer S, Raabe D. Investigation of orientation gradients around a hard Laves particle in a warm-rolled Fe3Al-based alloy using a 3D EBSD-FIB technique. Acta Mater. 2006;54(5):1369–1380. [Google Scholar]


