Significance
Altered expression of mitochondrial DNA (mtDNA) is heavily implicated in human disease and aging, but the basic organizational unit of mtDNA, the mitochondrial nucleoid, is poorly understood. Here, we have used a combination of biochemistry, superresolution microscopy, and electron microscopy to show that mammalian mitochondrial nucleoids have an irregular ellipsoidal shape and typically contain a single copy of mtDNA. Furthermore, we show that the nucleoid ultrastructure is independent of cellular mtDNA copy number and that the core nucleoid structure is formed by cross-strand binding of mitochondrial transcription factor A (TFAM) to a single copy of mtDNA. The clarification of the ultrastructure of the mammalian mitochondrial nucleoid provides the fundamental basis for the understanding of regulation of mtDNA maintenance and expression in mammals.
Keywords: nucleoids, mitochondria, cryo-ET, STED, nanoscopy
Abstract
Mammalian mitochondrial DNA (mtDNA) is packaged by mitochondrial transcription factor A (TFAM) into mitochondrial nucleoids that are of key importance in controlling the transmission and expression of mtDNA. Nucleoid ultrastructure is poorly defined, and therefore we used a combination of biochemistry, superresolution microscopy, and electron microscopy to show that mitochondrial nucleoids have an irregular ellipsoidal shape and typically contain a single copy of mtDNA. Rotary shadowing electron microscopy revealed that nucleoid formation in vitro is a multistep process initiated by TFAM aggregation and cross-strand binding. Superresolution microscopy of cultivated cells showed that increased mtDNA copy number increases nucleoid numbers without altering their sizes. Electron cryo-tomography visualized nucleoids at high resolution in isolated mammalian mitochondria and confirmed the sizes observed by superresolution microscopy of cell lines. We conclude that the fundamental organizational unit of the mitochondrial nucleoid is a single copy of mtDNA compacted by TFAM, and we suggest a packaging mechanism.
The thousands of copies of mitochondrial DNA (mtDNA) in mammalian cells encode 13 essential subunits of the mitochondrial oxidative phosphorylation system, along with 2 rRNAs and 22 tRNAs (1). Despite its few genes, the mtDNA of ∼16 kb is essential for biogenesis of the oxidative phosphorylation system, which produces the energy currency ATP used for a variety of metabolic reactions (1). Mutations in mtDNA are an important cause of human disease and are heavily implicated in the aging process (2, 3). After the discovery of mtDNA by electron microscopy (EM) of vertebrate mitochondria in the early 1960s, it soon became evident that this circular molecule with a contour length of ∼5 μm must be compacted to fit within a mitochondrion, which typically has a width of ∼0.5 μm (4). Subsequent light microscopy studies showed that mtDNA is present in cells as hundreds of discrete condensed spots, denoted as mitochondrial nucleoids, each with a diameter of a few hundred nanometers (5–7). The existence of nucleoids in mammalian cells has been documented in detail with a variety of light microscopy approaches (8), but their true size has been much debated as conventional light microscopy cannot resolve structures smaller than ∼250 nm (9). It came as a surprise when superresolution microscopy [stimulated emission depletion (STED) nanoscopy] showed that nucleoids in a variety of mammalian species had a mean diameter below ∼100 nm, which was much smaller than anticipated (6). An independent approach using different forms of superresolution microscopy [photoactivatable localization microscopy (PALM), interferometric PALM (iPALM), and direct stochastic optical reconstruction microscopy (dSTORM)] confirmed that the mean diameter of nucleoids is ∼110 nm in human cells (10).
To date, mitochondrial transcription factor A (TFAM) is the only protein that fulfills a stringent definition of a structural component that packages mtDNA in the mammalian nucleoid (8). TFAM is very abundant, fully coats mtDNA (11, 12), and is essential for mtDNA maintenance (1). In addition to its function in mtDNA compaction, TFAM is also an essential component of the mammalian mtDNA transcription initiation complex (13). It specifically binds the mitochondrial promoters to recruit the mitochondrial RNA polymerase (POLRMT), which, in turn, recruits mitochondrial transcription factor B2 (14, 15). Crystallographic studies have revealed that TFAM induces a 180° U-turn when bound to promoters or unspecific mtDNA sequences (16–18). TFAM contains two high mobility group (HMG)-box domains (HMG-box A and B) that each intercalate into the minor groove of a half-site of a DNA duplex. Between the two HMG-box domains is a helical linker with a positively charged surface that interacts with the negatively charged backbone of the DNA (16, 17). TFAM has the capacity to increase the flexibility of DNA to promote compaction (19, 20). However, the mechanism of mtDNA compaction by TFAM is currently under debate. Apart from imposing U-turns, TFAM can also bind to nonspecific DNA sequences in a cooperative manner to form stable protein patches (19). Beyond DNA bending, dimerization of TFAM has been reported to be necessary for full compaction of mtDNA into nucleoids (18, 20).
Although important biophysical principles for TFAM-mediated mtDNA compaction are beginning to be understood, a number of properties of the mammalian nucleoids, such as their morphology and mtDNA content, are subject to considerable debate. Estimates of the mtDNA copy number per nucleoid, performed in the pre-superresolution microscopy era, had yielded values of 2–10 copies of mtDNA per nucleoid (5, 7, 21, 22). With STED microscopy a previously unrecognized clustering of nucleoids was discovered and the cell was found to contain ∼60% more nucleoids than previously estimated (6). As a consequence, the number of mtDNA molecules per nucleoid in human fibroblasts was reported to be as low as ∼1.4 in human cells (6). However, this number was questioned by another study that reported approximately three mtDNA molecules per nucleoid using confocal microscopy (10). Also, the shape of the mitochondrial nucleoid as determined by superresolution microscopy is disputed. Ellipsoid contours of nucleoids have been reported (10, 23), whereas we have documented a similar mean nucleoid diameter in a variety of mammalian species (6).
The organization of mtDNA into nucleoids is of fundamental interest as it will impact our understanding of mtDNA segregation in the germline and somatic tissues. Furthermore, replication and transcription of mtDNA is inhibited if the nucleoid is highly compacted (24). We have used biochemistry, STED superresolution microscopy, EM, and electron cryo-tomography (cryo-ET) of mammalian cells and nucleoids reconstituted in vitro to characterize the ultrastructure of the mammalian mitochondrial nucleoid. Here we report that the organizational unit of the mammalian mitochondrial nucleoid is a single copy of mtDNA compacted by TFAM aggregation and cross-strand binding. Furthermore, we report that most nucleoids have a slightly ellipsoidal shape. Our structural characterization of the mitochondrial nucleoid will provide the basis for future studies of its interaction with the mitochondrial gene expression machineries.
Results
Electron Microscopy Reveals That TFAM Packages Single mtDNA Molecules.
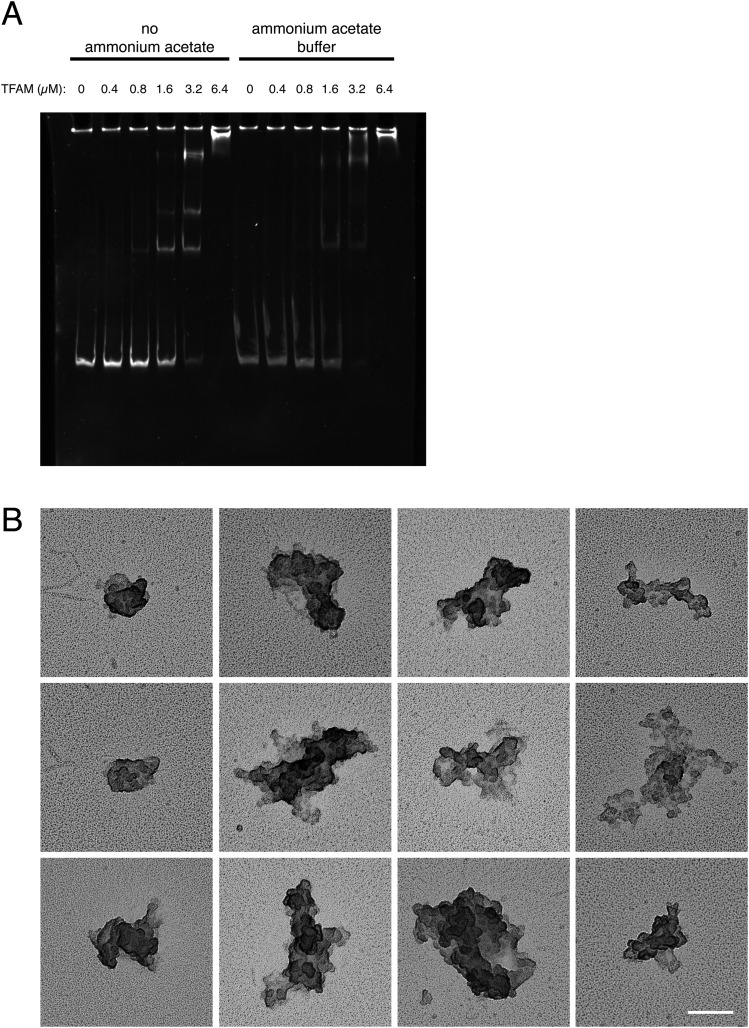
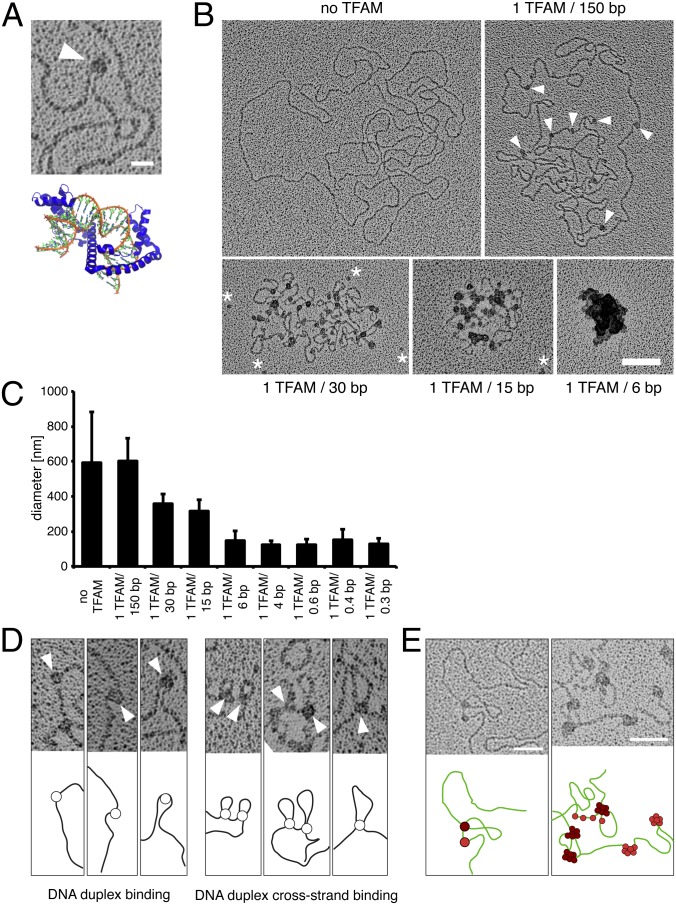
To gain further insight into nucleoid composition, we reconstituted nucleoids in vitro by mixing pure recombinant mouse TFAM with mtDNA. The resulting structures were imaged by low-angle rotary shadowing EM, which is a classical technique to visualize DNA-protein complexes. Before performing imaging experiments, we used electrophoretic gel mobility shift assays (EMSAs) to verify that TFAM binds DNA under the buffer conditions used for EM (Fig. S1A). Next, we performed EM on specimens consisting of a 20.2-kb plasmid containing the complete 16.3-kb mouse mtDNA (25), mixed with increasing amounts of TFAM. At low TFAM concentrations we observed several examples where TFAM was bound at sites where DNA was bent (Fig. 1A). Previous Förster resonance energy transfer (FRET) analyses have shown that TFAM bends DNA in solution (16, 18). The width of the bent structure that we observed by rotary shadowing is ∼3× the diameter of the DNA duplex, which agrees well with the width of the crystalized complex of a single TFAM molecule binding DNA and bending it by 180° (16–18). Next, we added increasing amounts of TFAM to the DNA and found progressive DNA compaction (Fig. 1B). At a low protein concentration (1 TFAM molecule/150 bp of DNA), single binding events were discernible. The TFAM molecules appeared as dark spots and were randomly distributed along the length of the DNA (Fig. 1B). When the TFAM concentration was increased further (1 TFAM/30 bp or more), more TFAM was bound and there was an increase in the size of the densities caused by TFAM binding to DNA (Fig. 1B). At high TFAM concentrations the densities on the DNA appeared to merge. Finally, at a concentration of 1 TFAM molecule per 6 bp or above, the DNA was completely compacted (Fig. 1 B and C). A further increase of the TFAM concentration did not result in any additional compaction of the DNA (Fig. 1C). The shapes of the nucleoids reconstituted in vitro varied, as did their degree of compaction, at high TFAM levels (Fig. S1B). The compacted TFAM/DNA complexes had an average diameter of 130 ± 39 nm (mean ± SD, n = 34) (Fig. 1C), slightly larger than mitochondrial nucleoids observed by superresolution microscopy (6, 10). This larger size is expected because during sample preparation for rotatory shadowing the TFAM/DNA complex is flattened against the support film of the EM grid. It is then covered by a layer of platinum, which inevitably increases the size of the complex. In addition, the DNA (20.2 kb) used for in vitro reconstitution of nucleoids is ∼24% larger than mouse mtDNA (16.3 kb), consistent with the larger size of the nucleoids generated in vitro (∼130 nm) compared with immuno-labeled nucleoids observed by STED microscopy (∼90 nm). In summary, we conclude that TFAM alone is sufficient to fully coat and compact mtDNA into structures closely resembling naturally occurring mitochondrial nucleoids.
Fig. S1.
(A) EMSA of DNA with increasing concentrations of recombinant TFAM. The stability of the formed complex was investigated with or without ammonium acetate in the buffer. Constant amounts of DNA templates were incubated with increasing amounts of recombinant TFAM protein in standard and ammonium acetate buffer. A clear shift of the DNA fragments was visible in the EMSA, indicating that the ammonium acetate required for EM does not interfere with TFAM–DNA binding. (B) Representative electron micrographs of in vitro-generated nucleoids with TFAM concentrations >1 TFAM/6 bp. (Scale bar: 100 nm.)
Fig. 1.
Electron microscopy reveals that TFAM packages single mtDNA molecules and that cross-strand TFAM binding is necessary for compaction of mtDNA. (A) Electron micrograph showing a DNA U-turn with TFAM bound (white arrowhead). (Scale bar: 20 nm.) Crystal structure of TFAM (blue) and DNA (orange/green) [Protein Data Bank ID code 3TMM (16)]. (B) Electron micrographs of spread DNA incubated with increasing concentrations of TFAM. TFAM molecules are indicated by white arrowheads. White asterisks mark unbound TFAM molecules. (Scale bar: 100 nm.) (C) Diameters of DNA incubated with increasing concentrations of recombinant TFAM protein by the mean of the long and short axes. Data are represented as mean ± SD, n = 134. (D) TFAM binds to DNA in two different ways. TFAM binds single DNA duplexes as beads on a string inducing bending of DNA (Left) or bridges two DNA duplexes resulting in loops (Right). TFAM molecules are indicated by white arrowheads. (E) TFAM binding to DNA as beads on a string (red) or by bridging two DNA duplexes (dark red). Subsequent binding preferentially occurs at sites already occupied by TFAM as can be observed by an increase in particle size. (Scale bars: 50 nm.)
Cross-Strand TFAM Binding Is Necessary for Compaction of mtDNA.
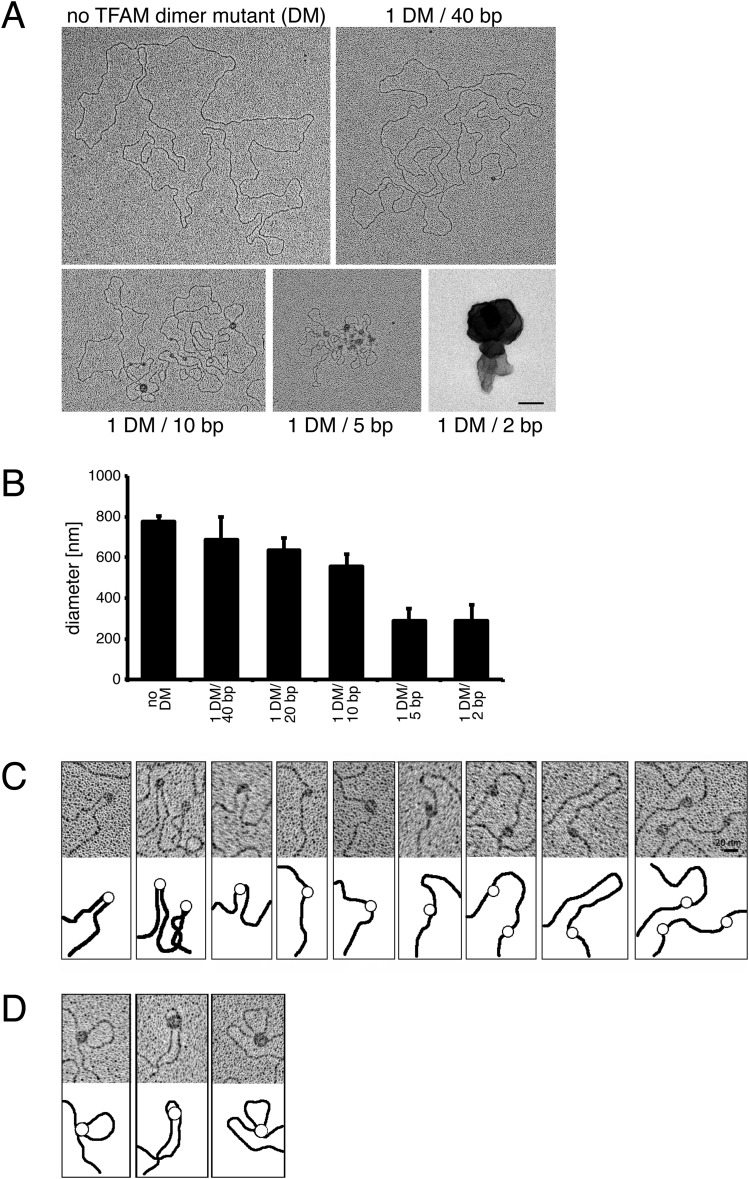
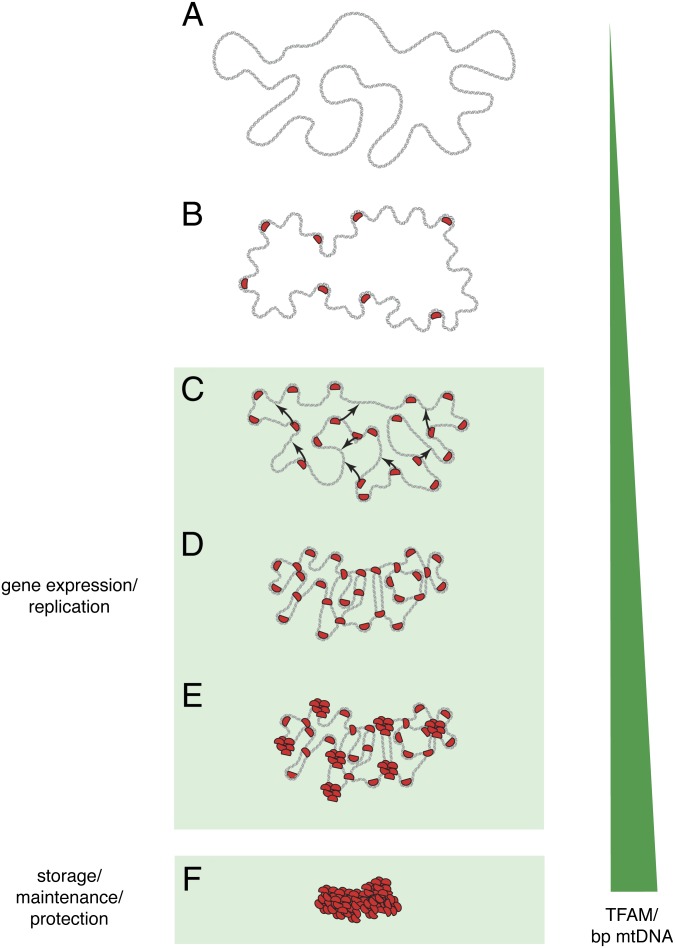
The EM studies of TFAM interaction with mtDNA in vitro showed different modes of compaction. First, TFAM molecules bound to a single DNA duplex appeared as beads on a string that appeared to be associated with bending and, in some cases, U-turns of the DNA (Fig. 1 A and B). We frequently observed single TFAM molecules that appeared to bridge two neighboring DNA duplexes, resulting in cross-strand binding and causing the intervening DNA to loop out (Fig. 1D). As the TFAM concentration increased, the binding events were not evenly distributed but accumulated in enlarged aggregates (Fig. 1B), consistent with the reported cooperative binding of TFAM to mtDNA (19). Although initial TFAM binding occurred as single events (Fig. 1D), the subsequent binding preferentially occurred at sites already occupied by TFAM, resulting in an increased size of the TFAM particles on the DNA (Fig. 1E). We observed such patches of cooperatively bound TFAM on both single DNA duplexes and cross-strand DNA duplexes (Fig. 1E). Recently, TFAM dimerization was reported to be required for DNA compaction because a TFAM dimer mutant with five substitutions (K95A, Y99F, E106A, E112A, and R116A) had a substantial defect in DNA compaction, but no defect in either DNA bending or transcriptional activation (18). We tested this TFAM dimer mutant in our rotary shadowing assay and found that it behaved similarly to wild-type TFAM and showed both binding to single DNA duplexes and cross-strand binding (Fig. S2 A–D). Furthermore, increasing concentrations of the dimerization-defective mutant led to increased sizes of TFAM aggregates bound to DNA and full compaction of DNA, although not the same diameter was reached as with wild-type TFAM (Fig. S2 A and B). We thus conclude that TFAM dimerization is not necessary for DNA compaction, although we cannot exclude a role for TFAM dimerization at high TFAM concentrations as observed in the crystal structures (18). Based on these findings, we propose that a combination of TFAM cross-strand binding and cooperative TFAM binding (Fig. 1B) leads to complete mtDNA compaction. We propose a stepwise model whereby TFAM compacts mtDNA into a mitochondrial nucleoid, based on the above-mentioned binding modes (Fig. 2).
Fig. S2.
(A) Electron micrographs of spread DNA incubated with increasing concentrations of TFAM dimer mutant (DM). (Scale bar: 100 nm.) (B) Quantification of the diameters of DNA incubated with increasing concentrations of TFAM DM protein by the mean of the long and short axis. Data are represented as mean ± SD; n = 82. (C and D) Electron micrographs showing that TFAM DM binds to DNA in two different ways. TFAM binds single DNA duplexes as beads on a string inducing bending of DNA (C) or bridges two DNA duplexes resulting in loops (D). (Scale bar: 20 nm.)
Fig. 2.
Model for packaging mtDNA into the mitochondrial nucleoid. (A) Outline of the naked mtDNA duplex (gray). (B) TFAM molecules (red) bind to mtDNA and induce bending. (C) TFAM bridges neighboring mtDNA duplexes (arrows) by cross-strand binding. (D) A combination of mtDNA duplex bending and cross-strand binding by TFAM compacts mtDNA. (E) Further compaction of mtDNA by cooperative TFAM binding into patches. (F) The final tightly packaged mtDNA in the mitochondrial nucleoid. The green triangle illustrates increasing concentration of TFAM protein per base pair mtDNA.
Mitochondrial Nucleoids Frequently Contain a Single mtDNA Molecule, and Their Intracellular Abundance Depends on Total mtDNA Copy Number.
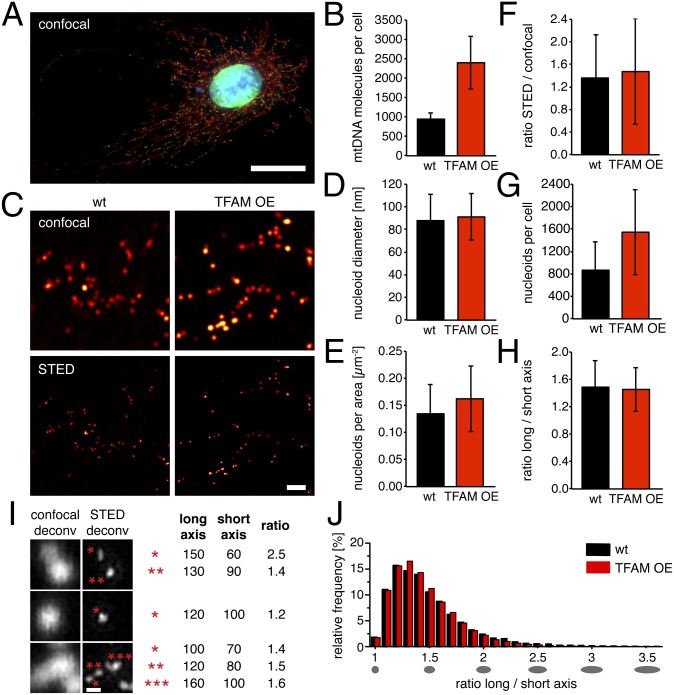
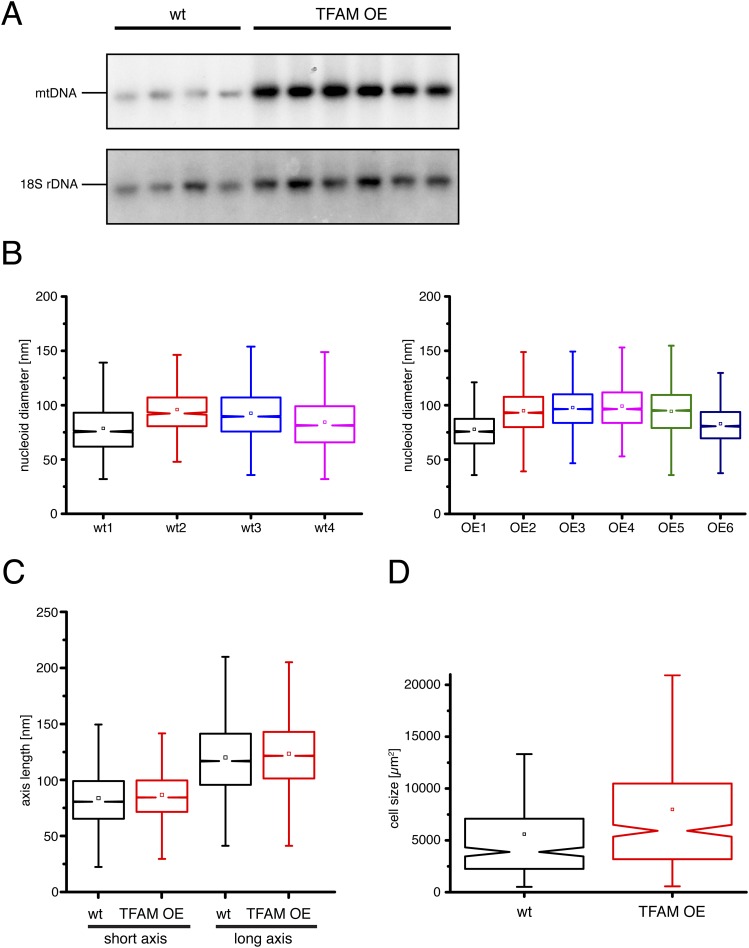
To study the effect of mtDNA copy number on the abundance and morphology of mitochondrial nucleoids in vivo, we generated primary mouse embryonic fibroblast (MEF) cell lines from mice expressing human TFAM (11), herein referred to as “TFAM overexpressor (OE)” MEFs (Fig. 3A). Analysis of TFAM OE MEFs showed that the mtDNA copy number was ∼2.5-fold higher in comparison with wild-type MEFs as determined by quantitative real-time PCR (qPCR) (Fig. 3B) and ∼2.4-fold higher as determined by Southern blot analysis (Fig. S3A). Next, we determined how this increase of total cellular mtDNA copy number affects the abundance and size of nucleoids. STED microscopy (Fig. 3C) showed that the mean diameters of the nucleoids visualized with double-stranded DNA antibodies were very similar in TFAM OE (91 ± 20 nm, mean ± SD, n = 46,397 nucleoids) and wild-type (88 ± 23 nm, n = 24,241) MEFs (Fig. 3D and Fig. S3B). We found an increase of both nucleoids per area (Fig. 3E) and cell size (Fig. S3D) in TFAM OE MEFs in comparison with wild-type MEFs. We have previously shown that a subset of the nucleoids clusters together in mammalian cells and therefore cannot be resolved as individual nucleoids by conventional confocal microscopy. The ratio between the numbers of nucleoids observed by STED versus confocal microscopy (Fig. 3F) was very similar in wild-type (1.36 ± 0.76, mean ± SD, n = 13,615 nucleoids) and TFAM OE MEFs (1.47 ± 0.94, n = 15,097), consistent with a similar degree of clustering of nucleoids as in human cells (6). Finally, we counted the total number of mitochondrial nucleoids per cell (Fig. 3G) and found more nucleoids in TFAM OE MEFs (1,564 ± 757 nucleoids/cell, mean ± SD, n = 408 analyzed cells) in comparison with wild-type MEFs (868 ± 510, n = 309). Calculations based on mtDNA copy number per cell (Fig. 3B) and the number of nucleoids per cell (Fig. 3G) gave ∼1.1 mtDNA molecules per nucleoid for wild-type MEFs and ∼1.5 mtDNA molecules per nucleoid in TFAM OE MEFs. These values from mouse cells are in good agreement with our previously reported number of 1.4 mtDNA molecules per nucleoid in human cells (6). In summary, our findings show that an increase of cellular mtDNA copy number does not alter the size of the nucleoid, results in only minor changes of the mean amount of mtDNA per nucleoid, and instead leads to an increase of the total number of nucleoids per cell.
Fig. 3.
Mitochondrial nucleoids frequently contain a single mtDNA molecule, their intracellular abundance depends on total mtDNA copy number, and most mitochondrial nucleoids have a slightly ellipsoid shape. (A) mtDNA (green, DNA antibodies) is localized in nucleoids in the tubular mitochondria (red, anti-TOM20) of MEFs. DAPI staining of the nucleus is in blue. (Scale bar: 25 µm.) (B) Number of mtDNA molecules per cell in MEFs by qPCR. (C) Comparison of confocal microscopy with superresolution STED microscopy of mitochondrial nucleoids visualized by DNA antibodies (deconvolved data). Shown are MEFs from wild-type (wt) and TFAM overexpressor (TFAM OE) mice. (Scale bar: 1 µm.) (D) Mean diameter of nucleoids labeled with DNA antibodies as determined by STED imaging; n = 70,638 nucleoids. (E) Nucleoids per cell area; n = 717 cells. (F) Ratio of the number of nucleoids detected by STED microscopy versus the number of nucleoids detected by confocal microscopy; n = 28,712 nucleoids. (G) Number of nucleoids per cell; n = 717 cells. (H) Ratio of long to short axis of nucleoids in MEFs imaged by STED microscopy; n = 70,638 nucleoids. (I) A variety of nucleoid shapes visualized by confocal and STED microscopy using DNA antibodies (deconvolved data). Asterisks mark the structures measured (in nm). The ratio is the ratio of long to short axis of the nucleoids. (Scale bar: 200 nm.) (J) Histogram of the relative frequency of binned ratios of long to short axis of nucleoids in wild-type and TFAM OE MEFs. Ellipsoids below the graph depict the resulting ellipses. We used six independent TFAM OE MEF lines and four independent wild-type lines for the analyses. wt: wild-type; TFAM OE: TFAM overexpressor. Data are represented as mean ± SD.
Fig. S3.
(A) Southern blot analysis of the mtDNA content in independent MEF lines. (B) Diameters of mitochondrial nucleoids imaged by STED microscopy for four independent wild-type (wt) and six independent TFAM OE MEF cell lines. (C) Quantification of the long and short axis length of nucleoids in MEFs imaged by STED microscopy. (D) Cell size of MEFs. n = 717 cells. wt: wild-type; TFAM OE: TFAM overexpressor. Notched boxplots: the boxed intervals contain the data points from the first to third quartiles of the distribution. With a size of 1.5 times the interquartile range, the whiskers encompass ∼99% of all data. The notches describe a confidence interval around the median, which equals the 95% confidence interval.
Most Mitochondrial Nucleoids Have an Ellipsoid That Is Close to Spherical Shape.
In a previous report, we found a similar mean size of ∼100 nm for antibody-labeled nucleoids in a variety of mammalian cell lines by STED microscopy, but no detailed analysis of nucleoid shape was performed (6). In another study that used PALM imaging, a mean nucleoid size of ∼110 nm was documented and the shape of individual nucleoids was reported to be pleiomorphic with ∼65% ellipsoidal nucleoids (10). To further investigate the shape of individual mitochondrial nucleoids, we used STED microscopy to measure the long and short axis of a large number of individual nucleoids and calculated the ratio between these two axes (Fig. 3 H–J). We analyzed a total of ∼70,000 nucleoids in wild-type and TFAM OE MEFs. In some cases we found heterogeneous contours (Fig. 3I) and the axial ratio indicated a slightly elongated shape (Fig. 3 H and I). The nucleoid morphology in TFAM OE MEFs was indistinguishable from wild-type MEFs, and we found similar irregular shapes, dimensions (Fig. 3D), and axial ratios (Fig. 3H and Fig. S3C). To better resolve any possible differences in the morphology of nucleoids in TFAM OE and wild-type MEFs, we determined the relative frequencies of different axial ratios (Fig. 3J) and found a very similar distribution. In both wild-type and TFAM OE MEFs, we observed low numbers of elongated nucleoids with a ratio of up to 3.6. However, the vast majority of nucleoids (70.3% = 32,594 nucleoids) had axis ratios between 1 and 1.5, which corresponds to ellipsoids approaching a spherical shape (Fig. 3J). Our results show that an increase of mtDNA copy number leads to more nucleoids without changing nucleoid morphology.
Mitochondrial Nucleoids Observed by Electron Cryo-ET in Situ Are Ellipsoid.
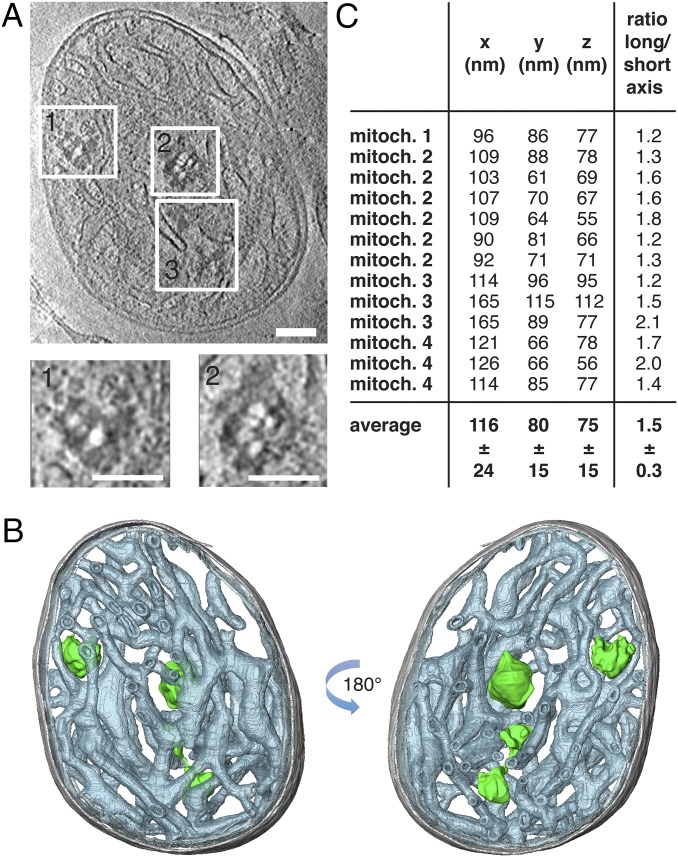
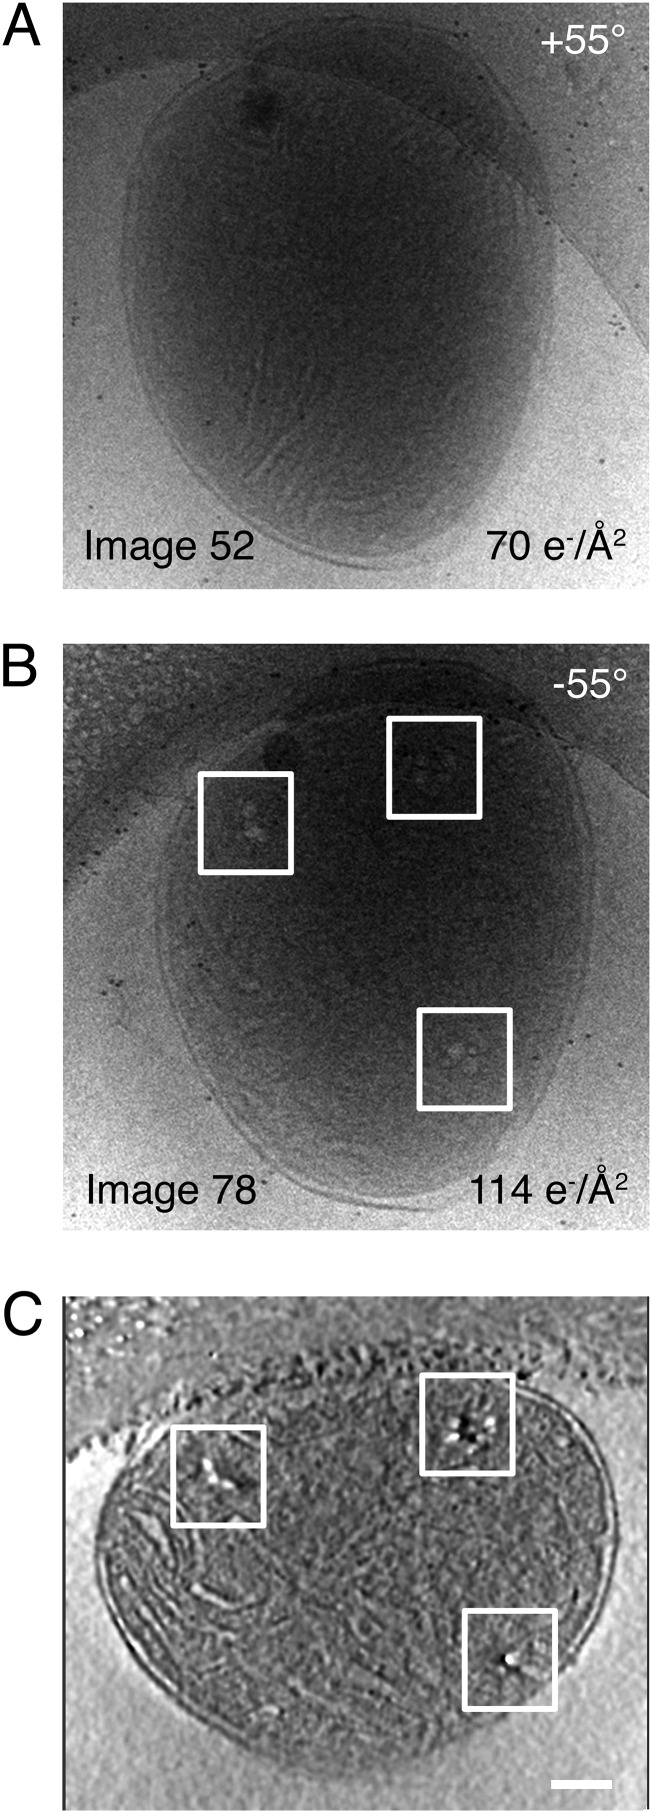
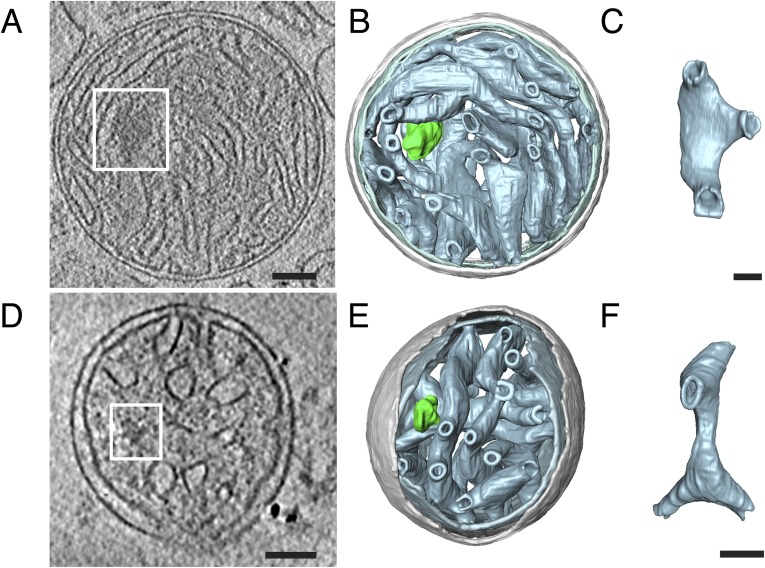
To image nucleoids at high resolution inside mitochondria, we examined isolated bovine heart mitochondria by cryo-ET, which delivers 3D volumes of intact cellular structures to a resolution of a few nanometers (26). Unfixed biological samples are highly sensitive to the electron beam and show signs of radiation damage with electron doses of 160–300 electrons/Å2 (27). Severe radiation damage results in a local release of gas molecules such as hydrogen, which can give rise to white “bubbles” in electron micrographs. DNA-protein complexes tend to bubble at lower electron doses than protein (28, 29). Taking advantage of this phenomenon, we were able to locate mitochondrial nucleoids in tomograms of isolated bovine heart mitochondria (Fig. 4 A and B; Figs. S4 and S5; Movie S1). The nucleoids were found in the matrix between the cristae tubules and were completely separated from the inner boundary membrane by numerous cristae. Because of limited resolution and the high background we cannot tell whether or not the nucleoids are attached to the cristae membranes. A total of 13 nucleoids were observed with 1–6 nucleoids per isolated mitochondrion. The average size of a nucleoid was x = 116 ± 24 nm, y = 80 ± 15 nm, and z = 75 ± 15 nm, and the axial ratio was 1.5 ± 0.3 (mean ± SD, n = 13 nucleoids) (Fig. 4C). The dimensions of the nucleoids observed in isolated mitochondria are thus in excellent agreement with the dimensions of nucleoids reconstituted in vitro (∼130 nm, Fig. 1) or nucleoids observed by superresolution microscopy (∼90–110 nm, Fig. 3) (6, 10).
Fig. 4.
Mitochondrial nucleoids observed by cryo-electron tomography in situ are ellipsoid. (A) Tomographic slice through a whole bovine heart mitochondrion showing mitochondrial nucleoids (boxed areas). White blobs are gas bubbles, caused by the interaction of the electron beam with the biological material (28). (Scale bars: 100 nm.) (B) Segmented surface representation of A showing position of mitochondrial nucleoids (green) in a bovine heart mitochondrion. Green: nucleoids; gray: outer membrane; gray-blue: cristae. (C) Dimensions and long to short axis ratio of 13 nucleoids from four tomographic volumes of isolated bovine heart mitochondria (mitoch.) (n = 13). See also Movie S1.
Fig. S4.
(A and B) Projection images #52 and #78 from a tomographic tilt series of a bovine heart mitochondrion showing mitochondrial nucleoids (boxed areas). The total number of projection images in the tilt series is 86. Total accumulated electron dose for the series was 130 electrons per Ångström squared (e−/Å2). The total accumulated electron dose for each image is displayed at the bottom right corner of the image. (C) Tomographic slice through a whole bovine heart mitochondrion showing mitochondrial nucleoids (boxed areas). (Scale bar: 100 nm.)
Fig. S5.
(A and D) Tomographic slice through a whole bovine heart mitochondrion showing mitochondrial nucleoids (boxed areas). (Scale bar: 100 nm.) (B and E) Segmented surface representation of A with D showing position of mitochondrial nucleoids (green) in a bovine heart mitochondrion. Green: nucleoids; gray: outer membrane; gray-blue: cristae. (C and F) Crista extracted from B and E showing crista morphology. (Scale bar: 50 nm.)
Discussion
Despite the fundamental importance of mammalian mitochondrial nucleoids, there is as yet no consensus on nucleoid ultrastructure or the number of mtDNA copies per nucleoid. To resolve these important issues, we used a combination of biochemistry and a range of imaging techniques, in particular EM of biochemically in vitro reconstituted nucleoids, cryo-ET of nucleoids present in isolated mitochondria, and STED superresolution microscopy of nucleoids present in MEFs. Based on these analyses, we present several lines of evidence to show that mammalian nucleoids typically contain a single copy of mtDNA: (i) We found ∼1.1 copies of mtDNA molecules per nucleoid in wild-type MEFs by performing calculations based on measurements of the total number of mtDNA per cell and STED microscopy imaging of the total number of nucleoids in single cells. Consistent with this estimate, we have previously reported that human fibroblasts contain ∼1.4 copies of mtDNA per nucleoid (6). (ii) EM imaging of biochemically reconstituted nucleoids, consisting of a single mtDNA molecule and TFAM, showed that they resembled those observed by STED microscopy of MEFs in shape and size. (iii) Cryo-ET of bovine mitochondria produced high-resolution images of nucleoids in situ, which indicated very similar sizes and shapes as nucleoids observed by rotary shadowing EM imaging of nucleoids reconstituted in vitro containing TFAM and a single mtDNA molecule or by STED microscopy in cells. (iv) Finally, an increase of mtDNA copy number per cell does not lead to an alteration in nucleoid morphology but rather increases the total number of nucleoids. The structure of the nucleoid is thus unaffected by the mtDNA copy number, consistent with the idea that each contains a single copy of packaged mtDNA. Taken together, our results strongly argue that most mammalian mitochondrial nucleoids contain one single copy of mtDNA. To further address the issue of nucleoid morphology, we applied 2D STED microscopy for detailed studies in MEFs and analyzed the lengths of long and short axes for a large number of nucleoids (n = 70,638). Consistent with results from others (10), we found that most nucleoids indeed were ellipsoidal but with less elongated shapes than previously reported. In fact, the majority (70.3%) of mouse mitochondrial nucleoids in our study were nearly spherical.
The ultrastructure of the mammalian nucleoid may be solely determined by binding of TFAM to mtDNA because TFAM is present at ∼1,000 copies per mtDNA molecule (6, 11) and has structural (16–18) and biophysical properties (19, 20, 24, 30) consistent with an important role in DNA compaction. However, this does not exclude that other proteins affect the packaging of mtDNA and determine nucleoid morphology (8). To address this question, we decided to reconstitute mitochondrial nucleoids in vitro by adding TFAM to single mtDNA molecules followed by high-resolution imaging of the resulting structures by rotary shadowing and EM. All of the reconstituted compacted nucleoids that we observed had highly irregular elongated shapes, consistent with the size and irregular shape of the nucleoid structures observed by STED microscopy of MEFs. The irregular shape of mitochondrial nucleoids suggests that the packaging of mtDNA is not an ordered, repetitive process, as seen when nuclear DNA is packaged by histones into nucleosomes or by protamines into toroids. Also, DNA-binding proteins, such as the bacterial protein RecA involved in homologous recombination, form very ordered structures when bound to DNA (31). In contrast, binding of TFAM to mtDNA seems to follow an almost random pattern. Rotary shadowing EM allowed us to see single TFAM molecules bound to mtDNA. Adding increasing amounts of TFAM to mtDNA did not result in a dispersed distribution of binding events but rather resulted in larger aggregates, consistent with cooperative binding (19). TFAM monomers are reported to slide along the DNA and are ∼100 times more likely to bind next to an already stationary TFAM patch than to naked DNA (19). In addition to single and cooperative binding events of TFAM to mtDNA, we also observed DNA loop formation by cross-strand binding. Importantly, all of the different binding modes were observed simultaneously, indicating that different binding modes coexist on the same mtDNA molecule and collectively contribute to mtDNA compaction. We observed extensive looping of DNA at high TFAM concentrations. Similar loops, consisting of compact rosettes that were constrained at their center, have been observed on electron micrographs of mtDNA in rat liver mitochondria on tissue sections (32). In addition, DNA looping has been observed by atomic force microscopy (AFM) studies of TFAM/DNA aggregates (20). At variance with our results and these previous reports, tethered particle movement (TPM) experiments effectively excluded looping when TFAM binds to DNA (19). It is possible that single-molecule experiments, involving immobilized DNA with a particle attached to the free end, do not fully reproduce the way in which untethered DNA molecules would behave in the presence of TFAM. Bending may well result in some DNA compaction, as suggested by others (19, 33), but cannot on its own explain the structures that we observed when reconstituting nucleoids in vitro. Based on our results and those of others, we suggest that looping is an important step in achieving DNA compaction and we present a model along these lines (Fig. 2).
There is an ongoing discussion whether TFAM binds DNA as a monomer or dimer. Based on noncontact AFM, it has been reported that TFAM always binds DNA as a dimer (20). The atomic structures of TFAM bound to the light strand promoter of mtDNA showed monomeric complexes (16, 17). Size-exclusion chromatography with in-line multiangle light-scattering analysis (16) and small-angle X-ray scattering analysis (17) further support the notion that TFAM binds DNA as a monomer. An independent approach based on optical tweezers and fluorescence microscopy concluded that TFAM binds DNA in solution as a monomer (19). However, very recently, two crystal structures of TFAM bound to the heavy strand promoter or to an unspecific mtDNA sequence showed evidence of dimerization (18). A reinterpretation of the previous structures (16, 17) showed that these also contained TFAM dimers, which initially had been attributed to crystal packaging artifacts (18). The dimerization surface involved the HMG-box A domain in both TFAM molecules (18). Further analysis with FRET assays showed that the TFAM–TFAM interaction occurred only in the presence of DNA of >200 bp in length and was dependent on five conserved amino acids in HMG-box A (18). Furthermore, dimerization-mutant TFAM molecules were reported to retain the capacity to bend DNA, as judged from FRET assays, but had lost their capacity to compact DNA on TPM assays (18). We tested the dimerization-defective TFAM mutant in our rotary shadowing EM assays and found that it had a very similar mode of DNA binding and compaction as wild-type TFAM, which argues against dimerization as an important mechanism for mtDNA compaction. An alternative possibility is that the observed DNA loops are formed by cross-strand binding of TFAM via each of its two DNA-binding HMG-boxes. According to this model, the first HMG-box would bind one DNA duplex and the second HMG-box a nearby different DNA duplex, thus resulting in cross-strand binding. If this model is true, one can envision a competition between DNA bending to form a U-turn and the DNA loop formation via cross-strand binding. Our findings suggest strongly that the DNA bending originates from monomeric binding of TFAM as the bound TFAM molecule was measured to have three times the diameter of the DNA duplex. However, further studies will be needed to resolve this issue.
In a correlative 3D superresolution fluorescence and EM study, elongated nucleoids were reported to interact with the cristae tips in mitochondria (23). However, the large size of the nucleoid, which would occupy most of the width of a crista, makes it difficult to determine whether this is due to specific molecular interactions that tether the nucleoids to the mitochondrial inner membrane, as reported in yeast (34), or if it is just fortuitous.
In summary, we report here that the typical mammalian nucleoid contains a single copy of mtDNA and has an irregular, slightly elongated structure. We propose that the mitochondrial nucleoid should be regarded as a structural unit generated by TFAM compaction of mtDNA. The complex interactions occurring at the nucleoid have been documented by cross-linking studies leading to the proposal of a layered nucleoid structure (35). It is important to recognize that most of the nucleoid volume is accounted for by a single mtDNA molecule fully coated with ∼1,000 TFAM molecules (6). The machineries for replication and transcription of mtDNA are inhibited if mtDNA is fully compacted, and it has been suggested that fluctuations in TFAM levels are the main determinant of the fraction of nucleoids that are available for mtDNA replication or transcription (24). The low number of highly elongated nucleoids that we observed by STED microscopy can perhaps be explained by ongoing mtDNA replication or transcription, whereas the highly compacted nucleoids may be for DNA storage. Consistent with this idea, bromodeoxyuridine, which is incorporated into newly synthesized DNA, labels only a subset of all nucleoids (5–7, 36). In the future, it will be important to determine the regulatory mechanism that selects a subset of the nucleoids for mtDNA replication and transcription.
Materials and Methods
Ethics Statement.
This study was performed in strict accordance with the recommendations and guidelines of the Federation of European Laboratory Animal Science Associations (FELASA). The protocol was approved by the Landesamt für Natur, Umwelt und Verbraucherschutz Nordrhein-Westfalen (LANUV) in Germany.
Purification of Recombinant TFAM.
His-tagged TFAM versions were expressed and purified over Ni2+ as previously described (14). The eluate was loaded on a heparin column equilibrated in H-0.3 buffer [25 mM Tris⋅HCl (pH 7.8), 0.5 mM EDTA, 1 mM DTT, 0.3 M NaCl; the number after the hyphen indicates the sodium chloride concentration in molar units] and eluted with a linear gradient (20 column volumes) of buffer H-0.3 to H-1.0.
EM and Cryo-ET.
EM and cryo-ET methods are described in SI Materials and Methods.
Cell Culture.
Primary MEFs were isolated from individual embryonic day 13.5 embryos and cultured as described before (6).
STED Microscopy, qPCR, and Western Blots.
STED microscopy, qPCR, and Western blots were performed as previously described (6).
SI Materials and Methods
EMSAs.
EMSA was performed as described previously (37).
Electron Microscopy.
Low-angle shadowing.
DNA (10 ng/µL) was mixed with various concentrations of TFAM in binding buffer [25 mM Tris⋅HCl (pH 7.8), 3 mM MgCl2, 150 mM NaCl] and incubated at room temperature for 30 min before being stored at 4 °C. Stored samples were diluted 1:10 with 4 mM Mg–acetate and applied to glow-discharged EM grids containing a continuous carbon support film. The grids were washed by placing them carbon-side down on 2 drops of 4 mM Mg–acetate for 5 min, stained with one drop of 0.02% (wt/vol) uranyl acetate in 30% ethanol for 1–4 min, and then washed again with 2 drops of distilled water. Excess solution was removed with filter paper and the dried grids were placed in a BAF 060 freeze-fracture system (BAL-TEC) for shadowing. Low-angle rotational shadowing was performed at room temperature, 3–4 × 10⁻⁷ mbar with an operating voltage and current of 1.6 V and 58–60 mA, respectively. Platinum/carbon (6 nm) was deposited at an angle of 10° using an evaporation rate of 0.05–0.09 nm/s. The thickness of deposition was monitored using a quartz crystal, and the stage revolution speed was 100 rpm. Grids were imaged at 15–25 kx using an EM208S transmission electron microscope (FEI) operating at 80 kV and equipped with a 1- × 1-k slow-scan CCD (Tietz, TVIPS) or a Gatan 2 × 2 k CCD (MSC TK 2048 1).
Cryo-ET.
Samples were diluted 1:1 with fiducial markers (6-nm gold particle conjugated with protein A, Aurion) and applied to glow-discharged quantifoil EM grids (R2/2, Cu 300 mesh, Quantifoil). Excess liquid was removed with filter paper (#4, Whatman), and samples were preserved by plunge-freezing in liquid ethane (27). Single-axis tilt image series (±60°, step size 2°) were recorded using the software XPLORE (FEI) on an Polara transmission electron microscope (FEI) operating at 300 kV and equipped with a postcolumn energy filter and a 2- × 2-k CCD (GIF Tridiem 863 Gatan). Images were taken with a specimen pixel size of 0.576 nm and a defocus of 7 µm. Tilt series were aligned using the gold fiducials, and tomographic volumes were reconstructed using the IMOD software package (38). Tomograms were filtered by nonlinear anisotropic diffusion to increase contrast (39) and manually segmented with the program AMIRA (FEI).
Southern Blots.
Southern blots were performed as described before (40). DNA was digested with SacI or PstI endonuclease. The probes were COXI, pAM1, or 18S.
In-Solution Digestion.
Samples were diluted with 100 mM ammonium bicarbonate to make a concentration of about 200 ng/µL according to the Bradford method. The tryptic digestion was performed by adding Trypsin Gold mass spectrometry grade (Promega) at a 1:50 (wt/wt) ratio and incubating at 37 °C overnight.
Protein Identification and Quantification with LC-MS/MS.
Protein identification and quantification were performed with a Xevo Q-Tof (Waters) coupled with a nanoACQUITY UPLC (Waters). The digest was 10-fold diluted with 0.1% of formic acid. One microliter of standard alcohol dehydrogenase 1 tryptic digest (50 fmol/µL) (Waters) was mixed with 0.5 µL of the sample digest. A total of 1.5 µL of the mixture was loaded into a C18 trap column of 180 µm × 20 mm with 10 µL/min of 3% of solvent A (0.1% formic acid) for 2 min. The digest was then separated and eluted with an analytical column of 75 µm × 150 mm C18 BEH 1.7 µm (Waters). The gradient was 3–35% of acetonitrile in 0.1% formic acid over 10 min at a flow rate of 400 nL/min. The Xevo Q-Tof was operated in LC/MSE mode over the m/z range of 50–1,800 in Nano electrospray mode. The capillary, sample cone, extraction cone, and collision energy were 3.3 kV, 25.0 V, 2.0 V, and 6.0 V, respectively. During elevated energy scan, the collision energy was ramped from 15 to 35 V. Glu–fibrinopeptide B of m/z 785.84 was used as lock mass for mass correction. At least three replicates of one sample were analyzed. Data were collected using MassLynx 4.1 and processed and searched using ProteinLynx Global Server 2.5.2. (Waters). The following parameters were used for the database search: enzyme “trypsin,” minimal fragments ion per peptide matched “2,” minimal fragments ion per protein matched “7,” missed cleavages “1,” variable modification “oxidation methionine,” peptide tolerance “automatic,” fragment tolerance “automatic,”and false positive rate “4%.” The calibration protein P00330 (ADH1_YEAST) was used at a concentration of 50 fmol/μl. The mouse database was from Uniprot release knowledgebase_2012_11.
Supplementary Material
Acknowledgments
We thank the Proteomics core facility of the Max Planck Institute for Biology of Ageing for performing protein identification and quantification and Deryck Mills (Max Planck Institute of Biophysics) for maintaining the electron microscopy facility. S.J. acknowledges support from the Deutsche Forschungsgemeinschaft (DFG) Center for Nanoscale Microscopy and Physiology of the Brain (CNMPB). This work was supported by the DFG (SFB 829) and a European Research Council Advanced Investigator grant (to N.-G.L.).
Footnotes
The authors declare no conflict of interest.
This article is a PNAS Direct Submission.
This article contains supporting information online at www.pnas.org/lookup/suppl/doi:10.1073/pnas.1512131112/-/DCSupplemental.
References
- 1.Larsson NG, et al. Mitochondrial transcription factor A is necessary for mtDNA maintenance and embryogenesis in mice. Nat Genet. 1998;18(3):231–236. doi: 10.1038/ng0398-231. [DOI] [PubMed] [Google Scholar]
- 2.Lagouge M, Larsson NG. The role of mitochondrial DNA mutations and free radicals in disease and ageing. J Intern Med. 2013;273(6):529–543. doi: 10.1111/joim.12055. [DOI] [PMC free article] [PubMed] [Google Scholar]
- 3.Larsson NG. Somatic mitochondrial DNA mutations in mammalian aging. Annu Rev Biochem. 2010;79(1):683–706. doi: 10.1146/annurev-biochem-060408-093701. [DOI] [PubMed] [Google Scholar]
- 4.Nass MM, Nass S. Intramitochondrial fibers with DNA characeristics. I. Fixation and electron staining reactions. J Cell Biol. 1963;19:593–611. doi: 10.1083/jcb.19.3.593. [DOI] [PMC free article] [PubMed] [Google Scholar]
- 5.Iborra FJ, Kimura H, Cook PR. The functional organization of mitochondrial genomes in human cells. BMC Biol. 2004;2:9. doi: 10.1186/1741-7007-2-9. [DOI] [PMC free article] [PubMed] [Google Scholar]
- 6.Kukat C, et al. Super-resolution microscopy reveals that mammalian mitochondrial nucleoids have a uniform size and frequently contain a single copy of mtDNA. Proc Natl Acad Sci USA. 2011;108(33):13534–13539. doi: 10.1073/pnas.1109263108. [DOI] [PMC free article] [PubMed] [Google Scholar]
- 7.Legros F, Malka F, Frachon P, Lombès A, Rojo M. Organization and dynamics of human mitochondrial DNA. J Cell Sci. 2004;117(Pt 13):2653–2662. doi: 10.1242/jcs.01134. [DOI] [PubMed] [Google Scholar]
- 8.Kukat C, Larsson N-G. mtDNA makes a U-turn for the mitochondrial nucleoid. Trends Cell Biol. 2013;23(9):457–463. doi: 10.1016/j.tcb.2013.04.009. [DOI] [PubMed] [Google Scholar]
- 9.Hell SW. Far-field optical nanoscopy. Science. 2007;316(5828):1153–1158. doi: 10.1126/science.1137395. [DOI] [PubMed] [Google Scholar]
- 10.Brown TA, et al. Superresolution fluorescence imaging of mitochondrial nucleoids reveals their spatial range, limits, and membrane interaction. Mol Cell Biol. 2011;31(24):4994–5010. doi: 10.1128/MCB.05694-11. [DOI] [PMC free article] [PubMed] [Google Scholar]
- 11.Ekstrand MI, et al. Mitochondrial transcription factor A regulates mtDNA copy number in mammals. Hum Mol Genet. 2004;13(9):935–944. doi: 10.1093/hmg/ddh109. [DOI] [PubMed] [Google Scholar]
- 12.Takamatsu C, et al. Regulation of mitochondrial D-loops by transcription factor A and single-stranded DNA-binding protein. EMBO Rep. 2002;3(5):451–456. doi: 10.1093/embo-reports/kvf099. [DOI] [PMC free article] [PubMed] [Google Scholar]
- 13.Shi Y, et al. Mammalian transcription factor A is a core component of the mitochondrial transcription machinery. Proc Natl Acad Sci USA. 2012;109(41):16510–16515. doi: 10.1073/pnas.1119738109. [DOI] [PMC free article] [PubMed] [Google Scholar]
- 14.Falkenberg M, et al. Mitochondrial transcription factors B1 and B2 activate transcription of human mtDNA. Nat Genet. 2002;31(3):289–294. doi: 10.1038/ng909. [DOI] [PubMed] [Google Scholar]
- 15.Morozov YI, et al. A novel intermediate in transcription initiation by human mitochondrial RNA polymerase. Nucleic Acids Res. 2014;42(6):3884–3893. doi: 10.1093/nar/gkt1356. [DOI] [PMC free article] [PubMed] [Google Scholar]
- 16.Ngo HB, Kaiser JT, Chan DC. The mitochondrial transcription and packaging factor Tfam imposes a U-turn on mitochondrial DNA. Nat Struct Mol Biol. 2011;18(11):1290–1296. doi: 10.1038/nsmb.2159. [DOI] [PMC free article] [PubMed] [Google Scholar]
- 17.Rubio-Cosials A, et al. Human mitochondrial transcription factor A induces a U-turn structure in the light strand promoter. Nat Struct Mol Biol. 2011;18(11):1281–1289. doi: 10.1038/nsmb.2160. [DOI] [PubMed] [Google Scholar]
- 18.Ngo HB, Lovely GA, Phillips R, Chan DC. Distinct structural features of TFAM drive mitochondrial DNA packaging versus transcriptional activation. Nat Commun. 2014;5:3077. doi: 10.1038/ncomms4077. [DOI] [PMC free article] [PubMed] [Google Scholar]
- 19.Farge G, et al. Protein sliding and DNA denaturation are essential for DNA organization by human mitochondrial transcription factor A. Nat Commun. 2012;3:1013. doi: 10.1038/ncomms2001. [DOI] [PubMed] [Google Scholar]
- 20.Kaufman BA, et al. The mitochondrial transcription factor TFAM coordinates the assembly of multiple DNA molecules into nucleoid-like structures. Mol Biol Cell. 2007;18(9):3225–3236. doi: 10.1091/mbc.E07-05-0404. [DOI] [PMC free article] [PubMed] [Google Scholar]
- 21.Gilkerson RW, Schon EA, Hernandez E, Davidson MM. Mitochondrial nucleoids maintain genetic autonomy but allow for functional complementation. J Cell Biol. 2008;181(7):1117–1128. doi: 10.1083/jcb.200712101. [DOI] [PMC free article] [PubMed] [Google Scholar]
- 22.Satoh M, Kuroiwa T. Organization of multiple nucleoids and DNA molecules in mitochondria of a human cell. Exp Cell Res. 1991;196(1):137–140. doi: 10.1016/0014-4827(91)90467-9. [DOI] [PubMed] [Google Scholar]
- 23.Kopek BG, Shtengel G, Xu CS, Clayton DA, Hess HF. Correlative 3D superresolution fluorescence and electron microscopy reveal the relationship of mitochondrial nucleoids to membranes. Proc Natl Acad Sci USA. 2012;109(16):6136–6141. doi: 10.1073/pnas.1121558109. [DOI] [PMC free article] [PubMed] [Google Scholar]
- 24.Farge G, et al. In vitro-reconstituted nucleoids can block mitochondrial DNA replication and transcription. Cell Reports. 2014;8(1):66–74. doi: 10.1016/j.celrep.2014.05.046. [DOI] [PubMed] [Google Scholar]
- 25.Martens PA, Clayton DA. Mechanism of mitochondrial DNA replication in mouse L-cells: Localization and sequence of the light-strand origin of replication. J Mol Biol. 1979;135(2):327–351. doi: 10.1016/0022-2836(79)90440-6. [DOI] [PubMed] [Google Scholar]
- 26.Davies KM, Daum B. Role of cryo-ET in membrane bioenergetics research. Biochem Soc Trans. 2013;41(5):1227–1234. doi: 10.1042/BST20130029. [DOI] [PubMed] [Google Scholar]
- 27.Dubochet J, et al. Cryo-electron microscopy of vitrified specimens. Q Rev Biophys. 1988;21(2):129–228. doi: 10.1017/s0033583500004297. [DOI] [PubMed] [Google Scholar]
- 28.Wu W, Thomas JA, Cheng N, Black LW, Steven AC. Bubblegrams reveal the inner body of bacteriophage φKZ. Science. 2012;335(6065):182. doi: 10.1126/science.1214120. [DOI] [PMC free article] [PubMed] [Google Scholar]
- 29.Cheng N, Wu W, Watts NR, Steven AC. Exploiting radiation damage to map proteins in nucleoprotein complexes: The internal structure of bacteriophage T7. J Struct Biol. 2014;185(3):250–256. doi: 10.1016/j.jsb.2013.12.004. [DOI] [PMC free article] [PubMed] [Google Scholar]
- 30.Fisher RP, Lisowsky T, Parisi MA, Clayton DA. DNA wrapping and bending by a mitochondrial high mobility group-like transcriptional activator protein. J Biol Chem. 1992;267(5):3358–3367. [PubMed] [Google Scholar]
- 31.Heuser J, Griffith J. Visualization of RecA protein and its complexes with DNA by quick-freeze/deep-etch electron microscopy. J Mol Biol. 1989;210(3):473–484. doi: 10.1016/0022-2836(89)90124-1. [DOI] [PubMed] [Google Scholar]
- 32.Van Tuyle GC, McPherson ML. A compact form of rat liver mitochondrial DNA stabilized by bound proteins. J Biol Chem. 1979;254(13):6044–6053. [PubMed] [Google Scholar]
- 33.Friddle RW, et al. Mechanism of DNA compaction by yeast mitochondrial protein Abf2p. Biophys J. 2004;86(3):1632–1639. doi: 10.1016/S0006-3495(04)74231-9. [DOI] [PMC free article] [PubMed] [Google Scholar]
- 34.Meeusen S, Nunnari J. Evidence for a two membrane-spanning autonomous mitochondrial DNA replisome. J Cell Biol. 2003;163(3):503–510. doi: 10.1083/jcb.200304040. [DOI] [PMC free article] [PubMed] [Google Scholar]
- 35.Bogenhagen DF, Rousseau D, Burke S. The layered structure of human mitochondrial DNA nucleoids. J Biol Chem. 2008;283(6):3665–3675. doi: 10.1074/jbc.M708444200. [DOI] [PubMed] [Google Scholar]
- 36.Garrido N, et al. Composition and dynamics of human mitochondrial nucleoids. Mol Biol Cell. 2003;14(4):1583–1596. doi: 10.1091/mbc.E02-07-0399. [DOI] [PMC free article] [PubMed] [Google Scholar]
- 37.Wredenberg A, et al. MTERF3 regulates mitochondrial ribosome biogenesis in invertebrates and mammals. PLoS Genet. 2013;9(1):e1003178. doi: 10.1371/journal.pgen.1003178. [DOI] [PMC free article] [PubMed] [Google Scholar]
- 38.Kremer JR, Mastronarde DN, McIntosh JR. Computer visualization of three-dimensional image data using IMOD. J Struct Biol. 1996;116(1):71–76. doi: 10.1006/jsbi.1996.0013. [DOI] [PubMed] [Google Scholar]
- 39.Frangakis AS, Hegerl R. Noise reduction in electron tomographic reconstructions using nonlinear anisotropic diffusion. J Struct Biol. 2001;135(3):239–250. doi: 10.1006/jsbi.2001.4406. [DOI] [PubMed] [Google Scholar]
- 40.Ruzzenente B, et al. LRPPRC is necessary for polyadenylation and coordination of translation of mitochondrial mRNAs. EMBO J. 2012;31(2):443–456. doi: 10.1038/emboj.2011.392. [DOI] [PMC free article] [PubMed] [Google Scholar]
Associated Data
This section collects any data citations, data availability statements, or supplementary materials included in this article.


