Significance
The spindle checkpoint is a cellular surveillance system that ensures the fidelity of chromosome segregation and guards against aneuploidy and its associated disease states. The critical checkpoint protein mitotic arrest deficient 2 (Mad2) is an unusual protein with multiple, topologically distinct conformers, including the inactive, open conformer (O-Mad2) and the active, closed conformer (C-Mad2). C-Mad2 can form an asymmetric dimer with O-Mad2 to convert it to another C-Mad2, through an intermediate conformer (I-Mad2). This study determines the structure of the intermediate conformer of the multistate Mad2 protein, revealing how one Mad2 conformer molds the other into itself in a prion-like conformational propagation process.
Keywords: mitosis, conformational change, allostery, NMR, X-ray crystallography
Abstract
The spindle checkpoint senses unattached kinetochores during prometaphase and inhibits the anaphase-promoting complex or cyclosome (APC/C), thus ensuring accurate chromosome segregation. The checkpoint protein mitotic arrest deficient 2 (Mad2) is an unusual protein with multiple folded states. Mad2 adopts the closed conformation (C-Mad2) in a Mad1–Mad2 core complex. In mitosis, kinetochore-bound Mad1–C-Mad2 recruits latent, open Mad2 (O-Mad2) from the cytosol and converts it to an intermediate conformer (I-Mad2), which can then bind and inhibit the APC/C activator cell division cycle 20 (Cdc20) as C-Mad2. Here, we report the crystal structure and NMR analysis of I-Mad2 bound to C-Mad2. Although I-Mad2 retains the O-Mad2 fold in crystal and in solution, its core structural elements undergo discernible rigid-body movements and more closely resemble C-Mad2. Residues exhibiting methyl chemical shift changes in I-Mad2 form a contiguous, interior network that connects its C-Mad2–binding site to the conformationally malleable C-terminal region. Mutations of residues at the I-Mad2–C-Mad2 interface hinder I-Mad2 formation and impede the structural transition of Mad2. Our study provides insight into the conformational activation of Mad2 and establishes the basis of allosteric communication between two distal sites in Mad2.
Accurate chromosome segregation requires proper, dynamic attachment of sister chromatids to spindle microtubules during mitosis, which enables chromosome alignment at the metaphase plate (1, 2). At metaphase, two opposing kinetochores of a sister-chromatid pair attach to microtubules emanating from opposite spindle poles. This bipolar kinetochore–microtubule attachment enables all sister chromatids to align at the metaphase plate. The anaphase-promoting complex or cyclosome (APC/C), along with its activator cell division cycle 20 (Cdc20), indirectly activates the protease separase through triggering the ubiquitination and degradation of the separase inhibitors, securin and cyclin B1 (3–5). Active separase then cleaves cohesin, leading to chromosome segregation (6, 7). The separated chromatids are evenly partitioned into the two daughter cells through their attachment to the spindle.
During mitotic progression, not all sister kinetochores achieve bipolar attachment synchronously. The spindle checkpoint senses the existence of kinetochores not attached or improperly attached to spindle microtubules and inhibits APC/CCdc20 through promoting the formation of the APC/C-inhibitory mitotic checkpoint complex (MCC) consisting of BubR1, Bub3, mitotic arrest deficient 2 (Mad2), and Cdc20 (8–12). APC/C inhibition delays separase activation, cohesin cleavage, and the onset of chromosome segregation and provides time for unattached kinetochores to reach proper attachment before separation. The spindle checkpoint thus ensures the fidelity of chromosome segregation.
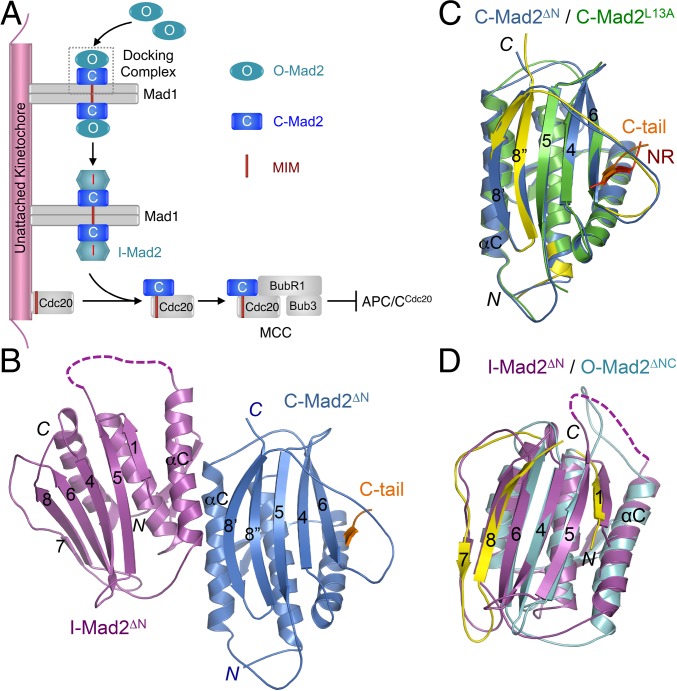
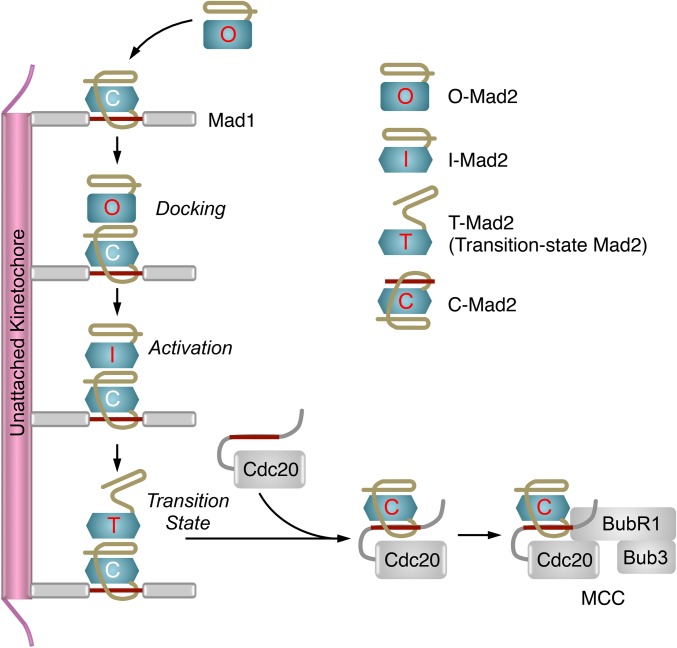
The unusual multistate behavior of the checkpoint protein Mad2 is critical for kinetochore-dependent spindle checkpoint signaling (9, 12–14). Mad2 has multiple folded conformers, including the latent, open conformer (O-Mad2) and the activated, closed conformer (C-Mad2) (15–19). C-Mad2 binds to its upstream regulatory protein Mad1 and its downstream target Cdc20 through the Mad2-interacting motif (MIM) (4, 16, 17). C-Mad2 topologically entraps this MIM motif through a seat-belt-like structure formed by its C-terminal region (16, 17). O-Mad2 cannot interact with Mad1 or Cdc20 because the seat belt is not formed in O-Mad2 and the C-terminal region in O-Mad2 blocks the ligand-binding site (16). In human cells, Mad2 exists as multiple species, including free, latent O-Mad2 and C-Mad2 tightly bound to Mad1 (18, 20). Upon checkpoint activation, the Mad1–Mad2 core complex is targeted to unattached kinetochores (21, 22). This core complex can further recruit additional copies of O-Mad2 and convert them into intermediates termed I-Mad2 (Fig. 1A) (19, 23–25). Cdc20 and BubR1–Bub3 are also recruited to unattached kinetochores through other mechanisms (26, 27). The close proximity of I-Mad2 and Cdc20 stimulates efficient formation of the C-Mad2–Cdc20 complex, which can then associate with BubR1–Bub3 to form MCC (28). Thus, unattached kinetochores promote the conformational activation of Mad2 and the production of MCC.
Fig. 1.
Crystal structure of the asymmetric I-Mad2–C-Mad2 dimer. (A) Model for conformational activation of Mad2 at kinetochores during mitosis. MCC, mitotic checkpoint complex; MIM, Mad2-interacting motif. (B) Diagram of the crystal structure of the asymmetric Mad2ΔN dimer, with the I-Mad2 and C-Mad2 monomers colored purple and blue, respectively. The entrapped C-terminal tail (C-tail) of another Mad2ΔN molecule through crystal packing interactions is shown and colored orange. (C) Superimposed diagrams of the C-Mad2 monomer in the Mad2ΔN dimer (blue) and the C-Mad2 monomer in the symmetric Mad2L13A dimer (green). The entrapped N-terminal region (NR) of another Mad2L13A molecule through crystal packing interactions is shown and colored red. The C- and N-terminal regions in Mad2L13A that underwent large conformational changes from O-Mad2 to C-Mad2 are colored yellow. (D) Superimposed diagrams of the I-Mad2 monomer in the Mad2ΔN dimer (purple) and the solution structure of O-Mad2ΔNC lacking both the N- and C-terminal 10 residues (cyan). All structural figures were generated with PyMol (https://www.pymol.org).
Previous NMR analyses showed that the chemical shifts of many backbone amides and methyl groups in I-Mad2 were drastically different from those in O-Mad2 or C-Mad2 (23, 24). These results seemingly supported the notion that I-Mad2 adopted a fold different from those of O- or C-Mad2. It was further suggested that I-Mad2 might have undergone partial unfolding in the N- and C-terminal regions, which was a prerequisite for the topological entrapment of Cdc20 and formation of C-Mad2.
In a breakthrough study, Musacchio and coworkers determined the structure of an asymmetric Mad2 dimer (29). In this dimer, one monomer was C-Mad2 bound to an unnatural peptide ligand called Mad2-binding peptide 1 (MBP1). The other monomer was a Mad2 mutant with a shortened loop (termed loop-less or LL), which was thought to block the formation of I-Mad2. Indeed, in this asymmetric dimer, Mad2LL had the same overall fold as O-Mad2. This dimer was thus proposed to represent the docking complex of O-Mad2–C-Mad2 (Fig. 1A) (29).
To gain structural insights into the conformational activation of Mad2, we determined the crystal structure of the I-Mad2–C-Mad2 dimer and analyzed its conformation in solution with NMR. Our studies show that, similar to Mad2LL, I-Mad2 does not undergo partial unfolding and retains the same fold as O-Mad2, both in crystal and in solution. Instead, the dramatic chemical shift changes of I-Mad2 are likely caused by the relative rotations between the dimerization and central helices, as well as the rigid body shift of the β hairpin that contacts both helices. These rearrangements render the I-Mad2 core more closely resemble the C-Mad2 core. Our finding that I-Mad2 remains folded at the C-terminal region suggests that the partially unfolded Mad2 species ready for Cdc20 entrapment likely represents a fleeting transition state, not a populated intermediate as widely believed. Furthermore, mutations of I-Mad2 residues at or near the dimerization interface reduce the extent of C-Mad2–induced conformational rearrangements and impede the spontaneous O-C Mad2 structural transition. Our studies thus establish the structural basis for the allosteric communication between the dimerization interface and the C-terminal malleable region of Mad2.
Results and Discussion
Crystal Structure of the I-Mad2–C-Mad2 Dimer.
The WT O-Mad2 can complete the O-C structural transition in the absence of Cdc20 and dissociate from C-Mad2–Mad1 or C-Mad2–MBP1 as free C-Mad2 (24). The C-terminal 10 residues of Mad2 are disordered in O-Mad2 but form part of the seat belt in C-Mad2 (15–17). The Mad2ΔC mutant lacking the C-terminal 10 residues thus cannot adopt the C-Mad2 conformation and is stably trapped as I-Mad2 when bound to C-Mad2–MBP1 (23, 24).
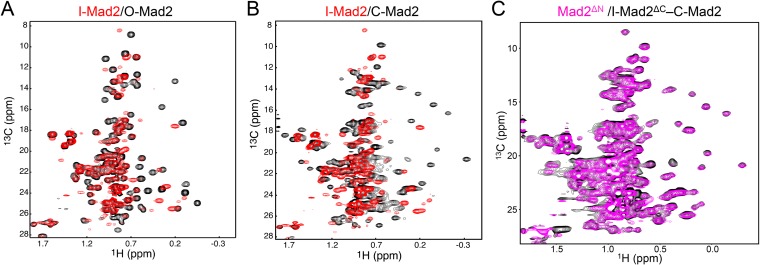
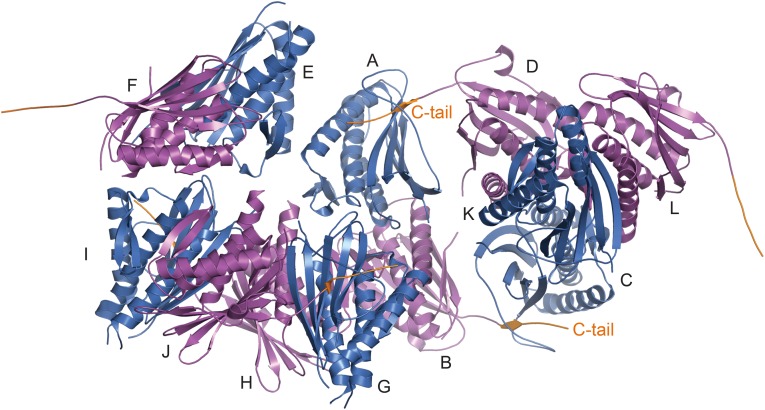
Many methyl peaks in the 1H/13C heteronuclear single quantum coherence (HSQC) spectrum of I-Mad2ΔC (bound to unlabeled C-Mad2–MBP1) had different chemical shifts, compared with those of either O-Mad2 (Fig. S1A) or C-Mad2 (Fig. S1B). The spectrum of the Mad2ΔN dimer (lacking the N-terminal 10 residues) was virtually identical to that of the I-Mad2–C-Mad2 dimer (Fig. S1C), indicating that Mad2ΔN formed the asymmetric I-Mad2–C-Mad2 dimer exclusively. We then crystallized Mad2ΔN and determined its structure by molecular replacement with the Mad2LL structure as the search model (Fig. 1B and Table S1). The Mad2ΔN dimer is indeed asymmetric. As expected, one monomer adopts the C-Mad2 conformation observed in the symmetric C-Mad2–C-Mad2 dimer (24) (Fig. 1C). The seat belt-like motif of this C-Mad2 copy entraps the C terminus of another Mad2 molecule through crystal packing interactions, which are almost certainly crystallographic artifacts (Fig. S2). Contrary to what is widely believed, the other Mad2 monomer (which has the I-Mad2 conformation) retains the same tertiary fold as O-Mad2 and does not undergo partial unfolding of its N- and C-terminal regions (Fig. 1D). The dimer interface mainly comprises the αC helix of C-Mad2 and the αC helix and the β2/3 hairpin of I-Mad2 (Fig. 1B).
Fig. S1.
Mad2ΔN exclusively forms the asymmetric I-Mad2–C-Mad2 dimer in the absence of ligands. (A) Overlay of the methyl region of the 1H/13C HSQC spectra of 13C-labeled O-Mad2ΔC (black) and 13C-labeled I-Mad2ΔC bound to unlabeled C-Mad2–MBP1 complex (red). (B) Overlay of the methyl region of the 1H/13C HSQC spectra of 13C-labeled C-Mad2 bound to unlabeled MBP1 (black) and 13C-labeled I-Mad2ΔC bound to unlabeled C-Mad2–MBP1 complex (red). (C) Overlay of the methyl region of the 1H/13C HSQC spectra of 13C-labeled Mad2ΔN dimer (I-Mad2–C-Mad2) (magenta) and 13C-labeled I-Mad2ΔC–C-Mad2 (bound to unlabeled MBP1) (black).
Table S1.
Data collection and refinement statistics for the Mad2∆N asymmetric dimer structure
| Parameter | Value |
| Data collection | |
| Space group | P21 |
| Wavelength, Å | 0.97929 |
| Cell dimensions | |
| a, b, c, Å | 124.83, 104.92, 157.75 |
| β, ° | 97.57 |
| Resolution range, Å | 50.00–3.95 (4.09–3.95)* |
| Unique reflections | 35,718 |
| Multiplicity | 7.3 (7.2) |
| Data completeness, % | 100.0 (100.0) |
| Rmerge, %† | 16.5 (78.0) |
| I/σ(I) | 11.6 (2.7) |
| Wilson B-value, Å2 | 116.1 |
| Refinement statistics | |
| Resolution range, Å | 49.73–3.95 (4.06–3.95) |
| No. of reflections Rwork/Rfree | 35,601/1,771 (2,474/117) |
| Data completeness, % | 99.6 (95.0) |
| Atoms (non-H protein/solvent) | 18,246/60 |
| Rwork, % | 21.8 (27.7) |
| Rfree, % | 25.1 (32.2) |
| rmsd bond length, Å | 0.008 |
| rmsd bond angle, ° | 1.023 |
| Mean B-value, Å2 (protein/solvent) | 160.2/160.5 |
| Ramachandran plot, % (favored/disallowed)‡ | 92.9/0.4 |
| Maximum likelihood coordinate error | 0.24 |
Data for the outermost shell are given in parentheses.
Rmerge = 100 ΣhΣi|Ih,i − 〈Ih〉|/ΣhΣiIh,i, where the outer sum (h) is over the unique reflections and the inner sum (i) is over the set of independent observations of each unique reflection.
As defined by the validation suite MolProbity.
Fig. S2.
The C-Mad2 copy of Mad2ΔN entraps the C terminus of another Mad2 molecule through crystal packing interactions. Ribbon diagram of all 12 Mad2 (A–L) molecules in one asymmetric unit, with C-Mad2 and I-Mad2 in blue and magenta, respectively. The C-terminal tail (C-tail) of Mad2 is colored orange.
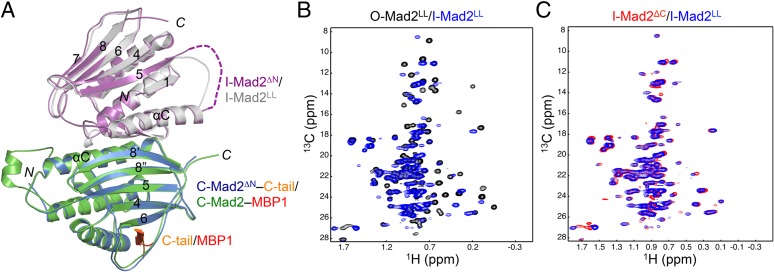
The loop connecting αC and β5 is disordered in both O- and C-Mad2. During the O–C structural transition of Mad2, β1 threads through this loop and rearranges into an additional turn of the αA helix. Mad2LL had a shortened αC-β5 loop and was designed to prevent β1 from threading through, presumably blocking I-Mad2 formation (29). Therefore, the structure of the Mad2LL dimer was thought to represent the O-Mad2–C-Mad2 docking complex. We next compared the structures of the Mad2ΔN dimer with that of the Mad2LL dimer (Fig. 2A). These two structures are nearly identical, with two exceptions: (i) The C-Mad2 copy in the Mad2LL dimer binds to a high-affinity ligand whereas the C-Mad2 copy in Mad2ΔN binds to the C terminus of I-Mad2 through crystal packing; and (ii) the C-Mad2 copy of Mad2LL contains an extra N-terminal helix whereas this region is deleted in Mad2ΔN. The methyl peaks of 13C-labeled O-Mad2LL experienced extensive chemical shift changes upon binding to unlabeled C-Mad2–MBP1 (Fig. 2B). The 1H/13C HSQC spectrum of 13C-labeled Mad2LL bound to unlabeled C-Mad2–MBP1 was highly similar to that of 13C-labeled I-Mad2ΔC bound to unlabeled C-Mad2–MBP1 (Fig. 2C). Thus, the previously reported structure of the Mad2LL dimer represents that of I-Mad2–C-Mad2, not that of the O-Mad2–C-Mad2 docking complex as originally envisioned.
Fig. 2.
The loop-less Mad2 (Mad2LL) forms the I-Mad2–C-Mad2 dimer. (A) Superimposed diagrams of the Mad2ΔN dimer (with its I-Mad2 and C-Mad2 monomers colored in purple and blue, respectively) and the Mad2LL dimer (with its I-Mad2 and C-Mad2–MBP1 monomers colored gray and green, respectively). C-tail, the C-terminal tail of Mad2; MBP1, Mad2 binding peptide 1, an unnatural peptide ligand of Mad2 identified through phage display. (B) Overlay of the methyl region of the 1H/13C HSQC spectra of 13C-labeled O-Mad2LL (black) and 13C-labeled I-Mad2LL bound to unlabeled C-Mad2–MBP1 complex (blue). (C) Overlay of the methyl region of the 1H/13C HSQC spectra of 13C-labeled I-Mad2ΔC bound to unlabeled C-Mad2–MBP1 complex (red) and 13C-labeled I-Mad2LL bound to unlabeled C-Mad2–MBP1 complex (blue).
I-Mad2 Does Not Undergo Partial Unfolding in Solution.
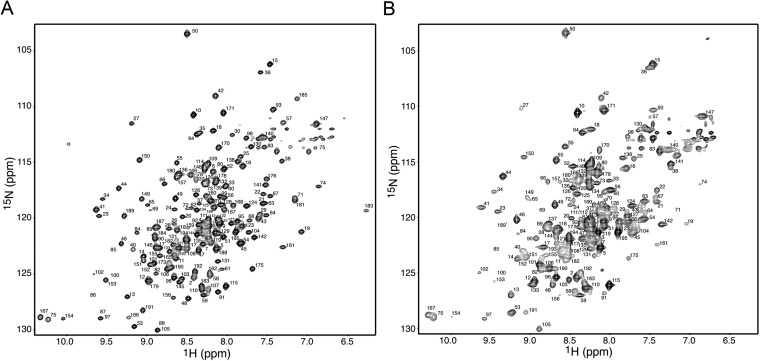
Given the dramatic chemical shift differences between the methyl and backbone amide resonances of O-Mad2 and I-Mad2 (Figs. S1A and S3), it was puzzling that I-Mad2 retained the same tertiary fold as O-Mad2. We considered the possibility that I-Mad2 in solution might undergo partial unfolding, but that this partial unfolding was somehow hindered by crystal contacts. For example, the long central helix in the crystal structure of calmodulin is partially melted and exhibits flexibility in its central region in solution (30, 31). We thus sequentially assigned the backbone resonances of I-Mad2 (15N/13C/2H-labeled Mad2ΔC bound to unlabeled Mad2–MBP1) using a set of transverse relaxation-optimized spectroscopy (TROSY) triple resonance experiments. The 1H/15N HSQC spectrum of I-Mad2 bound to unlabeled C-Mad2, with the assigned peaks labeled by their corresponding residue numbers, is shown in Fig. S3B.
Fig. S3.
The backbone amide chemical shifts of I-Mad2 are drastically different from those of O-Mad2. (A) The 1H/15N HSQC spectrum of 15N-labeled O-Mad2ΔC with its peaks labeled by their corresponding residue numbers. (B) The 1H/15N HSQC spectrum of 15N-labeled I-Mad2ΔC bound to unlabeled C-Mad2–MBP1, with its assigned peaks labeled by residue numbers.
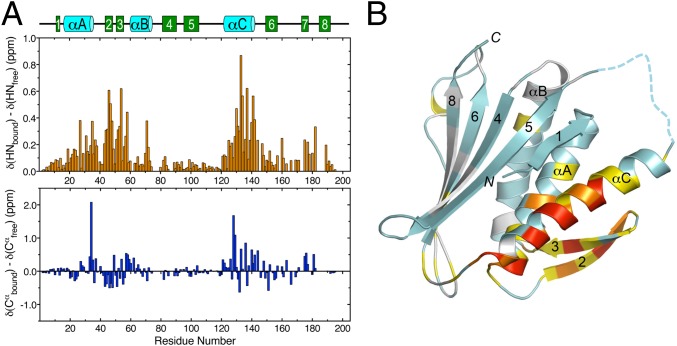
Comparison of the backbone amide chemical shifts of I-Mad2 and O-Mad2 reveals extensive differences along the entire length of the protein (Fig. 3A, Top). Residues with the largest chemical shift differences cluster around the β2/3 hairpin and the αC helix, which form the C-Mad2-binding site on I-Mad2. The N- and C-terminal residues of Mad2 show only modest chemical shift changes. More importantly, the Cα chemical shifts (which are particularly sensitive to secondary structures) do not change dramatically between O-Mad2 and I-Mad2 (Fig. 3A, Bottom), with virtually no changes around β1 and β7/8. The greatest combined chemical shift changes of amide nitrogen and Cα also occur at the β2/3 hairpin and the αC helix (Fig. 3B). In particular, residues in β1 and β7/8 experience minimal changes. These results indicate that I-Mad2 in solution also does not undergo partial unfolding at its N and C termini. C-Mad2 binding induces extensive chemical shift differences between I-Mad2 and O-Mad2, with residues located at the dimer interface experiencing greatest perturbations. Our NMR analyses of I-Mad2 thus rule out the remote possibility that the crystal structure of I-Mad2 does not accurately reflect the structure of I-Mad2 in solution.
Fig. 3.
I-Mad2 does not undergo partial unfolding at its N- and C-terminal regions. (A) Backbone amide (Top) and Cα (Bottom) chemical shift changes between O-Mad2ΔC and I-Mad2ΔC bound to C-Mad2–MBP1, plotted against residue numbers. The secondary structure of O-Mad2 is shown above. The amide chemical shift change (ΔδHN) is defined as the square root of 0.5[(wH·ΔδH)2 + (wN·ΔδN)2], with wH = 1 and wN = 0.154. (B) Diagram of the crystal structure of I-Mad2ΔN with each residue colored according to the combined chemical shift changes of backbone amide nitrogen and Cα, ΔδNCα. ΔδNCα is defined as the square root of [(wN·ΔδN)2 + (wCα·ΔδCα)2], with wN = 0.154 and wCα = 0.276. The color schemes are as follows: light gray, unassigned; cyan, ΔδNCα < 0.1 ppm; yellow, 0.1 ppm ≤ ΔδNCα < 0.2 ppm; orange, 0.2 ppm ≤ ΔδNCα < 0.3 ppm; red, ΔδNCα ≥ 0.3 ppm.
Structural Elements of I-Mad2 Exhibit Discernible Rearrangement Without Topological Changes.
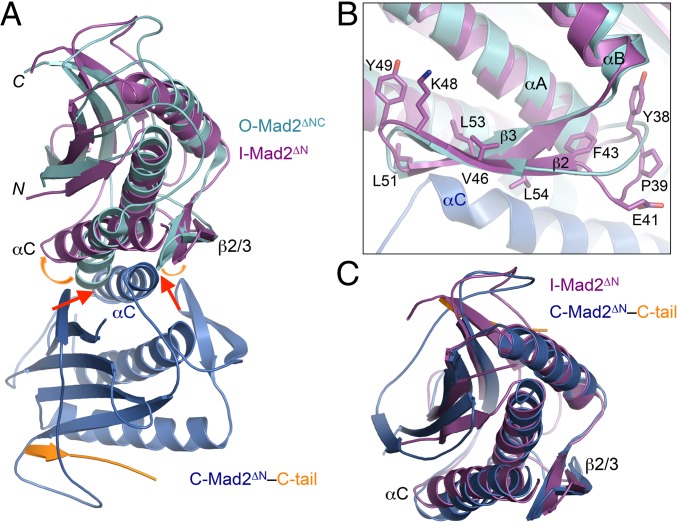
Having confirmed that one monomer in the Mad2ΔN dimer was indeed I-Mad2, we next compared the structure of I-Mad2 in this dimer with the solution structure of O-Mad2 determined by NMR (15). Although I-Mad2 retains the same fold as O-Mad2, it undergoes considerable conformational rearrangement, with the root mean square deviation (rmsd) between Cα atoms of the two conformers being 3.0 Å. In particular, the relative orientations of the αC dimerization helix and the αA central helix are quite different between the two conformers (Fig. 4A). The two helices are nearly parallel to each other in O-Mad2 whereas they are at an about 30° angle in I-Mad2. The β1 strand and the β2/3 hairpin, which cover the two helices on either face, also undergo rigid-body movements (Fig. 4A).
Fig. 4.
The I-Mad2 core more closely resembles the C-Mad2 core. (A) Superimposed diagrams of O-Mad2 (cyan) and the Mad2ΔN dimer with the C-Mad2 and I-Mad2 monomers colored blue and purple, respectively. Red arrows indicate steric clashes between C-Mad2 and O-Mad2. Orange arrows show relative movement of αC and β2/3 in I-Mad2. (B) Close-up view of the interface between the β2/3 hairpin of I-Mad2 and αC of C-Mad2, with residues targeted by mutagenesis in this study shown as sticks and labeled. Color schemes are the same as in A. (C) Superimposed diagrams of I-Mad2ΔN (purple) and C-Mad2ΔN (blue).
These changes are triggered by the binding of the αC helix in C-Mad2 to these structural elements (Fig. 4A). Without these structural rearrangements, the αC helix would have steric clashes with αC and β2/3 in O-Mad2. In the I-Mad2–C-Mad2 dimer, the C-terminal half of this helix packs against the β2/3 hairpin and the C-terminal ends of αC and αA helices of I-Mad2 (Fig. 4B). Among the interface residues, L54 in the β2/3 hairpin of I-Mad2 forms extensive hydrophobic interactions with T136 and A137 of C-Mad2 and Y33 of I-Mad2. Residues located on the opposite side of the β2/3 hairpin, including F43, K48, Y49, L51, and L53, contact the αA and αC helices, coupling C-Mad2 binding to conformational rearrangements of these helices.
We also compared the structure of I-Mad2 with that of C-Mad2 in the same Mad2ΔN dimer. Excluding the N- and C-terminal regions that change their secondary structures, the Cα rmsd between the I-Mad2 and C-Mad2 cores (residues 16–107 and 120–158) is about 1.6 Å, which is much smaller than that (2.9 Å) between the I-Mad2 and O-Mad2 cores. For comparison, the Cα rmsd between O-Mad2 and C-Mad2 is also 2.9 Å. The relative orientations of the three helices in I-Mad2 are similar to those in C-Mad2 (Fig. 4C). Therefore, even though I-Mad2 has the same fold as O-Mad2, the conformation of its core more closely resembles that of the C-Mad2 core.
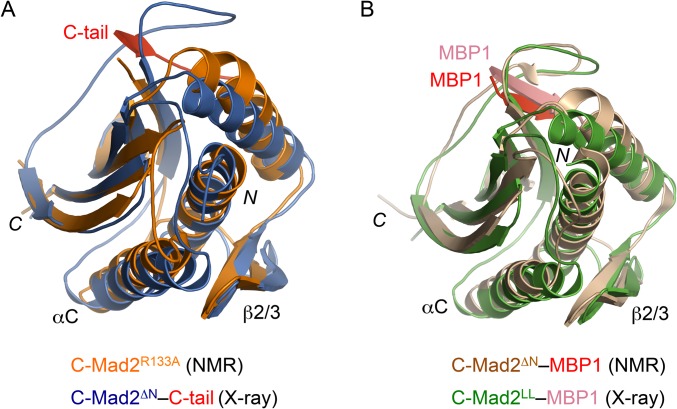
Because there were no crystal structures of O-Mad2 alone, we had to compare the crystal structure of I-Mad2 with the solution structure of O-Mad2. The backbone rmsd between O-Mad2 and I-Mad2 (2.9 Å) is much greater than the backbone rmsd of the ensemble of NMR structures of O-Mad2 (0.90 Å) determined by simulated annealing (15). Therefore, the conformational differences between I-Mad2 and O-Mad2 described above are unlikely the result of the relatively low precision of the NMR structure. We cannot formally exclude the possibility that some differences between the two structures are caused by inherent structural differences in crystal and in solution. It is generally accepted, however, that the vast majority of crystal structures accurately represent the structures of proteins in solution. Indeed, the relative orientation of the αC and αA helices in the solution structure of monomeric, unliganded C-Mad2 is quite similar to that in the crystal structure of the C-Mad2 copy in the current I-Mad2–C-Mad2 asymmetric dimer (Fig. S4A). Likewise, there are no major differences between the relative orientations of these two helices in the solution structure of C-Mad2–MBP1 and the crystal structure of C-Mad2–MBP1 in the Mad2LL dimer (Fig. S4B).
Fig. S4.
The solution and crystal structures of C-Mad2 are highly similar. (A) Superimposed diagrams of the solution structure of monomeric C-Mad2R133A (PBD ID code 1S2H; orange) and the crystal structure of C-Mad2ΔN in this study (PBD ID code 3GMH; blue). (B) Superimposed diagrams of the solution structure of Mad2∆N–MBP1 (PBD ID code 1KLQ; with Mad2 colored wheat and MBP1 colored red) and the crystal structure of C-Mad2LL–MBP1 in the Mad2LL asymmetric dimer (PBD ID code 2V64; with Mad2 colored green and MBP1 colored salmon).
The β2/3 Hairpin Couples C-Mad2 Binding to Conformational Changes in I-Mad2.
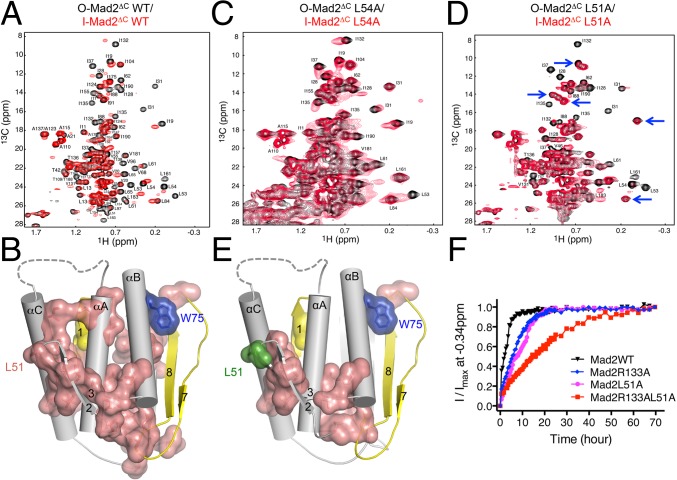
The β2/3 hairpin is a major part of the C-Mad2–binding interface in I-Mad2 (Fig. 4A). The backbone amide groups of nearly all residues in this hairpin undergo chemical shift changes in I-Mad2 (Fig. 3A), compared with O-Mad2. In addition, the methyl regions of the 1H/13C HSQC spectra of I-Mad2 and O-Mad2 are dramatically different (Fig. S1A). Because the methyl resonances in I-Mad2 were not assigned, we could not quantitatively measure the magnitude of the chemical changes of these methyl groups. We thus displayed in the I-Mad2 structure those residues whose methyl peaks had shifted in I-Mad2 versus O-Mad2 (Fig. 5 A and B). Strikingly, these residues form a continuous interior network that connects the dimerization interface containing the β2/3 hairpin to the structurally malleable C-terminal region (Fig. 5B). Notably, two residues in this network, L161 and I190, contact W75 in the αB helix. W75 is critical for the stability of O-Mad2. The W75A mutant of Mad2 selectively adopts the C-Mad2 conformation in the absence of a high-affinity ligand (24). Therefore, perturbations of the hydrophobic interactions involving W75 are expected to favor C-Mad2 formation.
Fig. 5.
The β2/3 hairpin couples C-Mad2 binding to I-Mad2 formation and O–C Mad2 structural transition. (A) Overlay of the methyl region of the 1H/13C HSQC spectra of 13C-labeled O-Mad2ΔC (black) and 13C-labeled Mad2ΔC bound to unlabeled C-Mad2–MBP1 complex (red). The assigned methyl peaks in the O-Mad2 spectrum are labeled. (B) Diagram of I-Mad2 with the core colored in gray and the N- and C-terminal regions colored yellow. Residues whose methyl peaks in O-Mad2 are shifted by C-Mad2 binding are shown in van der Waals surface and sticks and colored in salmon. Two residues that are critical for maintaining the O-Mad2 conformation, L13 (yellow) and W75 (blue), are also shown. (C) Overlay of the methyl region of the 1H/13C HSQC spectra of 13C-labeled O-Mad2ΔC L54A (black) and 13C-labeled Mad2ΔC L54A bound to unlabeled C-Mad2–MBP1 complex (red). The assigned methyl peaks in the O-Mad2 spectrum are labeled. (D) Overlay of the methyl region of the 1H/13C HSQC spectra of 13C-labeled O-Mad2ΔC L51A (black) and 13C-labeled Mad2ΔC L51A bound to unlabeled C-Mad2–MBP1 complex (red). The assigned methyl peaks in the O-Mad2 spectrum are labeled. Blue arrows indicate representative unperturbed peaks. (E) Diagram of I-Mad2 with the core colored in gray and the N- and C-terminal regions colored yellow. Residues whose methyl peaks in O-Mad2 L51A are shifted by C-Mad2 binding are shown in van der Waals surface and sticks and colored in salmon. L51 is shown in green. (F) The O–C structural transitions of the indicated O-Mad2 proteins at 30 °C were monitored by a series of 1D 1H experiments, with each experiment lasting 30 min. The relative intensity of the methyl peak of V197 at −0.34 ppm was plotted against time. The nonlinear curve fitting with two-phase association was done with the program Prism.
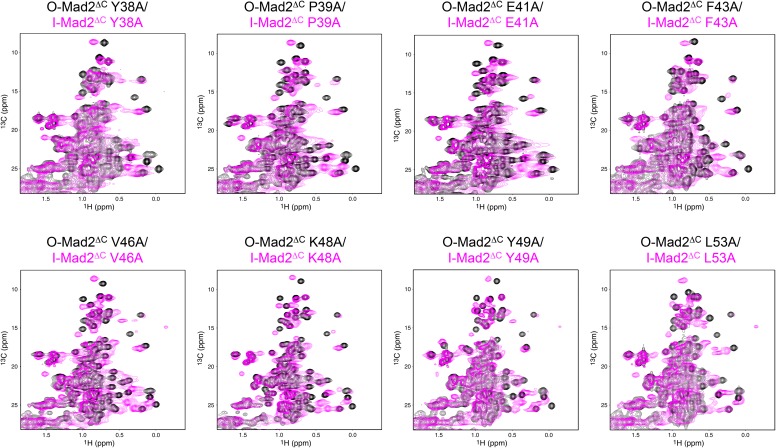
We hypothesized that the β2/3 hairpin contributed to the long-range allosteric communication between the asymmetric Mad2 dimerization interface and the C-terminal region in I-Mad2. To test this hypothesis, we made 13C-labeled O-Mad2ΔC proteins with several residues in this hairpin mutated individually and acquired 1H/13C HSQC spectra on these mutant proteins alone or bound to unlabeled C-Mad2WT–MBP1. Several O-Mad2ΔC mutants, including Y38A, P39A, E41A, F43A, V46A, K48A, Y49A, and L53A, still underwent dramatic chemical shift changes indicative of I-Mad2 formation, when bound to C-Mad2 (Fig. S5). Strikingly, the majority of methyl peaks of O-Mad2ΔC L54A had the same chemical shifts in the absence or presence of C-Mad2 (Fig. 5C) although these peaks had a broader line width indicative of complex formation. A subset of the methyl peaks of O-Mad2ΔC L51A disappeared upon C-Mad2 binding, but the remaining visible peaks were unperturbed (Fig. 5D). Most residues with disappeared methyl peaks defined a much more limited, discontinuous network that was close to the C-Mad2–binding site in I-Mad2 (Fig. 5E).
Fig. S5.
Overlay of the methyl region of the 1H/13C HSQC spectra of the indicated 13C-labeled Mad2ΔC proteins either alone (black) or bound to unlabeled C-Mad2–MBP1 (magenta).
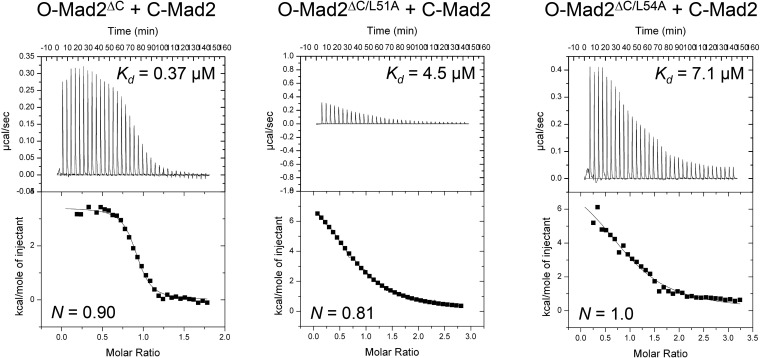
Based on isothermal titration calorimetry (ITC), the binding affinities of O-Mad2ΔC WT, L51A, or L54A toward C-Mad2 are 0.37 µM, 4.5 µM, or 7.1 µM, respectively (Fig. S6). The concentrations of O-Mad2ΔC and C-Mad2 proteins used in our NMR experiments are 200 µM. Despite their weaker affinities, most O-Mad2ΔC L51A and L54A proteins are expected to form a complex with C-Mad2 at these high concentrations. Therefore, even in complex with C-Mad2, O-Mad2ΔC L51A and L54A exhibit greatly diminished chemical shift perturbations, indicating that they are deficient in I-Mad2 formation. These residues in O-Mad2 not only mediate the asymmetric dimerization with C-Mad2, but also couple C-Mad2 binding to structural rearrangements during I-Mad2 formation.
Fig. S6.
Binding affinities between C-Mad2 and I-Mad2 mutants measured by isothermal titration calorimetry (ITC).
I-Mad2 Formation Facilitates the Spontaneous O-Mad2 to C-Mad2 Structural Transition.
Having produced Mad2 mutants that hindered I-Mad2 formation, we next tested whether I-Mad2 was indeed involved in promoting C-Mad2 formation. Because formation of ligand-bound C-Mad2 was too fast to be monitored by NMR, we measured the kinetics of spontaneous conformational transition of O-Mad2 to C-Mad2 in the absence of ligands using 1D 1H NMR spectroscopy. In the case of Mad2 WT, the transition likely involves the cooperation of several processes. First, a fraction of O-Mad2 can spontaneously convert to monomeric C-Mad2. Second, this C-Mad2 can speed the transition of other O-Mad2 to C-Mad2 by binding and forming the I-Mad2–C-Mad2 dimer. In this way, the asymmetric dimerization and the formation of I-Mad2 are expected to contribute to the formation of C-Mad2.
Consistent with this notion, the R133A mutation, which greatly weakened both symmetric and asymmetric dimerization of Mad2, slowed down the emergence of a C-Mad2–specific high-field methyl signal at −0.34 ppm (Fig. 5F). The L51A mutation, which diminished the formation of I-Mad2, also slowed down the formation of C-Mad2. Consistent with the fact that the Mad2 L51A mutant still formed asymmetric dimers at high concentrations, the O-Mad2 R133A/L51A double mutant had an even slower kinetics in transitioning to C-Mad2, compared with either single mutant. These results strongly suggest that I-Mad2 is an on-pathway intermediate for the formation of C-Mad2.
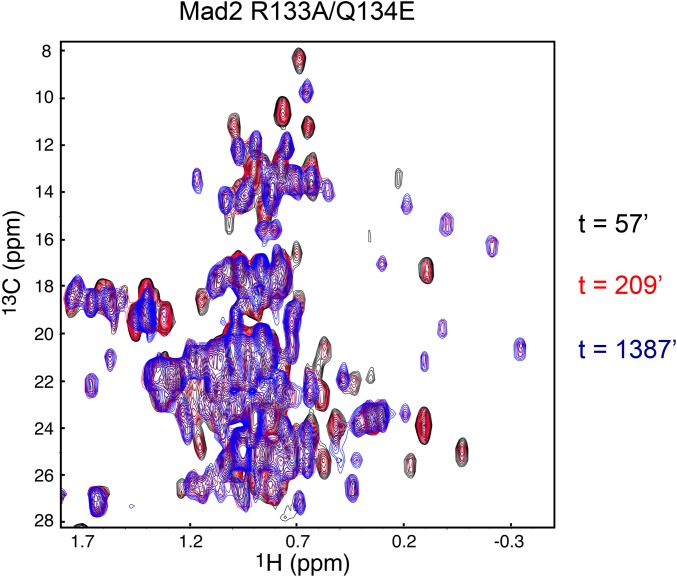
The fact that the L51A mutation further impedes the O–C structural transition of the largely monomeric Mad2 R133A mutant also suggests that I-Mad2 might also be involved in the de novo formation of a C-Mad2 monomer from the O-Mad2 monomer, without the help of another copy of C-Mad2. We thus monitored the O–C structural transition of the monomeric Mad2 R133A/Q134E by successively acquiring a series of 1H/13C HSQC spectra over the period of 60 h. In the first HSQC spectrum, only peaks corresponding to O-Mad2 were observed, indicating that all Mad2 R133A/Q134E was in O-Mad2 conformation (Fig. S7). At the end of the time course, only peaks corresponding to C-Mad2 were observed, indicating that all Mad2 R133/Q134E had completed the transition to C-Mad2. In the HSQC spectra taken in between, we observed two sets of peaks corresponding to either O-Mad2 or C-Mad2, with the C-Mad2 peaks gaining intensity over time. No peaks corresponding to I-Mad2 were observed during the entire course of the experiment. Therefore, I-Mad2 is not a populated intermediate in monomeric Mad2. Asymmetric dimerization with C-Mad2 is required to stabilize the I-Mad2 conformation.
Fig. S7.
There are no populated intermediates during the O–C conformational transition of monomeric Mad2 R133A/Q134E. Overlay of the methyl region of the 1H/13C HSQC spectra of O-Mad2 R133A/Q134E acquired at the indicated times after warming the protein to 30 °C. A series of HSQC spectra each lasting 19 min were taken for over 60 h, and only three representative spectra are shown (t = 57 min, black contours; t = 209 min, red contours; t = 1,387 min, blue contours).
Fluorescence recovery after photobleaching (FRAP) revealed that there were two pools of Mad2 at kinetochores in mammalian cells: a more resident pool that corresponded to the Mad1–C-Mad2 core complex and a fast-exchanging pool that corresponded to a second Mad2 molecule bound to the Mad1–C-Mad2 core through asymmetric dimerization (32). This second Mad2 molecule is likely in the I-Mad2 conformation because I-Mad2–C-Mad2 is the most stable asymmetric Mad2 dimer in vitro (24). The O-Mad2–C-Mad2 docking complex is a transient species. Moreover, the Mad1–C-Mad2 core has been shown to stimulate O-Mad2 binding to Cdc20, consistent with the notion that I-Mad2 is also more active in Cdc20 binding.
Unfortunately, both Mad2 L51A and L54A mutants that were deficient in I-Mad2 formation also bound to C-Mad2 with weaker affinities. We could not obtain mutants that disrupt I-Mad2 formation without affecting C-Mad2 binding, consistent with the notion that C-Mad2 binding and I-Mad2 formation are coupled and possibly inseparable processes. We thus did not perform additional functional assays with these mutants in human cells because any potential defects associated with these mutants could not be cleanly attributed to I-Mad2 formation. Conformation-specific Mad2 antibodies have been used to probe Mad2 conformational dynamics in human cells (33–35). In particular, an antibody developed by Taylor and coworkers specifically recognizes the dynamically bound copy of Mad2, but not Mad1-bound C-Mad2, at kinetochores (33). It will be interesting to test whether this antibody can recognize I-Mad2 in vitro.
Allosteric Communication Between the Dimer Interface and the C-Terminal Region of Mad2.
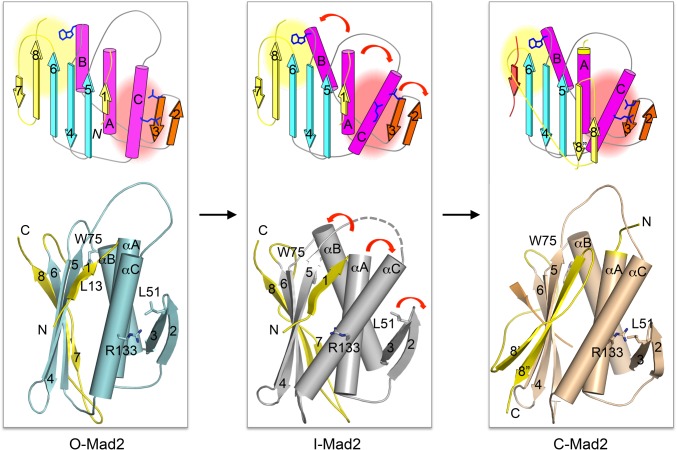
O-Mad2 is not amenable for Cdc20 binding because strands β7/8 of its C-terminal region occupy the ligand-binding site (Fig. 6). In C-Mad2, this C-terminal region dissociates from β6, vacates the ligand-binding site, rearranges into two new strands β8′/8′′, and translocates to pair with β5, forming a seat belt-like structure that traps the ligand in a topological embrace. O-Mad2 is converted to I-Mad2 when bound to C-Mad2 in the Mad1–C-Mad2 core complex. I-Mad2 becomes conformationally activated and is more amenable for Cdc20 binding.
Fig. 6.
Allosteric communications between the C-Mad2 binding site and the C-terminal region of Mad2. Schematic drawings (Top) and diagrams (Bottom) of O-Mad2, I-Mad2, and C-Mad2, with all structural elements labeled. Several key residues are also shown and labeled. In this model, C-Mad2 binding at αC and the β2/3 hairpin induces rearrangement of these elements. This rearrangement in turns triggers changes in the C-terminal region. As a result, I-Mad2 has the O-Mad2 fold, but its core has a conformation that more resembles C-Mad2. In I-Mad2, the hydrophobic core involving W75 on αB and hydrophobic residues on the β7/8 strands is destabilized, increasing the propensity of the β7/8 strands to detach from the Mad2 core.
In this study, we determined the crystal structure of I-Mad2 bound to C-Mad2, which unexpectedly reveals no partial unfolding of β7/8 in the C-terminal region of I-Mad2. Instead, despite having the same folding topology as O-Mad2, the core of I-Mad2 comprising β2–β6 and αA–αC undergoes considerable rigid-body rearrangements and more closely resembles that of C-Mad2 (Fig. 6). We have provided direct NMR evidence for the existence of allosteric communication between the C-Mad2–binding site of I-Mad2 and the C-terminal region. C-Mad2 binding triggers chemical shift perturbations of residues across the entire protein, including those in the C-terminal region, indicating that C-Mad2 binding at one end of I-Mad2 is felt by the C-terminal β7/8 strands at the other end. Our mutagenesis analysis further pinpoints two residues on the β2/3 hairpin, L51 and L54, as critical determinants for this allosteric communication. Mutations of these two residues hinder I-Mad2 formation and slow down the spontaneous O–C structural transition of Mad2.
For Mad2 to topologically entrap Cdc20 and to form C-Mad2, its C-terminal seat-belt region has to undergo partial unfolding. It is widely believed that I-Mad2 is a high-energy intermediate with its C-terminal region unfolded and is thus ready for the entrapment of Cdc20 (13, 14). Contrary to this commonly held belief, our study has now shown that I-Mad2 is still folded in its C-terminal region, but its core is reorganized to resemble C-Mad2. Thus, the partially unfolded Mad2 species ready for Cdc20 entrapment likely represents a fleeting transition state, not a populated intermediate (Fig. S8). We propose that, by rearranging its core to resemble C-Mad2, I-Mad2 can more easily access this fleeting transition state, in which strands β7/8 are detached from β6, making I-Mad2 more active in Cdc20 binding. Free C-Mad2 without a bona fide bound ligand is also more active in Cdc20 binding and APC/C inhibition (24), presumably because it too may more easily reach the transition state with β7/8 detached. Biophysical techniques capable of investigating sparsely populated, excited states of proteins, such as relaxation dispersion NMR spectroscopy (36), are needed to define the nature of this transition state of Mad2.
Fig. S8.
A revised model for conformational activation of Mad2 at kinetochores during mitosis. Because I-Mad2 remains folded in its C-terminal region, the partially unfolded Mad2 species obligatory for the entrapment of Cdc20 represents a fleeting transition state. The nature of this transition-state Mad2 (T-Mad2) is unknown. Note that Mad1 is a dimer, only one copy is shown for clarity.
Conclusion
Mad2 is an unusual multistate protein with multiple folded conformers. One conformer of Mad2 (C-Mad2) can bind and help to convert another conformer (O-Mad2) into itself. This behavior of Mad2 has clear conceptual resemblance to prion-like proteins (14, 19, 37, 38). Our results presented herein have defined the structure of a functional intermediate during the structural transition of Mad2. This intermediate is a hybrid of both conformers, with the O-Mad2 fold and a rearranged core resembling C-Mad2. Thus, the prion-like self-propagation of the C-Mad2 conformer occurs in a stepwise fashion, involving a populated intermediate that is biologically more active. Our findings reinforce the intriguing notion that populated functional intermediates might exist during propagations of canonical prion-like proteins.
Materials and Methods
The protein purification procedures for human Mad2∆N (residues 11–205) and Mad2L13A have been described previously (24). Standard methodologies were used to crystallize Mad2∆N and determine its structure. See SI Materials and Methods for details. Data collection and structure refinement statistics are summarized in Table S1.
SI Materials and Methods
Protein Expression and Purification.
The cDNAs encoding full-length human Mad2 (residues 1–205) and Mad2∆C (residues 1–195) were cloned into a modified pQE30 vector (Qiagen) that included a tobacco etch virus (TEV) protease cleavage site between their N termini and the His6 tag. The coding region of Mad2∆C was also cloned into a modified pGEX6p vector (GE Healthcare) that included a TEV cleavage site between GST and the N terminus of Mad2. The Mad2 mutants were generated with the QuikChange mutagenesis kit (Stratagene). All constructs were verified by DNA sequencing.
The pQE30-TEV-Mad2R133E/Q134A and pQE30-TEV-Mad2∆C plasmids were transformed into the Escherichia coli strain M15[pRep4] cells (Qiagen) for protein expression. The pGEX6p-TEV-Mad2∆C plasmid and the Mad2∆C10 mutant plasmids (Y38A, P39A, E41A, F43A, V46A, K48A, Y49A, L51A, L53A, and L54A) were transformed into the E. coli strain BL21(DE3)-T1R cells (Sigma) for protein expression. For 2D HSQC NMR experiments, uniformly 15N- or 13C-labeled Mad2 proteins were prepared by growing cells in M9 minimal media with 15NH4Cl or 13C-glucose as the sole nitrogen and carbon sources, respectively. For triple resonance experiments, uniformly 15N/13C/2H-labeled Mad2 was prepared by growing cells in 15N- and 13C-containing M9 media in 99% D2O. The N-terminal His6-tagged Mad2 proteins were purified with Ni2+-NTA agarose resin (Qiagen) and cleaved with the TEV protease to remove the His6-tag. The GST-Mad2 fusion proteins were purified with Glutathione Sepharose 4B beads (GE Healthcare) and cleaved with the TEV protease to remove the GST moiety. All TEV-cleaved Mad2 proteins contained only an extra glycine at their N terminus. The Mad2 proteins were further purified by anion exchange chromatography with a resource Q column, followed by size exclusion chromatography with a Superdex 75 column (GE Healthcare). The purified Mad2 NMR samples typically contained 0.2–1 mM protein in a buffer containing 50 mM sodium phosphate (pH 6.8), 300 mM KCl, and 1 mM DTT.
Crystallization, Data Collection, and Structure Determination.
Crystals of Mad2ΔN could be grown over a range of protein concentrations (5–80 mg/mL), using hanging-drop vapor diffusion in 1.6 M (NH4)2SO4 and 0.1 M Hepes, pH 7.5. Crystals usually grew in 4 mo at 21 °C. Crystals were cryo-protected and frozen in mother liquor supplemented with 20% (vol/vol) glycerol. We obtained one crystal with a thin plate morphology and dimensions of 100 × 100 × 10 μm3 that diffracted to a minimum Bragg spacing (dmin) of 3.95 Å, after screening about 100 similar crystals. The crystal exhibited the symmetry of space group P21 with unit cell dimensions of a = 124.8 Å, b = 104.9 Å, c = 157.8 Å, and β = 97.6°, and contained six Mad2∆N dimers per asymmetric unit.
A highly redundant diffraction dataset with this Mad2∆N dimer crystal was collected at the Advanced Photon Source beamline 19-ID at 120 K. Diffraction data were processed with HKL2000 (39). Molecular replacement was performed using PHASER, with six Mad2LL dimers (PDB ID code 2V64, chains A and E) as the search model. The model was refined with CNS and PHENIX (40) using grouped B-factor refinement and sixfold noncrystallographic symmetry (NCS) restraints between related Mad2 monomers, excluding residues that display significant differences between NCS-related chains. The model was later refined with TLS (translation, libration, and screw-motion) refinement in PHENIX with each Mad2 chain as a separate TLS group. To remove model bias, the model was subjected to simulated annealing, and the Sigma-A weighted omit maps were visually inspected. Model building and validation were performed with COOT (41), PROCHECK, and MolProbity (42). Data collection and structure refinement statistics are summarized in Table S1.
NMR Spectroscopy.
All NMR spectra were recorded at 30 °C on Varian Inova 600 MHz spectrometers equipped with four channels and pulsed-field gradients using H2O/D2O 95:5 (vol/vol) as the solvent. Sequential backbone resonance assignment of I-Mad2 was achieved with TROSY-modified HNCA, HN(CO)CA, HN(CA)CB, and HN(COCA)CB triple resonance experiments recorded on a sample of uniformly 15N/13C/2H-labeled Mad2∆C bound to nonlabeled Mad2L13A–MBP1 at a 1:1.2 ratio in H2O. To monitor the spontaneous conformational change of Mad2, a series of 1D or 2D HSQC NMR spectra were acquired on the desired Mad2 proteins in the O-Mad2 conformation at the start of the experiments. Data were processed and analyzed with the NMRPipe (43) and NMRView (44).
Isothermal Titration Calorimetry.
ITC was performed with a VP-ITC titration calorimeter (MicroCal Inc.) at 20 °C. Calorimetric measurements were performed on the binding reactions between purified Mad2∆C proteins and the Mad2–MBP1 complex. For each titration experiment, 2 mL of 20 µM Mad2–MBP1 complex in a buffer containing 50 mM sodium phosphate (pH 6.8), 300 mM KCl, and 0.5 mM tris(2-carboxyethyl)phosphine (TCEP) was added to the calorimeter cell. WT or mutant Mad2∆C proteins (0.3–0.4 mM) in the same buffer were injected in 35 portions of 8 µL with an injection syringe. Binding parameters were evaluated using the Origin software package provided with the instrument.
Acknowledgments
We thank Mischa Machius for help in Mad2∆N structure determination and Josep Rizo for assistance in NMR experiments. E.Ö. performed this work when he was a graduate student in the laboratory of Johann Deisenhofer. Use of the Argonne National Laboratory Structural Biology Center beamlines at the Advanced Photon Source was supported by the US Department of Energy under Contract DE-AC02-06CH11357. The DD2 console of the 600 MHz NMR spectrometer was supported by National Institutes of Health Grant S10RR026461-01. H.Y. is an investigator with the Howard Hughes Medical Institute. This research was supported by Welch Foundation Grant I-1441 (to H.Y.) and National Institutes of Health Grant GM107415 (to X.L.).
Footnotes
The authors declare no conflict of interest.
This article is a PNAS Direct Submission.
Data deposition: The atomic coordinates and structure factors for the human Mad2∆N dimer have been deposited in the Protein Data Bank, www.pdb.org (PDB ID code 3GMH).
This article contains supporting information online at www.pnas.org/lookup/suppl/doi:10.1073/pnas.1512197112/-/DCSupplemental.
References
- 1.Cheeseman IM, Desai A. Molecular architecture of the kinetochore-microtubule interface. Nat Rev Mol Cell Biol. 2008;9(1):33–46. doi: 10.1038/nrm2310. [DOI] [PubMed] [Google Scholar]
- 2.Tanaka TU. Kinetochore-microtubule interactions: Steps towards bi-orientation. EMBO J. 2010;29(24):4070–4082. doi: 10.1038/emboj.2010.294. [DOI] [PMC free article] [PubMed] [Google Scholar]
- 3.Peters JM. The anaphase promoting complex/cyclosome: A machine designed to destroy. Nat Rev Mol Cell Biol. 2006;7(9):644–656. doi: 10.1038/nrm1988. [DOI] [PubMed] [Google Scholar]
- 4.Yu H. Cdc20: A WD40 activator for a cell cycle degradation machine. Mol Cell. 2007;27(1):3–16. doi: 10.1016/j.molcel.2007.06.009. [DOI] [PubMed] [Google Scholar]
- 5.Sivakumar S, Gorbsky GJ. Spatiotemporal regulation of the anaphase-promoting complex in mitosis. Nat Rev Mol Cell Biol. 2015;16(2):82–94. doi: 10.1038/nrm3934. [DOI] [PMC free article] [PubMed] [Google Scholar]
- 6.Peters JM, Tedeschi A, Schmitz J. The cohesin complex and its roles in chromosome biology. Genes Dev. 2008;22(22):3089–3114. doi: 10.1101/gad.1724308. [DOI] [PubMed] [Google Scholar]
- 7.Haarhuis JH, Elbatsh AM, Rowland BD. Cohesin and its regulation: On the logic of X-shaped chromosomes. Dev Cell. 2014;31(1):7–18. doi: 10.1016/j.devcel.2014.09.010. [DOI] [PubMed] [Google Scholar]
- 8.Foley EA, Kapoor TM. Microtubule attachment and spindle assembly checkpoint signalling at the kinetochore. Nat Rev Mol Cell Biol. 2013;14(1):25–37. doi: 10.1038/nrm3494. [DOI] [PMC free article] [PubMed] [Google Scholar]
- 9.Jia L, Kim S, Yu H. Tracking spindle checkpoint signals from kinetochores to APC/C. Trends Biochem Sci. 2013;38(6):302–311. doi: 10.1016/j.tibs.2013.03.004. [DOI] [PubMed] [Google Scholar]
- 10.London N, Biggins S. Signalling dynamics in the spindle checkpoint response. Nat Rev Mol Cell Biol. 2014;15(11):736–747. doi: 10.1038/nrm3888. [DOI] [PMC free article] [PubMed] [Google Scholar]
- 11.Sacristan C, Kops GJ. Joined at the hip: Kinetochores, microtubules, and spindle assembly checkpoint signaling. Trends Cell Biol. 2015;25(1):21–28. doi: 10.1016/j.tcb.2014.08.006. [DOI] [PubMed] [Google Scholar]
- 12.Lara-Gonzalez P, Westhorpe FG, Taylor SS. The spindle assembly checkpoint. Curr Biol. 2012;22(22):R966–R980. doi: 10.1016/j.cub.2012.10.006. [DOI] [PubMed] [Google Scholar]
- 13.Mapelli M, Musacchio A. MAD contortions: Conformational dimerization boosts spindle checkpoint signaling. Curr Opin Struct Biol. 2007;17(6):716–725. doi: 10.1016/j.sbi.2007.08.011. [DOI] [PubMed] [Google Scholar]
- 14.Luo X, Yu H. Protein metamorphosis: The two-state behavior of Mad2. Structure. 2008;16(11):1616–1625. doi: 10.1016/j.str.2008.10.002. [DOI] [PMC free article] [PubMed] [Google Scholar]
- 15.Luo X, et al. Structure of the Mad2 spindle assembly checkpoint protein and its interaction with Cdc20. Nat Struct Biol. 2000;7(3):224–229. doi: 10.1038/73338. [DOI] [PubMed] [Google Scholar]
- 16.Luo X, Tang Z, Rizo J, Yu H. The Mad2 spindle checkpoint protein undergoes similar major conformational changes upon binding to either Mad1 or Cdc20. Mol Cell. 2002;9(1):59–71. doi: 10.1016/s1097-2765(01)00435-x. [DOI] [PubMed] [Google Scholar]
- 17.Sironi L, et al. Crystal structure of the tetrameric Mad1-Mad2 core complex: Implications of a ‘safety belt’ binding mechanism for the spindle checkpoint. EMBO J. 2002;21(10):2496–2506. doi: 10.1093/emboj/21.10.2496. [DOI] [PMC free article] [PubMed] [Google Scholar]
- 18.Luo X, et al. The Mad2 spindle checkpoint protein has two distinct natively folded states. Nat Struct Mol Biol. 2004;11(4):338–345. doi: 10.1038/nsmb748. [DOI] [PubMed] [Google Scholar]
- 19.De Antoni A, et al. The Mad1/Mad2 complex as a template for Mad2 activation in the spindle assembly checkpoint. Curr Biol. 2005;15(3):214–225. doi: 10.1016/j.cub.2005.01.038. [DOI] [PubMed] [Google Scholar]
- 20.Chung E, Chen RH. Spindle checkpoint requires Mad1-bound and Mad1-free Mad2. Mol Biol Cell. 2002;13(5):1501–1511. doi: 10.1091/mbc.02-01-0003. [DOI] [PMC free article] [PubMed] [Google Scholar]
- 21.Chen RH, Shevchenko A, Mann M, Murray AW. Spindle checkpoint protein Xmad1 recruits Xmad2 to unattached kinetochores. J Cell Biol. 1998;143(2):283–295. doi: 10.1083/jcb.143.2.283. [DOI] [PMC free article] [PubMed] [Google Scholar]
- 22.Chen RH, Waters JC, Salmon ED, Murray AW. Association of spindle assembly checkpoint component XMAD2 with unattached kinetochores. Science. 1996;274(5285):242–246. doi: 10.1126/science.274.5285.242. [DOI] [PubMed] [Google Scholar]
- 23.Mapelli M, et al. Determinants of conformational dimerization of Mad2 and its inhibition by p31comet. EMBO J. 2006;25(6):1273–1284. doi: 10.1038/sj.emboj.7601033. [DOI] [PMC free article] [PubMed] [Google Scholar]
- 24.Yang M, et al. Insights into Mad2 regulation in the spindle checkpoint revealed by the crystal structure of the symmetric Mad2 dimer. PLoS Biol. 2008;6(3):e50. doi: 10.1371/journal.pbio.0060050. [DOI] [PMC free article] [PubMed] [Google Scholar]
- 25.Yang M, et al. p31comet blocks Mad2 activation through structural mimicry. Cell. 2007;131(4):744–755. doi: 10.1016/j.cell.2007.08.048. [DOI] [PMC free article] [PubMed] [Google Scholar]
- 26.Overlack K, et al. A molecular basis for the differential roles of Bub1 and BubR1 in the spindle assembly checkpoint. eLife. 2015;4:e05269. doi: 10.7554/eLife.05269. [DOI] [PMC free article] [PubMed] [Google Scholar]
- 27.Di Fiore B, et al. The ABBA motif binds APC/C activators and is shared by APC/C substrates and regulators. Dev Cell. 2015;32(3):358–372. doi: 10.1016/j.devcel.2015.01.003. [DOI] [PMC free article] [PubMed] [Google Scholar]
- 28.Kulukian A, Han JS, Cleveland DW. Unattached kinetochores catalyze production of an anaphase inhibitor that requires a Mad2 template to prime Cdc20 for BubR1 binding. Dev Cell. 2009;16(1):105–117. doi: 10.1016/j.devcel.2008.11.005. [DOI] [PMC free article] [PubMed] [Google Scholar]
- 29.Mapelli M, Massimiliano L, Santaguida S, Musacchio A. The Mad2 conformational dimer: Structure and implications for the spindle assembly checkpoint. Cell. 2007;131(4):730–743. doi: 10.1016/j.cell.2007.08.049. [DOI] [PubMed] [Google Scholar]
- 30.Ikura M, et al. Solution structure of a calmodulin-target peptide complex by multidimensional NMR. Science. 1992;256(5057):632–638. doi: 10.1126/science.1585175. [DOI] [PubMed] [Google Scholar]
- 31.Ikura M, et al. Secondary structure and side-chain 1H and 13C resonance assignments of calmodulin in solution by heteronuclear multidimensional NMR spectroscopy. Biochemistry. 1991;30(38):9216–9228. doi: 10.1021/bi00102a013. [DOI] [PubMed] [Google Scholar]
- 32.Shah JV, et al. Dynamics of centromere and kinetochore proteins: Implications for checkpoint signaling and silencing. Curr Biol. 2004;14(11):942–952. doi: 10.1016/j.cub.2004.05.046. [DOI] [PubMed] [Google Scholar]
- 33.Hewitt L, et al. Sustained Mps1 activity is required in mitosis to recruit O-Mad2 to the Mad1-C-Mad2 core complex. J Cell Biol. 2010;190(1):25–34. doi: 10.1083/jcb.201002133. [DOI] [PMC free article] [PubMed] [Google Scholar]
- 34.Westhorpe FG, Tighe A, Lara-Gonzalez P, Taylor SS. p31comet-mediated extraction of Mad2 from the MCC promotes efficient mitotic exit. J Cell Sci. 2011;124(Pt 22):3905–3916. doi: 10.1242/jcs.093286. [DOI] [PMC free article] [PubMed] [Google Scholar]
- 35.Fava LL, Kaulich M, Nigg EA, Santamaria A. Probing the in vivo function of Mad1:C-Mad2 in the spindle assembly checkpoint. EMBO J. 2011;30(16):3322–3336. doi: 10.1038/emboj.2011.239. [DOI] [PMC free article] [PubMed] [Google Scholar]
- 36.Neudecker P, Lundström P, Kay LE. Relaxation dispersion NMR spectroscopy as a tool for detailed studies of protein folding. Biophys J. 2009;96(6):2045–2054. doi: 10.1016/j.bpj.2008.12.3907. [DOI] [PMC free article] [PubMed] [Google Scholar]
- 37.Collinge J, Clarke AR. A general model of prion strains and their pathogenicity. Science. 2007;318(5852):930–936. doi: 10.1126/science.1138718. [DOI] [PubMed] [Google Scholar]
- 38.Skinner JJ, Wood S, Shorter J, Englander SW, Black BE. The Mad2 partial unfolding model: Regulating mitosis through Mad2 conformational switching. J Cell Biol. 2008;183(5):761–768. doi: 10.1083/jcb.200808122. [DOI] [PMC free article] [PubMed] [Google Scholar]
- 39.Otwinowski Z, Minor W. Processing X-ray diffraction data collected in oscillation mode. Methods Enzymol. 1997;276:307–326. doi: 10.1016/S0076-6879(97)76066-X. [DOI] [PubMed] [Google Scholar]
- 40.Adams PD, et al. PHENIX: A comprehensive Python-based system for macromolecular structure solution. Acta Crystallogr D Biol Crystallogr. 2010;66(Pt 2):213–221. doi: 10.1107/S0907444909052925. [DOI] [PMC free article] [PubMed] [Google Scholar]
- 41.Emsley P, Cowtan K. Coot: Model-building tools for molecular graphics. Acta Crystallogr D Biol Crystallogr. 2004;60(Pt 12 Pt 1):2126–2132. doi: 10.1107/S0907444904019158. [DOI] [PubMed] [Google Scholar]
- 42.Chen VB, et al. MolProbity: All-atom structure validation for macromolecular crystallography. Acta Crystallogr D Biol Crystallogr. 2010;66(Pt 1):12–21. doi: 10.1107/S0907444909042073. [DOI] [PMC free article] [PubMed] [Google Scholar]
- 43.Delaglio F, et al. NMRPipe: A multidimensional spectral processing system based on UNIX pipes. J Biomol NMR. 1995;6(3):277–293. doi: 10.1007/BF00197809. [DOI] [PubMed] [Google Scholar]
- 44.Johnson BA, Blevins RA. NMR View: A computer program for the visualization and analysis of NMR data. J Biomol NMR. 1994;4(5):603–614. doi: 10.1007/BF00404272. [DOI] [PubMed] [Google Scholar]


