Abstract
Objective:
The objective of this study was to fully characterize the mechanics of an in vivo impactor and correlate the mechanics with superficial cracking of articular surfaces.
Design:
A spring-loaded impactor was used to apply energy-controlled impacts to the articular surfaces of neonatal bovine cartilage. The simultaneous use of a load cell and displacement sensor provided measurements of stress, stress rate, strain, strain rate, and strain energy density. Application of India ink after impact was used to correlate the mechanical inputs during impact with the resulting severity of tissue damage. Additionally, a signal processing method to deconvolve inertial stresses from impact stresses was developed and validated.
Results:
Impact models fit the data well (root mean square error average ~0.09) and provided a fully characterized impact. Correlation analysis between mechanical inputs and degree of superficial cracking made visible through India ink application provided significant positive correlations for stress and stress rate with degree of surface cracking (R2 = 0.7398 and R2 = 0.5262, respectively). Ranges of impact parameters were 7 to 21 MPa, 6 to 40 GPa/s, 0.16 to 0.38, 87 to 236 s−1, and 0.3 to 1.1 MJ/m3 for stress, stress rate, strain, strain rate, and strain energy density, respectively. Thresholds for damage for all inputs were determined at 13 MPa, 15 GPa/s, 0.23, 160 s−1, and 0.59 MJ/m3 for this system.
Conclusions:
This study provided the mechanical basis for use of a portable, sterilizable, and maneuverable impacting device. Use of this device enables controlled impact loads in vitro or in vivo to connect mechanistic studies with long-term monitoring of disease progression.
Keywords: articular cartilage, in vitro, posttraumatic arthritis
Introduction
Osteoarthritis (OA) is the leading cause of chronic disability in the United States, and a significant fraction of OA cases are attributable to previous joint trauma (i.e., posttraumatic osteoarthritis [PTOA]).1-3 No therapies currently exist that prevent or slow progression of PTOA, and mounting evidence suggests that interventions must occur in the acute time frame after injury to effectively modify the course of the disease.4 Therefore, research models that allow interrogation of pathologic mechanisms immediately following impact injury are critical to the development of preventative therapies. Both in vitro and in vivo impact models have been applied to native articular cartilage. Common methods to deliver impact injury include drop towers,5-7 pendulums,8 and more recently spring-loaded impactors.9-12 Unlike stress or strain controlled impact systems,13-15 these impacting methods deliver a quick, single impact where energy input is correlated to the initial height of a weight or pendulum or to the stretch of a spring. With such systems, it is difficult to fully characterize an insult mechanically as both stress and strain data are difficult to capture with such quick insults that occur during time scales on the order of milliseconds.
In previous work, an in vivo impactor9 consisting of a spring-loaded missile attached to a load cell was used to measure impact force, while pressure-sensitive film provided an estimate of contact area and impact stress. This device has major advantages for use in vivo including compact design (allowing sterilization and intraarticular positioning of the impactor tip) and rapid impact delivery. Limitations of the design include a lack of information on the deformations that occur during impact, as well as inertial effects of having a mounted load cell accelerate prior to impact that may confound real-time measurements of load during impact. In the present study, we have modified the impactor to more fully characterize the insult. Addition of a displacement sensor provided real-time displacement data. In addition to providing impact strain data, this allowed the calculation of the strain energy density, a possible metric for predicting surface damage.16
The goals of this study were 3-fold: (1) present a fully characterized insult that is capable of correlating stress, stress rate, strain, strain rate, and strain energy density to severity of damage (i.e., surface cracking); (2) provide a method to reduce inertial artifacts that occur when a load cell is mounted to a moving section of an impactor; and (3) determine which mechanical inputs correlate most strongly with measured surface damage.
Materials and Methods
Impactor Modification
A spring-loaded impactor presented by Alexander et al.9 was modified in this study to simultaneously provide stress and strain data (Fig. 1). In short, a 12-mm diameter impacting head was mounted in line with the axis of a spring that was compressed to produce energy-controlled impacts. The impact force was measured at 50 kHz by a load cell (PCBPiezotronics, Depew, NY) attached to the impactor tip. A linear variable differential transducer (LVDT; RDP Electronics, Pottstown PA) was mounted in parallel with the impactor and attached to the impactor tip to measure the depth of penetration of the impactor tip into a sample in real time.
Figure 1.
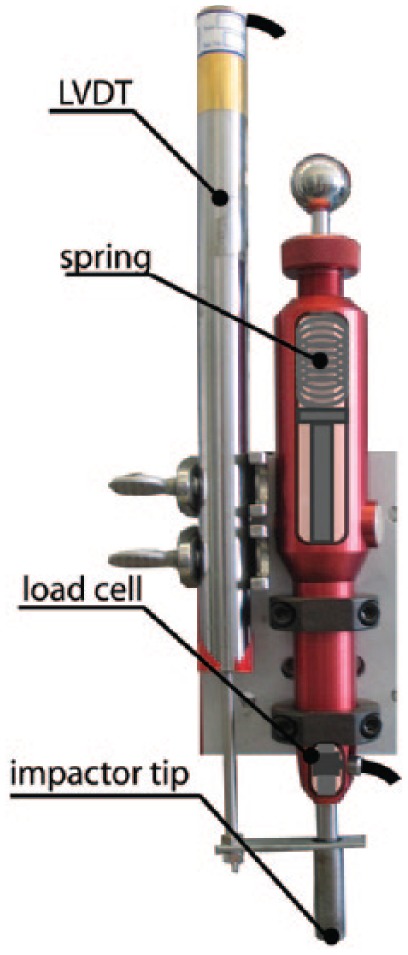
The spring-loaded impactor used in this study was modified from previous studies9,10 to include a displacement sensor (LVDT). This sensor was added in parallel with the impactor tip.
Sample Preparation and Analysis
In these validation studies, neonatal bovine cartilage was impacted and analyzed. Femoral condyle cartilage was explanted from 1- to 3-day-old bovids within 48 hours of sacrifice and sectioned into 6 mm diameter by 3 mm thick cylinders with the articular surface intact. Samples contained the majority of the deep zone tissue but no subchondral bone. Twelve samples were impacted under 6 different stretches of the internal spring, and voltages from the load cell and LVDT were recorded simultaneously with a custom LabVIEW program (NI, Austin TX). In the present study, a plane-ended impactor tip was used resulting in an impact configuration consistent with unconfined compression.
After impact, India ink was applied to the articular surfaces to detect superficial cracking and fibrillation. Consistently for all samples, several drops from a transfer pipette were applied to the surface and allowed to sit for no more than 3 minutes, after this time the samples were rinsed in phosphate-buffered saline (PBS) and wiped with a PBS-soaked Kimwipe to remove unbound dye. To quantify the amount of surface damage, photographs of the stained surfaces were imported into ImageJ (NIH, Bethesda, MD) and converted to binary images. The area percent of surface staining was recorded as a measure of surface damage.
Signal Analysis and Processing
Throughout all 12 impacts, the recorded voltage from the load cell resembled a 2-peaked impulse while the LVDT voltage resembled a 1-peak impulse. This 2-peak impulse, considered an artifact of accelerating the load cell along with the impacting head prior to impact, can systematically confound further mechanical analyses such as calculations of peak stress and stress rate. The first voltage peak is a result of the spring hitting the load cell and accelerating it downward. This portion of the impact is not directly applied to the cartilage surface. Here, we present a method of data analysis to remove the inertial artifact.
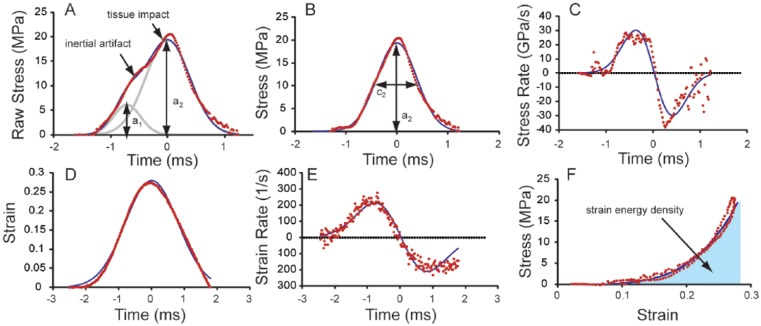
Assuming that the load cell signal is composed of 2 impulses, one peak when the load cell accelerated downward and one when the cartilage was impacted, the raw stress data were fitted to the sum of 2 Gaussian impulses given by the equation:
where σ is the stress signal from the load cell, a, b, and c are constant fit parameters, and t is time. The constants a, b, and c correspond to the amplitudes of the impacts, the times when the impact peaks occur, and the durations (i.e., the standard deviation) of the impacts, respectively. The subscripts 1 and 2 correspond to the first and second impulses, respectively. The model constants were obtained by minimizing root mean square error (RMSE) between the model and data using a custom-developed Excel program (available on request). By subtracting the first impulse from the raw data, we obtained a corrected raw data set and corrected model curve:
The corrected data and model fit (Equations 2 and 3) are shown in Figure 2B where the parameters a and c from Equation (3) are highlighted for clarity. Obtaining a corrected data set and model fit allowed for calculation of stress rate both numerically and from differentiation of the model (Fig. 2C). The equations for both the numerical and explicit stress rates are given by
Figure 2.
(A) The raw (unmodified) stress signal resembled a 2-peaked impulse for all impacts and fit well to the impact model (Equation 1). (B) The corrected stress signal fit well to a single impulse model (Equations 2 and 3). The constants a and c are shown for clarity. (C) Stress rate data of both the data and explicit derivative of the model (Equations 4 and 5). (D) Strain data fit well to a single impulse model (Equation 6). (E) Strain rate obtained similarly to stress rate. (F) Integration of the stress–strain curve provides a value for strain energy density.
where a numerical derivative is taken over 5 data points to minimize noise and an explicit derivative of the model is taken with respect to time. Similar precautions were not necessary for strain and strain rate taken from the LVDT due to the 1-peak nature of the raw data. The strain model was similar to the stress model in Equation (3) and is given by
where ε is strain and a3, b3, and c3 are distinct constants. Strain rates were then calculated in a similar way to stress rates.
Impact Strain Energy Density
With both stress and strain data available for each impact, the data were parametrically presented on a stress–strain curve. With this relationship, the strain energy density applied during an impact may be calculated from the following equation:
where e is the strain energy density (energy applied per unit volume), ε is strain, and εmax is the maximum strain during an impact. For the impacts in this study, a right rectangular approximation of the integral was used to determine the amount of energy applied during an impact. The strain energy density is shaded in the stress strain curve for clarity (Fig. 2F). Due to the high frequency of data collection and using different sensors for stress and strain, the data were inconsistently out of phase, although the strain rates would imply an elastic response due to deformations greatly exceeding the gel diffusion rate in cases where there is minimal energy dissipation through viscous losses or damage initiation13,17 (Peclet number ~ 106). Due to this drawback in data acquisition, an elastic response was modeled where the peak stress and strain were assumed to occur at the same time.
Results
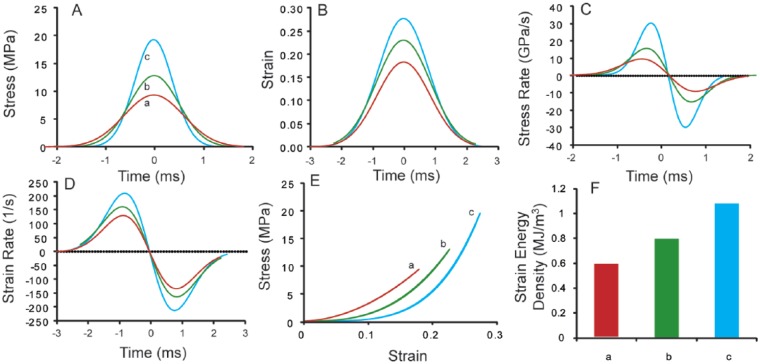
A representative fit of Equation (1) is presented in Figure 2A, where raw data are dotted, the full fit is the solid line, and the 2 Gaussian impulses are shaded in the background. Representative data and fits for stress, stress rate, strain, strain rate, and stress–strain are shown in Figure 2B-F, where strain energy density is the shaded area in Figure 2F. Impacts with varying spring deflections provided a range of stress, stress rate, strain, strain rate, and impact energy values (Fig. 3). Peak impact stresses ranged from 7 to 22 MPa, with peak stress rates ranging from 6 to 40 GPa/s. The raw data fit well to the impulse models with average (± standard deviation, n = 12) coefficients of variation of the RMSE equal to 0.087 ± 0.028 and 0.103 ± 0.041 for the fits of Equations (1) and (3), respectively. Similarly, peak strains ranged from 0.16 to 0.38, and peak strain rates ranged from 87 to 240 s−1. As with the stress data, all of the strain data fit well to the impulse models with average coefficient of variation of the RMSE equal to 0.084 ± 0.032. Relating stress and strain through the energy density relationship (Equation 7), peak strain energy density varied from 0.302 to 1.08 MJ/m3. Both peak stress and peak strain had a significant positive correlation with strain energy density (P < 0.05, data not shown). Furthermore, in 8 independent impacts at the same spring deflection, the coefficients of variation for stress, stress rate, strain, strain rate, and strain energy density were 0.066, 0.11, 0.088, 0.045, and 0.062, respectively (Fig. 4, n = 8).
Figure 3.
Typical model traces for (A) stress, (B) strain, (C) stress rate, (D) strain rate, (E) stress–strain, and (F) strain energy density. The letters a, b, and c denote data corresponding to impacts conducted at 3 different deflections of the internal spring.
Figure 4.
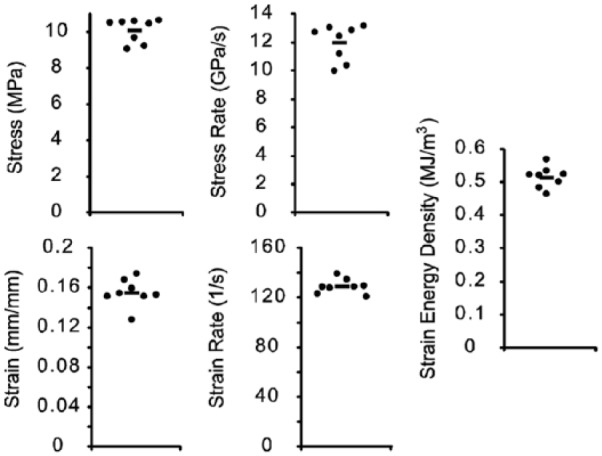
The repeatability of the impactor was shown through independent impacts at one spring deflection (n = 8, bars denote mean).
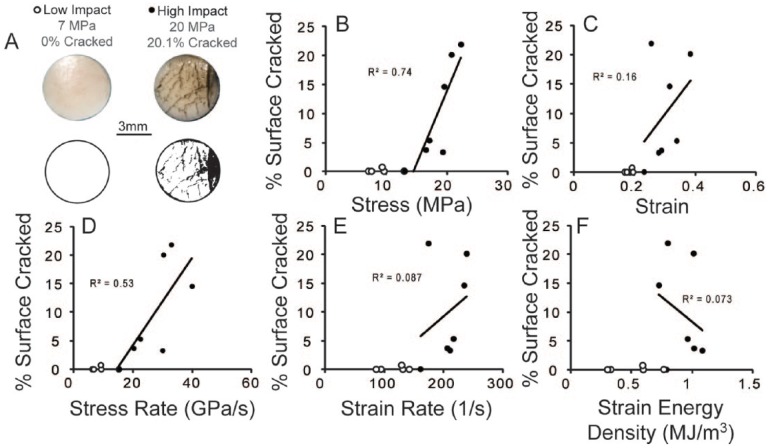
Image analysis of the articular surfaces revealed significant cracking (arbitrarily determined at >1% staining by area) in samples with higher energy impacts. No significant surface damage was observed for peak stresses, stress rates, strains, strain rates, and strain energy densities below 13 MPa, 15 GPa/s, 0.23, and 160 s−1, and 0.59 MJ/m3, respectively (Fig. 5). Stress and stress rate correlated significantly with surface damage (Fig. 5, P < 0.05), while strain, strain rate, and strain energy density did not. These fits predicted damage thresholds of 14.4 MPa and 13.9 GPa/s for stress and stress rate, respectively, for this impacting system and tissue.
Figure 5.
Twelve samples were impacted at 6 different deflections of the internal spring. (A) Representative photographs and binary images of the 6 mm diameter surface for low (below damage threshold) and high impact (above damage threshold) samples after application of India ink. (B-F) Correlations between surface cracking and mechanical aspects of impact were determined from closed circle data points, which included all data points with >1% cracking and the highest point that did not reveal cracking. Only stress (B) and stress rate (D) provided significant correlations with surface cracking (P < 0.05).
Discussion
This study describes the characterization of mechanical consequences of impact injuries to articular cartilage delivered with a hand-held instrument. This instrument, which has been previously used to deliver impact injuries in vivo,9 delivers impacts with peak stresses up to 20 MPa on a time scale of 2 ms, producing stress rates up to 40 GPa/s and macro-scale strains and strain rates of 0.4 and 200 s−1, respectively. Use of this instrument enabled the identification of thresholds of mechanical inputs above which visible fissures were induced in the articular surfaces of cartilage explants. The mechanical factors that most strongly correlated with the development of tissue cracks were stress and stress rate.
The characterization of this model enables more mechanistic studies of PTOA in vivo. The ability to easily move and sterilize the impactor allows it to be used within the operating room. Furthermore, the ability to perform the impacts at arbitrary angles, as opposed to the vertical angles necessary for drop towers and horizontal angles necessary for pendulum systems, makes this system easier to use for in vivo studies where animal positioning may become a limiting factor. In addition to these innovations, the impacts have been shown to be fully characterized and controllable. This system enables controlled impacts in vitro and in vivo that may enable direct comparisons of mechanistic studies with long-term monitoring of disease progression.
The fully characterized mechanical insult resulted from the addition of a displacement sensor that provided the basis for measuring strain, strain rate, and also strain energy density. By correlating all of the mechanical aspects of the impact with observed surface damage, we unexpectedly found that only stress and stress rate significantly correlated with degree of surface damage. Although the correlations provided threshold values for only stress and stress rate, threshold values for strain, strain rate, and strain energy density were evident in the surface cracking plots (Fig. 5). Due to inherent variability between samples it is likely that strain, strain rate, and strain energy density are not sensitive metrics for predicting degree of surface damage. In addition to intersample variation, the finding that stress and stress rate are more predictive of damage than strain, strain rate, or strain energy density may be because they are more directly related to internal fluid pressure, which is known to be an important factor in the failure of poroelastic/biphasic materials through hydraulic fracturing.18 Consistent with other studies,13 this study suggests that stress and stress rate are the most sensitive metrics for predicting cartilage surface damage.
In the context of other studies, this device provides a set of impact parameters that fall in range of those previously reported. Other spring-loaded systems estimated peak stresses of 17 to 80 MPa, but did not provide data on stress rates or tissue strains.12 In a drop tower system peak stresses of 60 MPa19 were observed while a strain-controlled system provided peak stresses of 14 MPa.13 Between those studies, peak strain rates ranged from 1000 s−1 to 0.07 s−1, respectively. Similarly, stress rates from other studies have varied from 35 MPa/s to 2.5 GPa/s for a strain controlled system and a pendulum system, respectively,8,20 but stress rate was not reported for the drop tower study. Previous in vitro studies using this system reported correlations between peak stress, cell death, proteoglycan release, and surface fissuring in a range similar to the one reported here (~17 MPa peak stress).10 It should be noted, however, that contact geometry and boundary conditions can also affect comparisons, where the results in this study utilized explants with no subchondral bone and are impacted in unconfined compression may differ from other configurations.
The stress and stress rate values determined in this study were obtained from fitting the data to a modified Gaussian impulse model. This model (Equations 1-5) was used to deconvolve inertial and impact signals from the mounted load cell. In vivo impact systems that operate using a mounted load cell that accelerates during impact may also have an inertial artifact present during the impulse force trace. The method used here corrects for this inertial artifact allowing calculation of stresses and stress rates that are not confounded by inertial effects. Simply put, the inertial artifact would overestimate the strain energy density and may also result in higher stresses and stress rates in cases where the inertial peak exceeds or occurs faster than the tissue impact peak, respectively.
This study suggests that stress and stress rate may be sufficient to predict severity of impact after full characterization of an impact system. Future in vivo studies utilizing this system and analysis framework may reduce the current knowledge gap surrounding the mechanical and biological aspects of PTOA and provide information necessary to develop preventative strategies following cartilage injury.
Footnotes
Acknowledgments and Funding: The authors gratefully acknowledge financial support from the National Science Foundation Graduate Research Fellowship Program, National Institutes of Health (Z01 AR41131 and T32 RR007059), Commonwealth of Pennsylvania Department of Health (SAP 4100050913), and the Harry M. Zweig Foundation for Equine Research.
Declaration of Conflicting Interests: The author(s) declared no potential conflicts of interest with respect to the research, authorship, and/or publication of this article.
Ethical Approval: No live animals were used in this study. It was exempt from IACUC approval.
References
- 1. Anderson DD, Chubinskaya S, Guilak F, Martin JA, Oegema TR, Olson SA, et al. Post-traumatic osteoarthritis: improved understanding and opportunities for early intervention. J Orthop Res. 2011;29(6):802-9. doi: 10.1002/jor.21359. [DOI] [PMC free article] [PubMed] [Google Scholar]
- 2. Buckwalter JA, Saltzman C, Brown T. The impact of osteoarthritis: implications for research. Clin Orthop Relat Res. 2004;(427 Suppl):S6-S15. [DOI] [PubMed] [Google Scholar]
- 3. Brown TD, Johnston RC, Saltzman CL, Marsh JL, Buckwalter JA. Posttraumatic osteoarthritis: a first estimate of incidence, prevalence, and burden of disease. J Orthop Trauma. 2006;20(10):739-44. doi: 10.1097/01.bot.0000246468.80635.ef. [DOI] [PubMed] [Google Scholar]
- 4. Chu CR, Beynnon BD, Buckwalter JA, Garrett WE, Jr, Katz JN, Rodeo SA, et al. Closing the gap between bench and bedside research for early arthritis therapies (EARTH): report from the AOSSM/NIH U-13 Post-Joint Injury Osteoarthritis Conference II. Am J Sports Med. 2011;39(7):1569-78. doi: 10.1177/0363546511411654. [DOI] [PMC free article] [PubMed] [Google Scholar]
- 5. Jeffrey JE, Gregory DW, Aspden RM. Matrix damage and chondrocyte viability following a single impact load on articular cartilage. Arch Biochem Biophys. 1995;322(1):87-96. doi: 10.1006/abbi.1995.1439. [DOI] [PubMed] [Google Scholar]
- 6. Burgin LV, Aspden RM. A drop tower for controlled impact testing of biological tissues. Med Eng Phys. 2007;29(4):525-30. doi: 10.1016/j.medengphy.2006.06.002. [DOI] [PubMed] [Google Scholar]
- 7. Finlay JB, Repo RU. Cartilage impact in vitro: effect of bone and cement. J Biomech. 1978;11(8-9):379-88. doi: 10.1016/0021-9290(78)90072-6. [DOI] [PubMed] [Google Scholar]
- 8. Borrelli J, Burns ME, Ricci WM, Silva MJ. A method for delivering variable impact stresses to the articular cartilage of rabbit knees. J Orthop Trauma. 2002;16(3):182-8. [DOI] [PubMed] [Google Scholar]
- 9. Alexander PG, McCarron JA, Levine MJ, Melvin GM, Murray PJ, Manner PA, et al. An in vivo lapine model for impact-induced injury and osteoarthritic degeneration of articular cartilage. Cartilage. 2012;3(4):323-33. doi: 10.1177/1947603512447301. [DOI] [PMC free article] [PubMed] [Google Scholar]
- 10. Alexander PG, Song Y, Taboas JM, Chen FH, Melvin GM, Manner PA, et al. Development of a spring-loaded impact device to deliver injurious mechanical impacts to the articular cartilage surface. Cartilage. 2012;4(1):52-62. doi: 10.1177/1947603512455195. [DOI] [PMC free article] [PubMed] [Google Scholar]
- 11. Changoor A, Coutu JP, Garon M, Quenneville E, Hurtig MB, Buschmann MD. Streaming potential-based arthroscopic device is sensitive to cartilage changes immediately post-impact in an equine cartilage injury model. J Biomech Eng. 2011;133(6):061005. doi: 10.1115/1.4004230. [DOI] [PubMed] [Google Scholar]
- 12. Bolam CJ, Hurtig MB, Cruz A, McEwen BJE. Characterization of experimentally induced post-traumatic osteoarthritis in the medial femorotibial joint of horses. Am J Vet Res. 2006;67(3):433-47. doi: 10.2460/ajvr.67.3.433. [DOI] [PubMed] [Google Scholar]
- 13. Morel V, Quinn TM. Cartilage injury by ramp compression near the gel diffusion rate. J Orthop Res. 2004;22(1):145-51. doi: 10.1016/S0736-0266(03)00164-5. [DOI] [PubMed] [Google Scholar]
- 14. Quinn TM, Grodzinsky AJ, Hunziker EB, Sandy JD. Effects of injurious compression on matrix turnover around individual cells in calf articular cartilage explants. J Orthop Res. 1998;16(4):490-9. doi: 10.1002/jor.1100160415. [DOI] [PubMed] [Google Scholar]
- 15. Sah RLY, Doong JYH, Grodzinsky AJ, Plaas AHK, Sandy JD. Effects of compression on the loss of newly synthesized proteoglycans and proteins from cartilage explants. Arch Biochem Biophys. 1991;286(1):20-9. doi: 10.1016/0003-9861(91)90004-3. [DOI] [PubMed] [Google Scholar]
- 16. Sih GC. Strain-energy-density factor applied to mixed mode crack problems. Int J Fract. 1974;10(3):305-21. doi: 10.1007/BF00035493. [DOI] [Google Scholar]
- 17. Bonnevie ED, Baro VJ, Wang L, Burris DL. Fluid load support during localized indentation of cartilage with a spherical probe. J Biomech. 2012;45(6):1036-41. doi: 10.1016/j.jbiomech.2011.12.019. [DOI] [PMC free article] [PubMed] [Google Scholar]
- 18. Hubbert MK, Willis DGW. Mechanics of hydraulic fracturing. Trans Am Inst Mining Metall Pet Eng Inc. 1957;210:153-68. [Google Scholar]
- 19. Finlay JB, Repo RU. Instrumentation and procedure for the controlled impact of articular cartilage. IEEE Trans Biomed Eng. 1978;25(1):34-9. doi: 10.1109/TBME.1978.326375. [DOI] [PubMed] [Google Scholar]
- 20. Borrelli J, Torzilli PA, Grigiene R, Helfet DL. Effect of impact load on articular cartilage: development of an intra-articular fracture model. J Orthop Trauma. 1997;11(5):319-26. [DOI] [PubMed] [Google Scholar]


