

Abstract
Objectives
The aim of this study was to examine the relationship between cartilage, ligament, and meniscus degeneration and radiographic alignment in severe varus knee osteoarthritis in order to understand the development of varus knee osteoarthritis.
Design
Fifty-three patients (71 knees) with primary varus knee osteoarthritis and who underwent total knee arthroplasty were selected for this study. There were 6 men and 47 women, with 40 right knees and 31 left knees studied; their mean age at operation was 73.5 years. The ligament, meniscus, degeneration of joint cartilage, and radiographic alignments were examined visually.
Results
The tibial plateau–tibial shaft angle was larger if the condition of the cartilage in the lateral femoral condyle was worse. The femorotibial angle and tibial plateau–tibial shaft angle were larger if the conditions of the lateral meniscus or the cartilage in the lateral tibial plateau were worse.
Conclusion
Based on the results of this study, progression of varus knee osteoarthritis may occur in the following manner: medial knee osteoarthritis starts in the central portion of the medial tibial plateau, and accompanied by medial meniscal extrusion and anterior cruciate ligament rupture, cartilage degeneration expands from the anterior to the posterior in the medial tibial plateau. Bone attrition occurs in the medial tibial plateau, and the femoro-tibial angle and tibial plateau–tibial shaft angle increase. Therefore, the lateral intercondylar eminence injures the cartilage of the lateral femoral condyle in the longitudinal fissure type. Thereafter, the cartilage degeneration expands in the whole of the knee joints.
Keywords: varus knee osteoarthritis, development, cartilage degeneration, radiographic alignment
Introduction
Osteoarthritis is a degenerative condition that increases in incidence and prevalence with age and is a major cause of morbidity in people older than 65 years.1 This condition most commonly occurs at the knee, particularly in the medial tibiofemoral compartment,2 and varus knee osteoarthritis accounts for more than 95% of knee osteoarthritis in Japan. Despite the occurrence of significant morbidity, the etiology and factors involved in the pathogenesis of osteoarthritis and the development of varus knee osteoarthritis have not been fully elucidated. There have been few reports that compared cartilage, ligament, and meniscus degeneration and radiographic alignment in patients with severe varus knee osteoarthritis.
The aim of this study was to examine the relationship between cartilage, ligament, and meniscus degeneration and radiographic alignment in patients with severe varus knee osteoarthritis in order to understand the development of varus knee osteoarthritis, observing in detail the degeneration of the knee compartments of the patients who had total knee arthroplasty for their severe varus knee osteoarthritis.
Materials and Methods
Over a 4-year period, 53 patients (71 knees) were selected for this study. The inclusion criteria for the study were primary osteoarthritis in a varus knee and total knee arthroplasty in our hospital. No previous history of anterior cruciate ligament (ACL) damage was found in these patients, and no previous operations had been done in their affected knee joints. There were 6 men and 47 women, with 40 right knees and 31 left knees studied. The mean age at operation was 73.5 years (range 60-86 years). Written, informed consent was obtained from all subjects. All the following data were gathered in these cases. The abbreviations we used in this study are shown in Table 1.
Table 1.
The Abbreviations We Used in This Study.
| Measurement | Abbreviation | Subset | Grade | Description |
|---|---|---|---|---|
| Arthroscopy | ||||
| Anterior cruciate ligament | ACL | Intact | Synovial sheath intact, no fiber disruption, solid insertions | |
| Posterior cruciate ligament | PCL | Ruptured | Synovial sheath not present, fibers attenuated | |
| Disappeared | Synovial sheath not present, fibers absent | |||
| Lateral meniscus | LM | Intact | Meniscus intact | |
| Medial meniscus | MM | Degenerated | Meniscus degenerated | |
| Ruptured | Meniscus ruptured | |||
| Disappeared | Meniscus disappeared | |||
| Medial femoral condyle | MFC | Anterior | Grade 0 | Normal |
| Lateral femoral condyle | LFC | Central | Grade 1 | Superficial lesions |
| Medial tibial plateau | MTP | Posterior | Grade 2 | Less than 50% of cartilage depth |
| Lateral tibial plateau | LTP | Grade 3 | More than 50% of cartilage depth | |
| Grade 4 | Exposure of subchondral bone | |||
| Clinical | ||||
| Varus | Type A | Subchondral bone exposed central | ||
| Valgus | Type B | Subchondral bone exposed anterior and central | ||
| Type C | Subchondral bone exposed central and posterior | |||
| Type D | Subchondral bone exposed from anterior to posterior | |||
| Radiographic measurements | ||||
| Femorotibial angle | FTA | See Figure 2 | ||
| Femoral condylar femoral shaft angle | FCFS | See Figure 2 | ||
| Femoral condylar tibial plateau angle | FCTP | See Figure 2 | ||
| Tibial plateau tibial shaft angle | TPTS | See Figure 2 |
During surgery, we assessed the ligaments, meniscus and cartilage by gross examination. The ACL and posterior cruciate ligament (PCL) were also inspected and divided into 3 groups: intact, ruptured, or disappeared (Table 2). The lateral meniscus (LM) and medial meniscus (MM) were also inspected and divided into 3 groups: intact, degenerated, and ruptured or disappeared.
Table 2.
Assessments of the Anterior Cruciate Ligament (ACL), Posterior Cruciate Ligament (PCL), and Lateral Meniscus (LM) in Severe Varus Knee Osteoarthritis.a
| ACL | PCL | LM | |
|---|---|---|---|
| Intact | 31 knees (44%) | 60 knees (85%) | 47 knees (66%) |
| Degenerated (LM) or ruptured (ACL, PCL) | 29 | 10 | 16 |
| Disappeared | 11 | 1 | 8 |
Intact: Visually as having an intact synovial sheath, no fiber disruption, and solid insertion points in the femur and tibia, and clinical assessment demonstrated a hard end point. Ruptured: The synovial sheath was not present, and fibers were visually attenuated or stretched, and when clinical assessment demonstrated a soft end point. Disappeared: The synovial sheath was not present and the fibers were visually absent.
Degeneration of joint cartilage in the lateral and medial femorotibial joints were also examined visually. Using the International Cartilage Repair Society (ICRS) classification,3 cartilage degeneration was divided into 5 grades: grade 0 was normal; grade 1 was superficial lesions that included soft indentation and/or superficial fissures and cracks; grade 2 was lesions extending down to less than 50% of cartilage depth; grade 3 was cartilage defects extending down more than 50% of cartilage depth, as well as down to calcified layer and down to but through the subchondral bone; and grade 4 was exposure of subchondral bone. The femorotibial joint was divided into 4 zones: lateral femoral condyle (LFC), lateral tibial plateau (LTP), medial femoral condyle (MFC), and medial tibial plateau (MTP). Cartilage degeneration was examined in each area. Cartilage degeneration of the LFC and LTP was divided into 4 types: type I was defined as all areas of the LFC or LTP were grade 0 of the ICRS classification; type II was defined as most of the degenerated cartilage area in the LFC or LTP was grade1; type III was defined as most of the degenerated cartilage area in the LFC or LTP was grade 2; and type IV was defined as most of the degenerated cartilage area in the LFC or LPT was grade 3 or 4. Moreover, the medial compartment of the tibial plateau was subdivided into 3 zones using the ICRS cartilage injury evaluation package: anterior, central, and posterior. Based on the wear pattern of the MTP, severe varus knee osteoarthritis was divided into 4 types. The detailed information is shown in Figure 1.
Figure 1.

(A) Type A is defined as subchondral bone that is exposed only in the central part of the medial tibial plateau (MTP). (B) Type B is defined as subchondral bone that is exposed in the anterior and central part of the MTP. (C) Type C is defined as subchondral bone that is exposed in the central and posterior part of the MTP. (D) Type D is defined as subchondral bone that is exposed from the anterior to the posterior part of the MTP.
The femorotibial angle (FTA) of the lower limb in the frontal plane was measured on standard preoperative weightbearing anteroposterior x-rays (Fig. 2). Four angles were then measured to assess the varus deformity of each knee in Figure 2.4
Figure 2.
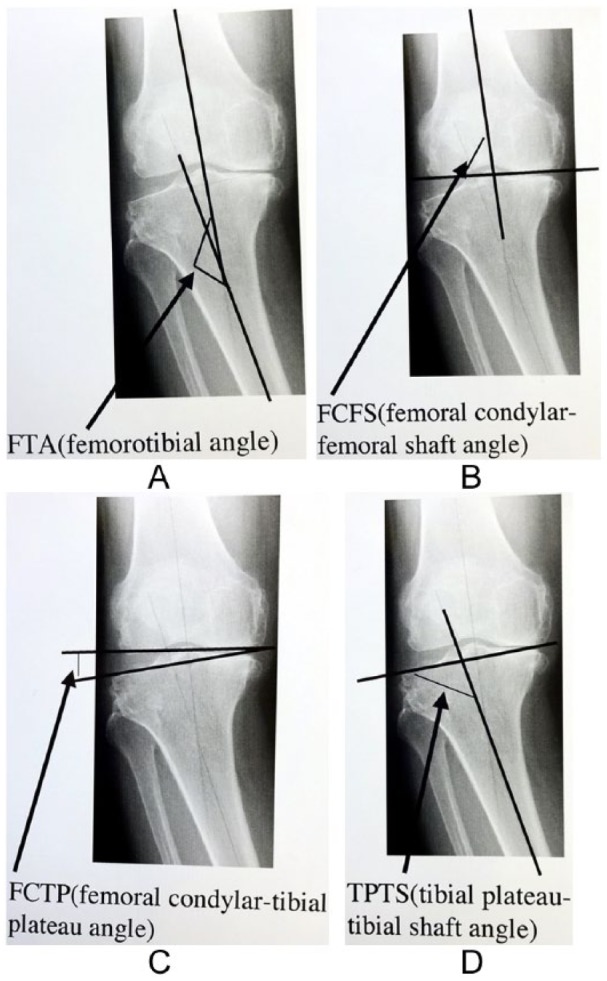
Four angles to assess the varus deformity of each knee4 on standard preoperative weightbearing anteroposterior x-rays. (A) Femorotibial angle (FTA) between the anatomical axis of the femur and that of the tibia. (B) Femoral condylar–femoral shaft angle (FCFS) between the anatomical axis of the femur and the tangent to the subchondral plate of the femoral condyles. (C) Femoral condylar–tibial plateau angle (FCTP) between the tangents to the subchondral plates of the femoral and tibial condyles. (D) Tibial plateau–tibial shaft angle (TPTS) between the tangent to the subchondral plate of the tibia and the anatomical axis of the tibia.
The assessments of the ACL, PCL, and LM were compared with the radiographic alignment, and cartilage degeneration of the lateral compartment (LFC and LTP) was compared with the radiographic alignment. The type of MTP was also compared with the assessments of the ACL, PCL and MM, as well as the radiographic alignment. All data are expressed as mean and standard deviation, and statistical software (SPSS version 22, IBM, Armonk, NY, USA) was used for data analysis. Statistical analyses were performed using the Mann-Whitney U test (2 groups), Tukey-Kramer test (more than 2 groups), and the χ2 test. If the P value was less than 0.05, the difference was considered significant.
Results
The assessments of the ACL, PCL, and LM in severe varus knee osteoarthritis are shown in Table 2. The APL normal group was defined as one in which the ACL, PCL, and LM were all intact in severe varus knee osteoarthritis, and the APL abnormal group was defined to include all other cases. With regard to each of the parameters of radiographic alignment, only the FTA of the APL normal group was significantly smaller than that of the APL abnormal group (Table 3). There were no significant differences in the other parameters of radiographic alignment. Therefore, the FTA of the patients who had normal ACL, PCL, and LM in varus knee osteoarthritis was significantly smaller than the others.
Table 3.
Comparison of the Femorotibial Angle Between the APL Normal and Abnormal Groups.a
| Mean (degrees) | Standard Deviation (degrees) | |
|---|---|---|
| APL normal group (24) | 185.4 | 5.1 |
| APL abnormal group (47) | 188.4 | 5.6 |
The APL normal group was defined as the group in which anterior cruciate ligament (ACL), posterior cruciate ligament (PCL), and lateral meniscus (LM) were all intact in severe varus knee osteoarthritis, and the APL abnormal group was defined to include all other cases. There is a significant difference (P = 0.0400, Mann-Whitney U test). The figures in the parentheses indicate the number of cases.
The comparison between the cartilage degeneration of the LFC and the radiographic alignment is shown in Table 4. The tibial plateau–tibial shaft (TPTS) angle was significantly smaller in type I than in type IV. There were no significant differences in the parameters of radiographic alignment. Therefore, if the bone attrition in the medial tibia increased, the cartilage degeneration in the lateral femoral condyle increased.
Table 4.
Radiographic Alignments in Lateral Femoral Condyle or Lateral Tibial Plateau Types.
| Mean (degrees) | Standard Deviation (degrees) | |
|---|---|---|
| A. TPTS in LFC typea | ||
| Type I: grade 0 (27) | 98.03 | 2.60 |
| Type II: grade 1 (23) | 98.20 | 2.25 |
| Type III: grade 2 (10) | 99.13 | 3.40 |
| Type IV: grade3 or 4 (11) | 101.37 | 6.17 |
| B. FTA in LTP typeb | ||
| Type I: grade 0 (6) | 183.3 | 4.8 |
| Type II: grade 1 (37) | 186.6 | 3.8 |
| Type III: grade 2 (20) | 188.8 | 4.8 |
| Type IV: grade 3 or 4 (8) | 190.9 | 11.0 |
| C. TPTS in LTP typec | ||
| Type I: grade 0 (6) | 96.48 | 1.68 |
| Type II: grade 1 (37) | 98.10 | 2.67 |
| Type III: grade 2 (20) | 99.40 | 2.76 |
| Type IV: grade 3 or 4 (8) | 101.90 | 6.75 |
Abbreviations: LFC, lateral femoral condyle; TPTS, tibial plateau–tibial shaft angle; FTA, femorotibial angle; LTP, lateral tibial plateau.
There is a significant difference between types I and IV (P = 0.0443, Tukey-Kramer test). The figures in parentheses indicate the number of cases.
There is a significant difference between types I and IV (P = 0.0331, Tukey-Kramer test). The figures in parentheses indicate the number of cases.
There are significant differences between types I and IV and between types II and IV (P = 0.0101, Tukey-Kramer test). The figures in the parentheses indicate the number of cases.
The comparison between the cartilage degeneration of the LTP and the radiographic alignment is shown in Table 4. The FTA was significantly smaller in type I than in type IV, and the TPTS was significantly larger in type IV than in types I and II. There were no significant differences in the other parameters of radiographic alignment in the cartilage degeneration of the LTP. Therefore, if the bone attrition in the medial tibia increased, the cartilage degeneration in the lateral tibial plateau increased.
The comparison between the assessment of the lateral meniscus and the radiographic alignment is shown in Table 5. The FTA was significantly smaller in type I than in type III, and the TPTS was significantly smaller in type I than in types II and III. There were no significant differences in the other parameters of radiographic alignment in the assessment of the LM. Therefore, if the bone attrition in the medial tibia increased, the degeneration of the lateral meniscus increased.
Table 5.
Comparison of Femorotibial Angle and Tibial Plateau–Tibial Shaft Angle in Lateral Meniscus Type.
| Mean (degrees) | Standard Deviation (degrees) | |
|---|---|---|
| A. FTAa | ||
| Type I: normal (47) | 186.3 | 4.44 |
| Type II: degenerated (16) | 188.1 | 4.23 |
| Type III: disappeared (8) | 192.5 | 10.32 |
| B. TPTSb | ||
| Type I: normal (47) | 97.75 | 2.67 |
| Type II: degenerated (16) | 100.04 | 3.17 |
| Type III: disappeared (8) | 102.09 | 5.72 |
Abbreviations: FTA, femorotibial angle; TPTS, tibial plateau–tibial shaft angle.
There is a significant difference between types I and III (P = 0.0118, Tukey-Kramer test). The figures in parentheses indicate the number of cases.
There are significant differences between types I and II, and between types I and III (P = 0.0009, Tukey-Kramer test). The figures in parentheses indicate the number of cases.
The details of the types of medial tibial plateau were shown in Table 6. There were no significant differences in the age at operation by medial tibial plateau type.
Table 6.
Details of the Types of Medial Tibial Plateau.
| Type | Knees, n (%) | Side, n |
Age (Years) at Operation; Mean (Range) | |
|---|---|---|---|---|
| Right | Left | |||
| A | 18 (25.4) | 9 | 9 | 74.5 (61-80) |
| B | 20 (28.2) | 14 | 6 | 72.8 (60-83) |
| C | 9 (12.7) | 7 | 2 | 69.9 (61-80) |
| D | 24 (3.8) | 10 | 14 | 75.0 (68-86) |
The ratio of intact ACL or PCL by the type of medial tibial plateau is shown in Figure 3. There was a significant positive correlation between intact ACL and type A medial tibial plateau (χ2 test; P = 0.0096). The ratio of surviving MM, including intact or degenerated, by the type of medial tibial plateau is shown in Figure 4. Independent of the type of medial tibial plateau, the middle and posterior segments of the MM disappeared more than the other portion of the MM. There were no significant differences in radiographic alignment by medial tibial plateau.
Figure 3.
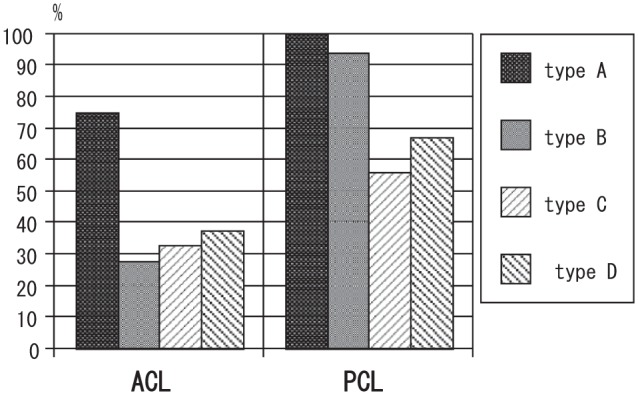
The ratio of the intact anterior cruciate ligament (ACL) or posterior cruciate ligament (PCL) by the type of medial tibial plateau (MTP) is shown. There is a significant positive correlation between intact ACL and type A MTP (P = 0.0096, χ2 test).
Figure 4.
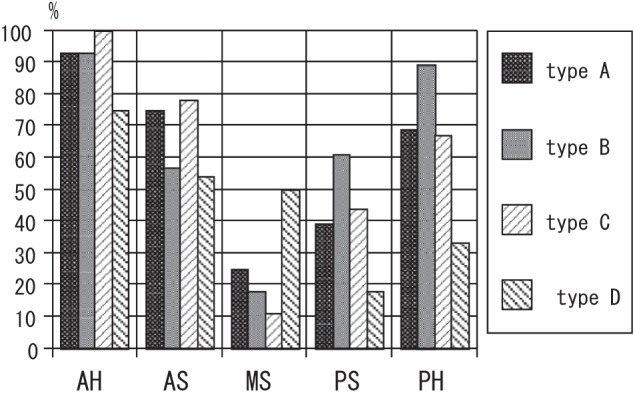
The ratio of survived medial meniscus, including intact or degenerated, by the type of medial tibial plateau (MTP) is shown. Independent of the type of MTP, the middle and posterior segments of the medial meniscus (MM) disappeared more than the other portion of the MM. AH, anterior horn; AS, anterior segment; MS, middle segment; PS, posterior segment; PH, posterior horn.
Discussion
In the present study, it appeared that, in the medial compartment, cartilage degeneration in the MTP first occurred in the central portion, and there was a significant positive correlation between intact ACL and type A MTP. Moschella et al.5 reported that the wear pattern in the MTP was limited mainly to the central portion in intact ACL knees and was observed to enlarge into the adjacent zone in ACL-deficient knees. Because the femur moves on the tibial plateau in a combination of rolling and sliding, and it has a wider contact area compared with the tibia; tibias presumably sustain constant mechanical stresses and, therefore, reflect the effect of mechanical stresses more than do femurs.6 Biomechanical descriptions of knee flexion and axial rotation during kneeling or squatting are consistent with the more pronounced anteromedial and posterolateral cartilage wear patterns observed in Saudi Arabian knees.7 The present results showed this in Japanese knees. There have been some reports of a correlation between subchondral bone and cartilage degeneration. It can be suggested that changes in histomorphometric parameters of subchondral bone are secondary to cartilage damage and proceed deeper into subchondral bone with increasing cartilage degeneration.8 Bone mineral density of the subchondral tibial bone is significantly correlated with future joint space narrowing and could be used as a predictor of knee osteoarthritis progression.9
The ratio of intact ACL in patients with varus osteoarthritis undergoing total knee arthroplasty was reported to be 35.7%5 or 58.6%10; it was 44% in the present study. The ratio of disappeared ACL was reported to be 25%7 or 7.1%10; it was 15.5% in the present study. ACL rupture is not the primary etiology of the cartilage degenerative changes of the knee in patients affected by late arthritis.7,11 It seems that ACL rupture might be caused by late degenerative changes due to femoral intercondylar notch abrasion12 and by the increased joint shear force due to the absence of the physiological cartilage layer.13 Forty-six percent of PCLs from patients in the osteoarthritis group had moderate or marked degenerative change on light microscopy,14 but macroscopically, it was 15% in the present study.
The enlargement and displacement of the wear pattern in the MTP seems to be worsened by damage or absence of the MM.15,16 Moschella et al.5 found that severe cartilage wear in the central portion of the MTP was a median of 20% when the MM was intact, suggesting the occurrence of a protective function of the meniscus, even when the ACL was deficient. In the present study, the ratio of the middle segment of the MM was also the smallest in type A MTP. There was a strong correlation between the degree of MM subluxation and the severity of medial joint space narrowing.17-20 In the present study, independent of the type of MTP, the middle and posterior segments of the MM disappeared more than the other portion of the MM. This suggested that medial meniscal extrusion had already occurred.
Hunter et al.21 reported that cartilage loss was thought to be the major determinant of alignment, and that other factors, including meniscal degeneration and position, bone attrition, osteophytes, and ligament damage, contribute to the variance in malalignment. The knee bone mineral density distribution in the proximal tibia of the 113 patients was negatively correlated with the axial deformity.22 Increasing varus knee alignment was associated with increasing risk of medial compartment joint space narrowing and osteophytes.23 In the present study, if varus knee osteoarthritis progressed, the FTA, especially the TPTS, increased significantly. We thought that one of the main causes of progression of varus knee osteoarthritis was bone attrition in the MTP. Yamada et al.6 reported that the sclerotic changes associated with late-stage osteoarthritis were a late manifestation of the disease. Sclerotic changes probably reflected a response of the subchondral bone to the increased load bearing and friction that occurred after loss of the articular cartilage.6
Varus thrust was a potent risk factor, identifiable by simple gait observation, for osteoarthritis progression in the medial tibiofemoral compartment.24 Ackroyd25 reported that the degenerative process usually started in the anterior half of the tibial plateau and in the corresponding part of the medial femoral condyle when the knee was in 20° to 30° of flexion. Buck et al.26 reported that osteoarthritis might not be a one-way road of cartilage loss. Subregional analysis suggested that, compared with healthy knees, cartilage changes in radiographic osteoarthritis might occur in both directions.26 Based on the results of the present study, the progression of varus knee osteoarthritis may occur in the following manner: Medial knee osteoarthritis starts in the central portion of the MTP, and, accompanied by medial meniscal extrusion and ACL rupture, cartilage degeneration expands from the anterior to the posterior in the MTP. Bone attrition occurs in the MTP, and the FTA and TPTS increase. Therefore, the lateral intercondylar eminence results in an injury of the cartilage of the longitudinal fissure type in the lateral femoral condyle, as shown in Figure 5. The cartilage degeneration then expands to involve the whole knee joints.
Figure 5.
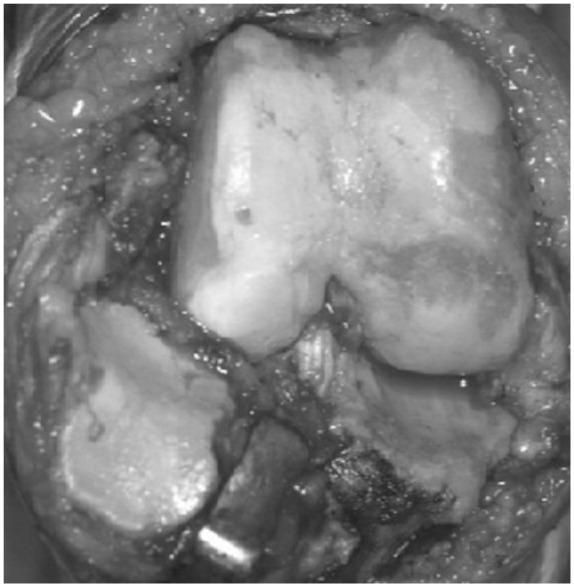
Only the longitudinal fissure is shown in the lateral femoral condylar cartilage. In the comparison of tibial plateau–tibial shaft angle (TPTS) by lateral femoral condyle (LFC) type, type I TPTS is significantly smaller than type IV. In medial knee osteoarthritis, it appears that the lateral intercondylar eminence first injure the longitudinal fissure in the lateral femoral condylar cartilage.
Footnotes
Acknowledgments and Funding: The author(s) received no financial support for the research, authorship, and/or publication of this article.
Declaration of Conflicting Interests: The author(s) declared no potential conflicts of interest with respect to the research, authorship, and/or publication of this article.
Ethical Approval: This study was approved by our institutional review board.
References
- 1. Felson DT, Naimark A, Anderson J, Kazis L, Castelli W, Meenan RF. The prevalence of knee osteoarthritis in the elderly: the Framingham Osteoarthritis Study. Arthritis Rheum. 1987;30:914-8. [DOI] [PubMed] [Google Scholar]
- 2. Ledingham J, Regan M, Jones A, Doherty M. Radiographic patterns of osteoarthritis of the knee in patients referred to hospital. Ann Rheum Dis. 1993;52:520-6. [DOI] [PMC free article] [PubMed] [Google Scholar]
- 3. Brittberg M, Peterson L. Introduction to an articular cartilage classification. ICRS Newslett. 1998;1:8. [Google Scholar]
- 4. Terauchi M, Shirakura K, Katayama M, Higuchi H, Takagishi K. The influence of osteoporosis on varus osteoarthritis of the knee. J Bone Joint Surg Br. 1998;80:432-6. [DOI] [PubMed] [Google Scholar]
- 5. Moschella D, Blasi A, Leardini A, Ensini A, Catani F. Wear patterns on tibial plateau from varus osteoarthritic knees. Clin Biomech. 2006;21:152-6. [DOI] [PubMed] [Google Scholar]
- 6. Yamada K, Healey R, Amiel D, Lotz M, Coutts R. Subchondral bone of the human knee joint in aging and osteoarthritis. Osteoarthritis Cartilage. 2002;10:360-9. [DOI] [PubMed] [Google Scholar]
- 7. Hodge WA, Harman MK, Banks SA. Patterns of knee osteoarthritis in Arabian and American knees. J Arthroplasty. 2009;24:448-53. [DOI] [PubMed] [Google Scholar]
- 8. Bobinac D, Spanjol J, Zoricic S, Maric I. Changes in articular cartilage and subchondral bone histomorphometry in osteoarthritic knee joints in humans. Bone. 2003;32:284-90. [DOI] [PubMed] [Google Scholar]
- 9. Bruyere O, Dardenne C, Lejeune E, Zegels B, Pahaut A, Richy F, et al. Subchondral tibial bone mineral density predicts future joint space narrowing at the medial femoro-tibial compartment in patients with knee osteoarthritis. Bone. 2003;32:541-5. [DOI] [PubMed] [Google Scholar]
- 10. Chan WP, Huang GS, Hsu SM, Chang YC, Ho WP. Radiographic joint space narrowing in osteoarthritis of the knee: relationship to meniscal tears and duration of pain. Skeletal Radiol. 2008;37:917-22. [DOI] [PMC free article] [PubMed] [Google Scholar]
- 11. Weidow J, Pak J, Karrholm J. Different patterns of cartilage wear in medial and lateral gonarthrosis. Acta Orthop Scand. 2002;73:326-9. [DOI] [PubMed] [Google Scholar]
- 12. Lee GC, Cushner FD, Vigoritta V, Scuderi GR, Insall JN, Scott WN. Evaluation of the anterior cruciate ligament integrity and degenerative arthritic patterns in patients undergoing total knee arthroplasty. J Arthroplasty. 2005;20:59-65. [DOI] [PubMed] [Google Scholar]
- 13. Huss RA, Holstein H, O’Connor JJ. The effect of cartilage deformation on the laxity of the knee joint. Proc Inst Mech Eng. 1999;213:19-32. [DOI] [PubMed] [Google Scholar]
- 14. Akisue T, Stulberg BN, Bauer TW, McMahon JT, Wilde AH, Kurosaka M. Histologic evaluation of posterior cruciate ligaments from osteoarthritic knees. Clin Orthop. 2002;400:165-73. [DOI] [PubMed] [Google Scholar]
- 15. Biswal S, Hastie T, Andriacchi TP, Bergman GA, Dillingham MF, Lang P. Risk factors for progressive cartilage loss in the knee: a longitudinal magnetic resonance imaging study in forty-three patients. Arthritis Rheum. 2002;46:2884-92. [DOI] [PubMed] [Google Scholar]
- 16. Eisenhart-Rothe R, Bringmann C, Siebert M, Reiser M, Englmeier KH, Eckstein F, et al. Femoro-tibial and menisco-tibial translation pattern in patients with unilateral anterior cruciate ligament deficiency-a potential cause of secondary meniscal tears. J Orthop Res. 2004;22:275-82. [DOI] [PubMed] [Google Scholar]
- 17. Gale DR, Chaisson CE, Totterman SMS, Schwartz RK, Gale ME, Felson D. Meniscal subluxation: association with osteoarthritis and joint space narrowing. Osteoarthritis Cartilage. 1999;7:526-32. [DOI] [PubMed] [Google Scholar]
- 18. Lerer DB, Umans HR, Hu MX, Jones MH. The role of meniscal root pathology and radial meniscal tear in medial meniscal extrusion. Skeletal Radiol. 2004;33:569-74. [DOI] [PubMed] [Google Scholar]
- 19. Lee DH, Lee BS, Kim JM, Yang KS, Cha EJ, Park JH, et al. Predictors of degenerative medial meniscus extrusion: radial component and knee osteoarthritis. Knee Surg Sports Traumatol Arthrosc. 2011;19:222-9. [DOI] [PubMed] [Google Scholar]
- 20. Kawaguchi K, Enokida M, Otsuki R, Teshima R. Ultrasonographic evaluation of medial radial displacement of the medial meniscus in knee osteoarthritis. Arthiritis Rheum. 2012;64:173-80. [DOI] [PubMed] [Google Scholar]
- 21. Hunter DJ, Zhang Y, Niu J, Tu X, Amin S, Goggins J, et al. Structural factors associated with malalignment in knee osteoarthritis: the Boston Osteoarthritis Knee Study. J Rheumatol. 2005;32:2192-9. [PubMed] [Google Scholar]
- 22. Hulet C, Sabatier JP, Souquet D, Locker B, Marcelli C, Vielpeau C. Distribution of bone mineral density at proximal tibia in knee osteoarthritis. Calcif Tissue Int. 2002;71:315-22. [DOI] [PubMed] [Google Scholar]
- 23. Teichtahl AJ, Cicuttini FM, Janakiramanan N, Davis SR, Wluka AE. Static knee alignment and its association with radiographic knee osteoarthritis. Osteoarthritis Cartilage. 2006;14:958-62. [DOI] [PubMed] [Google Scholar]
- 24. Chang A, Hayes K, Dunlop D, Hurwitz D, Song J, Cahue S, et al. Thrust during ambulation and the progression of knee osteoarthritis. Arthritis Rheum. 2004;50:3897-903. [DOI] [PubMed] [Google Scholar]
- 25. Ackroyd CE. Medial compartment arthroplasty of the knee. J Bone Joint Surg Br. 2003;85:937-42. [DOI] [PubMed] [Google Scholar]
- 26. Buck RJ, Wyman BT, Le Graverand MP, Hudelmaier M, Wirth W, Eckstein F. Osteoarthritis may not be a one-way-road of cartilage loss—comparison of spatial patterns of cartilage change between osteoarthritic and healthy knees. Osteoarthritis Cartilage. 2010;18:329-35. [DOI] [PubMed] [Google Scholar]