

Abstract
Background
Objective measures of disease progression that can be used as end-points in clinical trials of multiple system atrophy are necessary. We studied retinal thickness in patients with multiple system atrophy, and assessed changes over time to determine its usefulness as imaging biomarker of disease progression.
Methods
Cross sectional study including 24 patients with multiple system atrophy, 20 patients with Parkinson disease (PD) and 35 controls; followed by a longitudinal study of 13 multiple system atrophy (MSA) patients. Patients were evaluated with high definition-optical coherence tomography and the Unified Multiple System Atrophy Rating Scale. Evaluations were performed at baseline and at consecutive follow-up visits for up to 26 months.
Results
MSA subjects had normal visual acuity and color discrimination. Compared to controls, retinal nerve fiber layer (p=0.008 and p=0.001) and ganglion cell complex (p=0.013 and p=0.001) thicknesses were reduced in multiple system atrophy and in PD. No significant differences between MSA and PD were found. Over time, in patients with MSA, there was a significant reduction of the retinal nerve fiber layer and ganglion cell complex thicknesses, with estimated annual average losses of 3.7 μm and 1.8 μm respectively.
Conclusions
Visually asymptomatic MSA patients exhibit progressive reductions in the thickness of the retinal nerve fiber layer and, to a lesser extent, in the macular ganglion cell complex, which can be quantified by high-definition optical coherence tomography. Specific patterns of retinal nerve fiber damage could be a useful imaging biomarker of disease progression in future clinical trials.
Keywords: Multiple system atrophy, Parkinson disease, Optical Coherence Tomography, Retinal Nerve Fiber Layer, Ganglion Cell Complex, Unified Multiple System Atrophy Rating Scale
INTRODUCTION
Synucleinopathies are neurodegenerative disorders characterized by abnormal intracellular deposits of misfolded α-synuclein1. The recent discovery of abnormal α-synuclein deposits in discrete neurons within the inner retina in post mortem samples of patients with Parkinson disease (PD)2, 3 suggest that involvement of the retina may occur in other α-synucleinopathies.
Indeed, in patients with multiple system atrophy (MSA), a rare fatal adult onset synucleinopathy4, preliminary imaging studies have identified a significant reduction in the retinal nerve fiber layer (RNFL) thickness.5–9 This finding appeared unexpectedly because patients with MSA have no clinical visual complaints. This is in contrast to patients with PD, who although mostly asymptomatic may occasionally develop visual problems during the course of the disease 10. It is unknown, however, whether the retinal changes in patients with MSA are similar to those observed in patients with PD or whether these retinal abnormalities worsen over time.
While a variety of imaging techniques are available (e.g., brain positron emission tomography, or brain MRI), none of them has been demonstrated to be a reliable method to accurately measure the progression of synucleinopathies. The structure of the retina, which is part of the central nervous system11, can be studied in vivo using spectral domain high definition optical coherence tomography (HD-OCT), a non-invasive imaging technique with a resolution of ~1 μm (0.001 mm).
The objective of our study was to examine the structure of the retina in patients with MSA and document changes over time.
METHODS
Study design
Patients with MSA and PD were recruited consecutively from those referred to the New York University Dysautonomia Center over a 2.5-year period (from June 2012 to December 2014). Controls were recruited from relatives that volunteered to participate in this study.
This study had two parts. First, a cross sectional evaluation featuring 24 patients with MSA (48 eyes), 35 age and gender matched healthy subjects (70 eyes) and 20 patients with idiopathic PD (40 eyes) for comparison. The second part of the study was designed as a prospective longitudinal evaluation to assess retinal changes over time in 13 patients with MSA. These 13 MSA patients were part of the initial cross-sectional cohort and had between 1 and 7 follow-up evaluations, with an interval of 2 to 26 months from the initial evaluation (Figure 2).
Figure 2. Retinal thickness over time in multiple system atrophy.

(A) Global retinal nerve fiber layer (RNFL) thickness at baseline and at consecutive follow-up evaluations over a maximum 26-month follow-up period. In all MSA patients with at least 1 follow-up visit, global RNFL thickness decreased over time. (B) Global ganglion cell complex (GCC) thickness at baseline and at consecutive follow-up evaluations. In all MSA patients with at least 1 follow-up visit, global GCC thickness tended to decrease over time, although to a lesser extent than global RNFL.
Inclusion and exclusion criteria
MSA patients were diagnosed according to the current Consensus criteria.12 Only patients with a diagnosis of probable MSA were enrolled in the study. All PD patients fulfilled the UK PD Brain Bank criteria13. Controls were all healthy, with no history of neurological or ophthalmological disease. Eyes with a history of trauma, surgery, retinopathy, glaucoma or patients with severe transparent media opacification that prevented ophthalmological examination were excluded. The Institutional Review Board of the New York University School of Medicine approved all procedures and informed consent was obtained from all subjects.
Neurological evaluation
Subjects underwent a detailed clinical interview and complete neurological examination. Disease severity in MSA patients was rated by the same trained neurologist (JAP) using the Unified Multiple System Atrophy Rating Scale (UMSARS) scores.14 UMSARS part I disease-related impairment score (12-items) and part II motor examination score (14-Items) were determined for each patient at baseline. To determine disease progression, patients with MSA that agreed to participate were enrolled in the prospective arm of the study and UMSARS scores were obtained at follow-up visits.
Ophthalmological evaluation
All subjects underwent standardized visual evaluations by a neuro-ophthalmologist (CEMS) for each eye separately, including assessment of the best-corrected visual acuity (ETDRS chart, MC3, TOPCON, Japan), and color discrimination (Ishihara 16 plates, Tokyo, Japan). Both visual acuity and color vision were measured in decimal units, with 1.0 representing normal function. Color vision was measured by the ratio between non-seen and seen numbers in the first 16 plates of the Ishihara test. The Ishihara test measures red-green color discrimination. This test consists of 38 colored plates, each of which contains a circle of dots appearing randomized in color and size. Within the pattern are dots, which form a number or shape clearly visible to those with normal color vision, and invisible, or difficult to see, to those with a red-green color vision defect. This test is particularly useful to detect optic neuropathies affecting macular ganglion cells, mostly P-ganglion cells and the P pathways of the retino-cortical projections, in which red-green color discrimination is affected 15.
HD-OCT was performed in a darkened room by the same trained neuro-ophthalmologist (CEMS) using standardized Food and Drug Administration (FDA)-approved equipment to evaluate the structure of the eye (Cirrus 4000, Carl Zeiss, CA, USA). Images were acquired in the seated position with the subjects facing the HD-OCT equipment. Subjects were instructed to fixate their gaze at a green target during the scan. Each subject had both eyes scanned at least three times using two standard acquisition protocols: macular cube (512×128 line scans) and optic disc cube (200×200 line scans). In both protocols the scanned area was a 6-mm cube with no signal averaging. The quality of the obtained images was assessed by evaluation of the signal strength (a value from 0–10 in arbitrary units) automatically provided by the system. Only scans with signal strength above 6 units were included in the analysis. In some patients with MSA, involuntary eye movements made the test difficult to obtain. In such cases, repeated scans were performed to obtain at least three scans without eye movement artifacts. The scan with the best resolution was used for analysis.
For HD-OCT quantification, two automatic segmentation algorithms were used to determine the RNFL and ganglion cell complex (GCC) thicknesses (Cirrus 4000, Carl Zeiss, CA, USA). For the RNFL analysis, an optic disc cube of data (200×200-line scans) centered in the optic nerve head was acquired. Subsequently, a recognition algorithm detected the inner (vitreoretinal interface) and outer (inner plexiform layer) border of the RNFL, from a 1.73-mm diameter circle extracted from the optic nerve cube and centered in the optic nerve head. The distance between the two lines was measured as RNFL thickness at specific quadrants around the optic nerve: temporal, superior, nasal, inferior and global. For the GCC analysis the macular cube 512×128 centered in the foveal pit was used. A different recognition algorithm was applied to detect the outer border of the RNFL and the inner plexiform layer. The GCC analysis evaluates the thickness of the ganglion cell plus inner plexiform layers. The average, minimum and sectorial thicknesses of the GCC are measured in an elliptical annulus (vertical inner and outer radius of 0.5 mm and 2.0 mm respectively; horizontal inner and outer radius of 0.6 and 2.4 mm, respectively) around the fovea. The GCC thickness was measured in different locations in the macula, around the foveal center: temporal-superior, superior, nasal-superior, nasal inferior, inferior, temporal-inferior, and global. The global RNFL and GCC thickness values, as well as those at each specific quadrant, expressed in micrometers (μm), were used for analysis.
Statistical analysis
Analyses were performed using SPSS version 16.0 and GraphPad Prism 6.0. Data was first tested for normality and parametric and non-parametric statistics were used as appropriate. All analyses used the average of both (right and left) eyes.
For the cross-sectional study, group differences were assessed by analysis of co-variance (ANOVA) with age as a covariate16. Age was included in the models to account for different age between groups and because this variable may be associated with retinal thickness; minimal RNFL thinning (0.33 μm/year) has been reported among normal subjects. 17 Significant differences in ANCOVA were followed by Bonferroni’s post-hoc comparisons.
For the longitudinal study, changes in RNFL and GCC thickness from baseline were determined for eyes of patients who had at least one follow-up visit at the time of analysis. For patients with multiple follow-up visits, the change from baseline for the last follow-up visit was used for analyses. Reductions in global retinal thickness at each visit (in μm) were calculated by subtracting the follow-up measurement minus the baseline measurement. Reductions of retinal thickness at each visit (expressed as % change) were calculated according to the following formula: [retinal thickness at follow-up x 100, divided by baseline measurement] − 100. The monthly rate of global retinal thickness reduction was calculated by dividing the average reduction in thickness (in μm or %) at the last follow-up visit by the number of months between the baseline and the last follow-up visit. The annual rate of reduction was estimated by multiplying the monthly rate of reduction by 12. The Kruskal-Wallis test was used to calculate differences in RNFL and GCC changes from baseline according to the follow-up interval (2–6 months, vs. 7–12 months vs. >12 months). Linear regression models, accounting for age and adjusting for within-patient, were used to assess the association of RNFL and GCC thinning with disease duration and disease severity (UMSARS-I and UMSARS-II).
A p-value <0.05 was considered statistically significant. All data are expressed as mean±standard deviation (SD) unless otherwise stated.
RESULTS
Subject Characteristics at Baseline
At the time of their first visit, MSA patients (19 women, 5 men) were 62.3±9.2 years old. Controls were matched for age (63.3±2.9 years) and gender distribution (21 women, 14 men). PD patients (6 women, 14 men) were older (72.7±8.4 years, p<0.01 vs. MSA group).
Mean disease duration from time of diagnosis in the MSA patients was 3.79±1.91 years (range: 1–7 years) and 3.30±1.30 (range 0.5–7) in PD (p=0.10). Among patients with MSA, 16 presented with the cerebellar (MSA-C) and 8 with the parkinsonian phenotype (MSA-P). Mean initial UMSARS-I and UMSARS-II scores were 21.9±8.4 and 22.8±8.8 respectively.
Ophthalmological Examination
Best-corrected visual acuity was similar in MSA (0.94±0.08) controls (0.96±0.04), and PD (0.71±1.34) (p=0.47). Color vision was also similar in MSA (0.95±0.07), controls (0.97±0.02) and PD (PD: 0.82±0.92) (p=0.38). In MSA patients, cataracts were present in seven eyes and were graded according the international Lens Opacities Classification System (LOCS III)18: Five eyes presented mild (NC2C3) and 2 eyes moderate (NC3C4) cataracts. In none of the eyes were cataracts too dense to preclude fundus examination or to affect the HD-OCT signal strength.
Cross-Sectional Study
Overall, the global RNFL and GCC thicknesses were significantly reduced in MSA compared to controls (p=0.008 and p=0.013 respectively, statistical test) (Figure 1). RNFL thickness in the inferior quadrant (p=0.005) was significantly reduced in MSA patients compared to controls. Thickness in the nasal and superior RNFL quadrants in MSA tended to be reduced when compared to controls. Thickness in the temporal RNFL quadrant in MSA was not different from controls. The global RNFL and GCC thicknesses were also significantly reduced in PD when compared to controls (p=0.001) (Figure 1). Of the specific RNFL quadrants, only the temporal was significantly lower in PD when compared to controls (p=0.020).
Figure 1. Retinal nerve fiber and ganglion cell layer thicknesses in patients with multiple system atrophy, Parkinson disease, and controls.

MSA and PD exhibited a significant reduction in the global RNFL and global GCC thickness when compared to controls. Global GCC tended to be more reduced in PD than in MSA (not significant). When studying specific RNFL quadrants (dotted square), patients with MSA and PD exhibited significant reductions in the inferior RNFL quadrant. Nasal and superior RNFL quadrants tended to be more reduced in PD and MSA than in controls (not significant). Only patients with PD exhibited significant reductions in the temporal RNFL quadrant (ANCOVA with Bonferroni’s post hoc analysis).
Both MSA and PD exhibited significant thinning when compared to controls in all the GCC quadrants except for the nasal-superior GCC quadrant, which was not reduced in MSA (Supplementary Table 1). No significant differences in the GCC were found throughout between MSA and PD. However, the GCC (both globally and in specific quadrants) and the temporal RNFL tended to be thinner in PD than in MSA (Supplementary Table 1).
Longitudinal Study
In all MSA patients who had at least 1 follow-up visit (n=13), global RNFL thickness decreased over time (Figure 2A). The global GCC thickness also tended to decrease over time in MSA patients with at least 1 follow-up visit, although to a lesser extent than the RNFL (Figure 2B).
Bar graphs in Figures 3 show mean changes from baseline in RNFL and GCC thicknesses by length of follow-up for MSA eyes. The bars represent mean changes in RNFL (Figure 3A) and GCC (Figure 3B) thickness from baseline for each follow-up interval, and the vertical lines are the SD of the means. Accounting for age, longer length of follow-up was associated with greater degrees of RNFL thinning from baseline (p=0.003 from comparison of >12 months, statistical test) (Figure 3A). GCC thinning was not significantly associated with longer length of follow-up (Figure 3B).
Figure 3. Bar graphs showing mean changes from baseline in retinal nerve fiber layer (RNFL) thickness and ganglion cell complex (GCC) thickness by length of follow-up in MSA eyes.
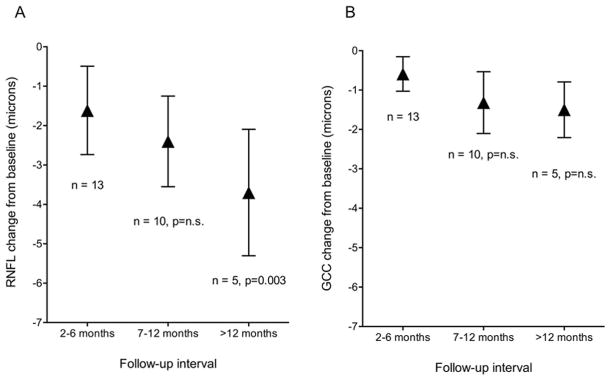
The bars represents mean changes in RNFL thickness (Figure 3A) and GCC thickness (Figure 3B) from baseline for each follow-up interval, and the vertical lines are the standard deviation. (A) The degree of RNFL thinning increased with increasing follow-up from baseline, reaching statistical significance from baseline values during the >12 month period (p=0.003, Kruskal-Wallis test). (B) The degree of GCC thinning tended to increase with increasing follow-up from baseline, although no significant differences were observed.
According to these results, the estimated average monthly rate of RNFL thickness reduction was −0.31 μm (95 % confidence interval [CI] −0.44, −0.17), i.e., a −0.36 % (95 %CI −0.50, −0.20) loss from the baseline thickness, which resulted in an estimated annual rate reduction of 3.72 μm (4.32 %, assuming a linear pattern of thinning across years). The estimated average rates of monthly reduction in the superior, nasal, inferior and temporal RNFL quadrants are specified in Supplementary Table 2.
The estimated average monthly rate of GCC thickness reduction loss from the baseline thickness was −0.15 μm (95%CI −0.19, −0.11), i.e., −0.21 % (95 %CI −0.26, −0.14), which resulted in an estimated annual rate reduction of 1.8 μm (2.52 %).
Relationship between OCT results and MSA duration and severity
When follow-up time was examined as a continuous variable, rather than as discrete time intervals, longer length of follow-up correlated with greater degrees of RNFL thinning (p=0.0075) and macular GCC thinning (p=0.035, linear regression model). The scatter plots and regression lines represent group data for degree of RNFL and GCC thinning observed between baseline and the follow-up visit, and are not meant to define patterns of retinal thinning over time for individual eyes (Figure 4A and 4B). The degree of RNFL thinning tended to correlate with disease severity (as measured by UMSARS-I, p=0.073; and UMSARS-II, p=0.137) (Figures 4C and 4E). This trend was not observed with the degree of GCC thinning (Figures 4D and 4F).
Figure 4. Scatter plots and fitted linear regression lines showing the relation between retinal thinning, follow-up time, and disease severity.

The regression lines represents fitted values for mean RNFL thinning or mean GCC thinning from baseline at each follow-up point; the areas between the dashed lines show the 95% confidence interval on the mean values. Accounting for age, the association between RNFL thinning from baseline and follow-up time (A) was significant (p=0.0075); the association between GCC thinning and follow-up time (B) was also significant (p=0.035). The association between RNFL thinning and disease severity tended to be significant (C, p=0.073 and E, p=0.137). There was no association between GCC thinning and disease severity (D and F).
Preliminary Sample Size for RNFL Thickness Outcomes in MSA trials
Based on the significant reductions in RNFL thickness that we found, we calculated preliminary estimates of sample size that may be required to detect an arrest in RNFL thinning. While these calculations are not based on clinical trial data and are derived from this preliminary cohort of patients, they allow us to begin to determine whether sample sizes from past clinical trials in MSA have the potential to demonstrate treatment effects when measuring the RNFL. Assuming 90% power and type 1 error alpha = 0.0519, the number of MSA patients needed to detect an arrest in RNFL thinning (i.e., an annual reduction of only 0.33 μm/year, which is what is described as normal in healthy subjects17) are 46 (23 receiving active agent and 23 receiving placebo). To detect a slowdown in RNFL thinning (i.e., an annual reduction of only 1.45 μm/year, i.e., a 50% improvement) are 114 (57 receiving active agent and 57 receiving placebo). As in previous studies performed to estimate sample sizes for brain MRI outcomes20, clinical trial data will be crucial to determine more accurate estimates.
DISCUSSION
Our results confirm that the macular ganglion cells (GCC) and their axons, i.e., the RNFL are affected in patients with MSA. 5–8 Our cross-sectional study showed that patients with MSA had a significant reduction in the global as well as in the inferior RNFL quadrant of the peripapillary retina. This is in line with previous reports.5–8 We found a significant reduction in the GCC thickness of the macular region of MSA patients compared with controls. This reduction appeared to be more pronounced in the patients with PD than in those with MSA; the difference between PD and MSA did not reach statistical significance perhaps due to the small sample size.
Our longitudinal study showed progressive RNFL thinning in patients with MSA, even in visually asymptomatic patients. Progressive macular GCC thinning also occurred, but to a lesser extent, in conjunction with preservation of their axons i.e. the temporal RNFL. Extramacular GCC thickness was not measured due to current OCT technical limitations but because we found significant thinning in the inferior RNFL of MSA patients, it is reasonable to assume that extramacular GCC is also significantly reduced in this population.
The reduction in RNFL thickness was associated with length of follow-up and tended to be associated with disease severity as assessed by UMSARS scores. These findings suggest that there is subclinical axonal loss in the visual pathway in MSA patients that can be attributed to a progressive neurodegenerative process involving neuroretinal structures, and support HD-OCT as candidate measure for clinical trials investigating neuroprotection.
Our study is important in: (1) confirming significant thinning in RNFL and macular GCC in MSA, and (2) demonstrating progressive declines in RNFL thickness, and to a lesser extent in macular GCC thickness, in the eyes of MSA patients. The estimated annual rate of RNFL thinning in MSA (3.7 μm/year) is certainly higher than the minimal thinning reported in healthy subjects (0.33 μm/year)17 and also higher than the RNFL thinning reported in multiple sclerosis (2.0 μm/year)21, a neurodegenerative demyelinating condition in which the RNFL thickness is severely reduced.
MSA is caused by deposition of misfolded α-synuclein primarily in oligodendroglia, in contrast to PD in which α-synuclein accumulates predominantly in neurons.22 α-synuclein is expressed in the normal retina of vertebrates, including humans,23 and has been recently found in abnormal deposits in the retina of patients with PD.2, 3 However, there have not been histological studies assessing the presence of abnormal α-synuclein deposits in the retina of MSA patients.
Despite their normal visual acuity and color discrimination, our MSA patients had a severely reduced global RNFL thickness and macular GCC thickness. In PD patients, the findings were similar except for: (1) the macular GCC thickness tended to be more severely reduced than in MSA; and (2) the temporal RNFL thickness was significantly reduced when compared to controls (which was not the case in MSA).
In the superior, nasal and inferior regions around the optic nerve (where the RNFL is measured), M-ganglion cells predominate. These M-cells relay information about achromatic vision, peripheral visual field sensitivity, motion detection, and contrast sensitivity for low spatial frequencies.24 In contrast, P-ganglion cells predominate in the macular region (where the macular GCC is measured) and their axons project to the temporal portion of the optic nerve. These macular cells are highly specialized in color discrimination, visual acuity, central visual field sensitivity and contrast sensitivity for high spatial frequencies.24–26 Our results showing decreased global and inferior RNFL thicknesses in MSA suggest that M-ganglion cells are probably the most affected population. The temporal RNFL area (whose thickness in our MSA patients was similar to controls, as in previous reports7, 8) receives axons from macular P-ganglion cells (located in the macular GCC region) indicating that this neuronal population could be less affected in MSA. This may explain why patients with MSA do not complain of visual symptoms and have normal visual acuity and color vision, in contrast to PD patients, who may complain of visual problems, including decreased visual acuity, impaired color discrimination, defective motion perception, and visual hallucinations10. The fact that the temporal RNFL thickness was significantly reduced in PD when compared to controls indicates that the GCC is severely affected in PD. These findings are consistent with previously reported studies showing reduced RNFL 27–33 and reduced macular thickness6, 28, 32–37 in the retina of patients with PD (excellent reviews are available38).
Why the retinal findings exhibit these differences between PD and MSA is unclear, although might be potentially related to different patterns of myelination by oligodendrocytes of M-cells axons (which would be severely affected in MSA and in PD) compared to myelination of P-cells axons (which would be less affected in MSA but severely affected in PD) (Figure 5). Also, P-ganglion cells are typically affected in mitochondrial optic neuropathies, in which metabolic stress causes this small and active cell group to be selectively damaged39. This may potentially represent different underlying pathophysiological mechanisms involving PD in contrast to MSA. Investigation of the histopathological changes in the retinas of MSA patients will be essential to confirm this.
Figure 5. The retina in multiple system atrophy.

This figure summarizes our main findings in patients with MSA. In the retinal nerve fiber layer (RNFL) around the optic nerve, M-ganglion cells predominate. In contrast, P-ganglion cells predominate in the macular region (where the macular GCC is measured). Our results suggest that M-ganglion cells are severely affected in MSA. P-ganglion cells are less, although still affected in MSA. The cause of these differences might be related to different patterns of myelination by oligodendrocytes of M-cells axons compared to P-cells axons (see discussion). OS: left eye.
Patterns of RNFL thinning in MSA in our longitudinal study demonstrated increases in degree of thinning with greater length of follow-up and tended to be associated with clinical measures of disease severity (UMSARS). In contrast, macular GCC thinning was less severe and, although did demonstrate increases in the degree of thinning with greater length of follow-up (Figure 4B), it was not associated with clinical measures of disease severity. This suggests that RNFL thinning is more associated to the pathological process in MSA than macular GCC thinning. Collectively, our data provide evidence that subclinical axonal loss occurs in the visual pathways of MSA patients, even in the absence of visual symptoms, and that this decline progresses over time at an estimated annual loss rate of 3.7 μm/year.
In addition to the small sample size, a shortcoming of our study was the variable time intervals between baseline and follow-up visits. Despite this limitation, we were able to demonstrate progressive reductions in RNFL thickness and, to a lesser extent, in macular GCC thickness over time. Also, our PD patients were significantly older than the MSA patients and the control subjects. To overcome this, we took into consideration the age as a covariate in our statistical analyses. Finally, our equipment does not have the capability of measuring total retinal thickness. This could be an important parameter in MSA patients as significant remodeling of the foveal architecture as has been described in PD may occur in MSA patients36, 38. Similarly, total macular volume can be affected in different ways and should be investigated 38, 40.
Our findings of progressive RNFL and GCC thinning as shown by HD-OCT are strongly suggestive of neuronal and axonal loss and are analogous to studies on MRI measures of brain atrophy in MSA patients. Change in whole and regional brain volume on serial MRI scans has been recognized as a candidate measure for neuroprotection trials41. As a potential new imaging outcome for neuroprotection studies in MSA, RNFL thickness by HD-OCT fulfills several criteria including reproducibility42, ease of patient participation, association with clinical measures, and sensitivity to changes over time. Here we provide preliminary sample sizes able to detect significant changes in clinical trials.
In conclusion, visually asymptomatic MSA patients exhibit progressive reductions in the thickness of the RNFL and the GCC. The reduction in RNFL thickness was significantly associated with disease duration. These results suggest that specific patterns of retinal degeneration detected by HD-OCT could be useful to monitor the efficacy of disease modifying agents in patients with MSA, as is already being done in other neurological disorders such as multiple sclerosis 43.
Supplementary Material
Acknowledgments
Funding source: Dysautonomia Foundation Inc. and NIH (U54NS065736, 1U01NS078025-01)
We thank Dr. Laura J. Balcer for her comments and suggestions.
Footnotes
Authors’ roles
CEMS: conception, design, analysis and interpretation of data, drafting the article and editing the manuscript for important intellectual content.
JAP: conception, design, analysis and interpretation of data, drafting the article and editing the manuscript for important intellectual content.
JM: data acquisition and statistical analysis.
LNK: statistical analysis and interpretation of data, revising the manuscript critically and final approval of the version to be published.
TRH: statistical analysis and interpretation of data, revising the manuscript critically and final approval of the version to be published.
HK: conception, design, analysis and interpretation of data, drafting the article and editing the manuscript for important intellectual content.
- Dr. Mendoza-Santiesteban receives research support from The Dysautonomia Foundation, Inc., and The Massachusetts Lions Clubs/Research to Prevent Blindness Challenge Grant.
- Dr. Palma receives research support from The Dysautonomia Foundation, Inc.; the MSA Coalition; from the National Institutes of Health (U54-NS065736-01); and has received compensation as a consultant/advisory board member for Lundbeck.
- Mr. Martinez receives research support from The Dysautonomia Foundation, Inc.
- Dr. Norcliffe-Kaufmann receives research support from The Dysautonomia Foundation, Inc., the MSA Coalition, and from the National Institutes of Health (U54-NS065736-01)
- Dr. Hedges receives research support from The Massachusetts Lions Clubs/Research to Prevent Blindness Challenge Grant.
- Dr. Kaufmann research support from the National Institutes of Health (U54NS065736 [PI] 1U01NS078025-01), the FDA (FD-R-3731-01 [PI]), and the Dysautonomia Foundation, Inc; has received compensation as a consultant/advisory board member for Lundbeck, Eli Lilly, Pfizer, and Astra Zeneca.
References
- 1.Galvin JE, Lee VM, Trojanowski JQ. Synucleinopathies: clinical and pathological implications. Arch Neurol. 2001;58(2):186–190. doi: 10.1001/archneur.58.2.186. [DOI] [PubMed] [Google Scholar]
- 2.Bodis-Wollner I, Kozlowski PB, Glazman S, Miri S. alpha-synuclein in the inner retina in parkinson disease. Ann Neurol. 2014;75(6):964–966. doi: 10.1002/ana.24182. [DOI] [PubMed] [Google Scholar]
- 3.Beach TG, Carew J, Serrano G, et al. Phosphorylated alpha-synuclein-immunoreactive retinal neuronal elements in Parkinson’s disease subjects. Neurosci Lett. 2014;571:34–38. doi: 10.1016/j.neulet.2014.04.027. [DOI] [PMC free article] [PubMed] [Google Scholar]
- 4.Roncevic D, Palma JA, Martinez J, Goulding N, Norcliffe-Kaufmann L, Kaufmann H. Cerebellar and parkinsonian phenotypes in multiple system atrophy: similarities, differences and survival. J Neural Transm. 2014;121(5):507–512. doi: 10.1007/s00702-013-1133-7. [DOI] [PMC free article] [PubMed] [Google Scholar]
- 5.Schneider M, Muller HP, Lauda F, et al. Retinal single-layer analysis in Parkinsonian syndromes: an optical coherence tomography study. J Neural Transm. 2014;121(1):41–47. doi: 10.1007/s00702-013-1072-3. [DOI] [PubMed] [Google Scholar]
- 6.Albrecht P, Muller AK, Sudmeyer M, et al. Optical coherence tomography in parkinsonian syndromes. PLoS One. 2012;7(4):e34891. doi: 10.1371/journal.pone.0034891. [DOI] [PMC free article] [PubMed] [Google Scholar]
- 7.Fischer MD, Synofzik M, Kernstock C, et al. Decreased retinal sensitivity and loss of retinal nerve fibers in multiple system atrophy. Graefes Arch Clin Exp Ophthalmol. 2013;251(1):235–241. doi: 10.1007/s00417-012-2118-1. [DOI] [PubMed] [Google Scholar]
- 8.Fischer MD, Synofzik M, Heidlauf R, et al. Retinal nerve fiber layer loss in multiple system atrophy. Mov Disord. 2011;26(5):914–916. doi: 10.1002/mds.23523. [DOI] [PubMed] [Google Scholar]
- 9.Pula JH, Towle VL, Staszak VM, Cao D, Bernard JT, Gomez CM. Retinal Nerve Fibre Layer and Macular Thinning in Spinocerebellar Ataxia and Cerebellar Multisystem Atrophy. Neuroophthalmology. 2011;35(3):108–114. doi: 10.3109/01658107.2011.580898. [DOI] [PMC free article] [PubMed] [Google Scholar]
- 10.Armstrong RA. Visual symptoms in Parkinson’s disease. Parkinsons Dis. 2011;2011:908306. doi: 10.4061/2011/908306. [DOI] [PMC free article] [PubMed] [Google Scholar]
- 11.Kandel ER, Schwartz JH, Jessell TM, Siegelbaum SA, Hudspeth AJ. Principles of Neural Science. 5. McGraw-Hill Professional; 2012. [Google Scholar]
- 12.Gilman S, Wenning GK, Low PA, et al. Second consensus statement on the diagnosis of multiple system atrophy. Neurology. 2008;71(9):670–676. doi: 10.1212/01.wnl.0000324625.00404.15. [DOI] [PMC free article] [PubMed] [Google Scholar]
- 13.Hughes AJ, Daniel SE, Kilford L, Lees AJ. Accuracy of clinical diagnosis of idiopathic Parkinson’s disease: a clinico-pathological study of 100 cases. J Neurol Neurosurg Psychiatry. 1992;55(3):181–184. doi: 10.1136/jnnp.55.3.181. [DOI] [PMC free article] [PubMed] [Google Scholar]
- 14.Wenning GK, Tison F, Seppi K, et al. Development and validation of the Unified Multiple System Atrophy Rating Scale (UMSARS) Mov Disord. 2004;19(12):1391–1402. doi: 10.1002/mds.20255. [DOI] [PubMed] [Google Scholar]
- 15.Gegenfurtner KR, Kiper DC. Color vision. Annu Rev Neurosci. 2003;26:181–206. doi: 10.1146/annurev.neuro.26.041002.131116. [DOI] [PubMed] [Google Scholar]
- 16.Lomax RG, Hahs-Vaughn DL. Statistical Concepts: A Second Course. 4. New York: Routledge - Taylor and Francis Group; 2012. [Google Scholar]
- 17.Leung CK, Yu M, Weinreb RN, et al. Retinal nerve fiber layer imaging with spectral-domain optical coherence tomography: a prospective analysis of age-related loss. Ophthalmology. 2012;119(4):731–737. doi: 10.1016/j.ophtha.2011.10.010. [DOI] [PubMed] [Google Scholar]
- 18.Chylack LT, Jr, Wolfe JK, Singer DM, et al. The Lens Opacities Classification System III. The Longitudinal Study of Cataract Study Group. Arch Ophthalmol. 1993;111(6):831–836. doi: 10.1001/archopht.1993.01090060119035. [DOI] [PubMed] [Google Scholar]
- 19.Julious SA. Sample sizes for clinical trials with normal data. Stat Med. 2004;23(12):1921–1986. doi: 10.1002/sim.1783. [DOI] [PubMed] [Google Scholar]
- 20.Poewe W, Seppi K, Fitzer-Attas CJ, et al. Efficacy of rasagiline in patients with the parkinsonian variant of multiple system atrophy: a randomised, placebo-controlled trial. Lancet Neurol. 2015;14(2):145–152. doi: 10.1016/S1474-4422(14)70288-1. [DOI] [PubMed] [Google Scholar]
- 21.Talman LS, Bisker ER, Sackel DJ, et al. Longitudinal study of vision and retinal nerve fiber layer thickness in multiple sclerosis. Ann Neurol. 2010;67(6):749–760. doi: 10.1002/ana.22005. [DOI] [PMC free article] [PubMed] [Google Scholar]
- 22.Wenning GK, Stefanova N, Jellinger KA, Poewe W, Schlossmacher MG. Multiple system atrophy: a primary oligodendrogliopathy. Ann Neurol. 2008;64(3):239–246. doi: 10.1002/ana.21465. [DOI] [PubMed] [Google Scholar]
- 23.Martinez-Navarrete GC, Martin-Nieto J, Esteve-Rudd J, Angulo A, Cuenca N. Alpha synuclein gene expression profile in the retina of vertebrates. Mol Vis. 2007;13:949–961. [PMC free article] [PubMed] [Google Scholar]
- 24.Silveira LC, Saito CA, Lee BB, et al. Morphology and physiology of primate M- and P-cells. Prog Brain Res. 2004;144:21–46. doi: 10.1016/S0079-6123(03)14402-0. [DOI] [PubMed] [Google Scholar]
- 25.Calkins DJ, Schein SJ, Tsukamoto Y, Sterling P. M and L cones in macaque fovea connect to midget ganglion cells by different numbers of excitatory synapses. Nature. 1994;371(6492):70–72. doi: 10.1038/371070a0. [DOI] [PubMed] [Google Scholar]
- 26.Curcio CA, Allen KA. Topography of ganglion cells in human retina. J Comp Neurol. 1990;300(1):5–25. doi: 10.1002/cne.903000103. [DOI] [PubMed] [Google Scholar]
- 27.Inzelberg R, Ramirez JA, Nisipeanu P, Ophir A. Retinal nerve fiber layer thinning in Parkinson disease. Vision Res. 2004;44(24):2793–2797. doi: 10.1016/j.visres.2004.06.009. [DOI] [PubMed] [Google Scholar]
- 28.Altintas O, Iseri P, Ozkan B, Caglar Y. Correlation between retinal morphological and functional findings and clinical severity in Parkinson’s disease. Doc Ophthalmol. 2008;116(2):137–146. doi: 10.1007/s10633-007-9091-8. [DOI] [PubMed] [Google Scholar]
- 29.Garcia-Martin E, Satue M, Fuertes I, et al. Ability and reproducibility of Fourier-domain optical coherence tomography to detect retinal nerve fiber layer atrophy in Parkinson’s disease. Ophthalmology. 2012;119(10):2161–2167. doi: 10.1016/j.ophtha.2012.05.003. [DOI] [PubMed] [Google Scholar]
- 30.Rohani M, Langroodi AS, Ghourchian S, Falavarjani KG, SoUdi R, Shahidi G. Retinal nerve changes in patients with tremor dominant and akinetic rigid Parkinson’s disease. Neurol Sci. 2013;34(5):689–693. doi: 10.1007/s10072-012-1125-7. [DOI] [PubMed] [Google Scholar]
- 31.Kirbas S, Turkyilmaz K, Tufekci A, Durmus M. Retinal nerve fiber layer thickness in Parkinson disease. J Neuroophthalmol. 2013;33(1):62–65. doi: 10.1097/WNO.0b013e3182701745. [DOI] [PubMed] [Google Scholar]
- 32.Garcia-Martin E, Larrosa JM, Polo V, et al. Distribution of retinal layer atrophy in patients with Parkinson disease and association with disease severity and duration. Am J Ophthalmol. 2014;157(2):470–478. e472. doi: 10.1016/j.ajo.2013.09.028. [DOI] [PubMed] [Google Scholar]
- 33.Satue M, Seral M, Otin S, et al. Retinal thinning and correlation with functional disability in patients with Parkinson’s disease. Br J Ophthalmol. 2014;98(3):350–355. doi: 10.1136/bjophthalmol-2013-304152. [DOI] [PubMed] [Google Scholar]
- 34.Hajee ME, March WF, Lazzaro DR, et al. Inner retinal layer thinning in Parkinson disease. Arch Ophthalmol. 2009;127(6):737–741. doi: 10.1001/archophthalmol.2009.106. [DOI] [PubMed] [Google Scholar]
- 35.Aaker GD, Myung JS, Ehrlich JR, Mohammed M, Henchcliffe C, Kiss S. Detection of retinal changes in Parkinson’s disease with spectral-domain optical coherence tomography. Clin Ophthalmol. 2010;4:1427–1432. doi: 10.2147/OPTH.S15136. [DOI] [PMC free article] [PubMed] [Google Scholar]
- 36.Spund B, Ding Y, Liu T, et al. Remodeling of the fovea in Parkinson disease. J Neural Transm. 2013;120(5):745–753. doi: 10.1007/s00702-012-0909-5. [DOI] [PubMed] [Google Scholar]
- 37.Lee JY, Kim JM, Ahn J, Kim HJ, Jeon BS, Kim TW. Retinal nerve fiber layer thickness and visual hallucinations in Parkinson’s Disease. Mov Disord. 2014;29(1):61–67. doi: 10.1002/mds.25543. [DOI] [PubMed] [Google Scholar]
- 38.Bodis-Wollner I, Miri S, Glazman S. Venturing into the no-man’s land of the retina in Parkinson’s disease. Mov Disord. 2014;29(1):15–22. doi: 10.1002/mds.25741. [DOI] [PubMed] [Google Scholar]
- 39.Sadun AA, Win PH, Ross-Cisneros FN, Walker SO, Carelli V. Leber’s hereditary optic neuropathy differentially affects smaller axons in the optic nerve. Trans Am Ophthalmol Soc. 2000;98:223–232. discussion 232–225. [PMC free article] [PubMed] [Google Scholar]
- 40.Schneider JS, Ault ME, Anderson DW. Retinal pathology detected by optical coherence tomography in an animal model of Parkinson’s disease. Mov Disord. 2014;29(12):1547–1551. doi: 10.1002/mds.25974. [DOI] [PubMed] [Google Scholar]
- 41.Paviour DC, Price SL, Jahanshahi M, Lees AJ, Fox NC. Longitudinal MRI in progressive supranuclear palsy and multiple system atrophy: rates and regions of atrophy. Brain. 2006;129(Pt 4):1040–1049. doi: 10.1093/brain/awl021. [DOI] [PubMed] [Google Scholar]
- 42.Wong E, Yoshioka N, Kalloniatis M, Zangerl B. Cirrus HD-OCT short-term repeatability of clinical retinal nerve fiber layer measurements. Optom Vis Sci. 2015;92(1):83–88. doi: 10.1097/OPX.0000000000000452. [DOI] [PubMed] [Google Scholar]
- 43.Balcer LJ. Clinical trials to clinical use: using vision as a model for multiple sclerosis and beyond. J Neuroophthalmol. 2014;34 (Suppl):S18–23. doi: 10.1097/WNO.0000000000000163. [DOI] [PubMed] [Google Scholar]
Associated Data
This section collects any data citations, data availability statements, or supplementary materials included in this article.