

Abstract
During the last decade, there has been a remarkable and unexplained increase in the prevalence of asthma. These studies were conducted to investigate the role of dermal exposure to triclosan, an endocrine-disrupting compound, on the hypersensitivity response to ovalbumin (OVA) in a murine model of asthma. Triclosan has had widespread use in the general population as an antibacterial and antifungal agent and is commonly found in consumer products such as soaps, deodorants, toothpastes, shaving creams, mouthwashes, and cleaning supplies. For these studies, BALB/c mice were exposed dermally to concentrations of triclosan ranging from 0.75 to 3% (0.375–1.5 mg/mouse/day) for 28 consecutive days. Concordantly, mice were ip injected with OVA (0.9 μg) and aluminum hydroxide (0.5 mg) on days 1 and 10 and challenged with OVA (125 μg) by pharyngeal aspiration on days 19 and 27. Compared with the animals exposed to OVA alone, increased spleen weights, OVA-specific IgE, interleukin-13 cytokine levels, and numbers of lung eosinophils were demonstrated when mice were coexposed to OVA and triclosan. Statistically significant increases in OVA-specific and nonspecific airway hyperreactivity were observed for all triclosan coexposed groups compared with the vehicle and OVA controls. In these studies, exposure to triclosan alone was not demonstrated to be allergenic; however, coexposure with a known allergen resulted in enhancement of the hypersensitivity response to that allergen, suggesting that triclosan exposure may augment the allergic responses to other environmental allergens.
Keywords: triclosan, asthma, chemical adjuvancy
Triclosan (2,4,4′-trichloro-2′-hydroxydiphenyl ether) is a high volume production chemical that is widely used occupationally with up to 10 million pounds produced annually in the United States alone (FDA, 2008). Triclosan has antimicrobial and antifungal properties and has been used in the United States for more than 40 years. It was originally introduced as an additive to medical devices such as sutures to inhibit bacterial growth in wounds (Ming et al., 2007). Although there is evidence for the efficacy of triclosan in clinical applications, its current major use is in consumer products including antibacterial soaps (0.10–1.00%), deodorants (0.0375%), toothpastes (0.3%), shaving creams, skin creams (0.1%), mouthwashes, feminine hygiene products, and cosmetics (Fang et al., 2010). Triclosan is also used as a preservative, fungicide, and biocide in household cleaning products and is infused into other household items such as kitchen utensils, cutting boards, kitchen wipes, mop heads, computer equipment, clothing, air filters, flooring, toys, bedding, and trash bags (Fang et al., 2010; Glaser, 2004). It was demonstrated that showering or bathing with 2% triclosan is an effective regimen for the decolonization of patients' skin carrying methicillin-resistant Staphylococcus aureus (Jones et al., 2000). Research suggests that beyond its use in clinical applications and toothpaste to prevent gingivitis (Gunsolley, 2006), there is questionable evidence that triclosan provides any extra benefit in other consumer products (Tan et al., 2002).
There are limited studies evaluating the toxicity of triclosan; however, in general, it has been shown to exhibit low oral and dermal toxicity, with some evidence of higher toxicity via inhalation (DeSalva et al., 1989; Fang et al., 2010). Triclosan is not considered to produce significant mutagenic effects or genotoxicity (DeSalva et al., 1989); however, the carcinogenicity studies that have been conducted have been described as contradictory and/or inadequate (DeSalva et al., 1989; FDA, 2008; Lyman and Furia, 1969). Developmental and reproductive effects have recently been suggested (Paul et al., 2012; Stoker et al., 2010). In general, triclosan has not been reported as a skin sensitizer when tested in animal models (DeSalva et al., 1989; Lyman and Furia, 1969) or in humans (DeSalva et al., 1989; Kligman and Epstein, 1975; Marzulli and Maiback, 1973) although rare case reports have been described (Savage et al., 2011; Steinkjer and Braathen, 1988).
Numerous reports suggest that triclosan is an endocrine-disrupting compound (EDC). EDCs have deleterious effects on human health, homeostasis, metabolism, and reproduction by mimicking or affecting hormones (Diamanti-Kandarakis et al., 2009). Studies have shown that triclosan is weakly androgenic (Foran et al., 2000) and estrogenic (Gee et al., 2008). Additionally, triclosan has been shown to disrupt thyroid homeostasis in mammalian models. It has been suggested that exposure to EDCs, including triclosan, is at least in part responsible for recent changes in the frequency of asthma and allergic responses (Clayton et al., 2011, Savage et al., 2012). A study conducted between 2003 and 2006 found a positive association between elevated urinary triclosan levels and allergy or hay fever diagnosis, but not cytomegalovirus antibody titers, and concluded that triclosan may negatively affect the immune system (Clayton et al., 2011). A more recent study using data from 860 children obtained from the 2005–2006 National Health and Nutrition Examination Survey found levels of urinary triclosan to be positively associated with aeroallergen and food sensitization (Savage et al., 2012).
Triclosan has recently attracted the attention of the scientific community, regulatory agencies, and the general public because of its high production volume, widespread applications, and endocrine-disruption effects. In spite of the epidemiologic evidence of a potential role for triclosan in allergic disease, there are no animal studies in the current literature that have examined the contribution of triclosan to asthma pathogenesis. These studies characterize the immunomodulatory effects of triclosan following dermal exposure in a murine model of asthma.
Materials and Methods
Animals
Female BALB/c mice were used for the murine model. This mouse strain has a Th2 bias and is commonly used to evaluate IgE-mediated sensitization (Fairley et al., 2007). The mice were purchased from Taconic (Germantown, NY) at 6–8 weeks of age. Upon arrival, the animals were allowed to acclimate for a minimum of 5 days. Each shipment of animals was randomly assigned to treatment group, weighed, and individually identified via tail tattoo. A preliminary ANOVA on body weights was performed to ensure a homogeneous distribution of animals across treatment groups. Animals were housed at a maximum of five per cage in ventilated plastic shoebox cages with hardwood chip bedding. NIH-31 modified 6% irradiated rodent diet (Harlan Teklad) and tap water from water bottles were provided. The temperature in the animal facility was maintained between 68°F and 72°F and the relative humidity between 36 and 57%. The light/dark cycle was maintained on 12-h intervals. All animal experiments were performed in the Association for Assessment and Accreditation of Laboratory Animal Care accredited National Institute for Occupational Safety and Health animal facility in accordance with an animal protocol approved by the Institutional Animal Care and Use Committee.
Chemicals
All chemicals, triclosan (CAS no. 3380-34-5), chicken egg ovalbumin (OVA; CAS no. 9006-59-1), methacholine chloride (Mch; CAS no. 101-86-0), and aluminum hydroxide (Alum; CAS no. 1330-44-5), were purchased from Aldrich Chemical Company, Inc. (Milwaukee, WI).
Triclosan Exposure
Mice (eight per group) were exposed topically to acetone or increasing concentrations of triclosan (up to 1.5 mg/per mouse) dissolved in acetone (99.5%) on the dorsal surface of each ear (25 μl per ear) for 28 consecutive days. The highest concentration of triclosan (1.5 mg/3%) for these studies was selected based on the results from a dermal toxicity study (Fang et al., 2010) conducted in male mice where the lowest observable effect limit (LOEL) for dermal exposure was found to be 1.5 mg/animal/day. The LOEL was based on treatment-related dermal irritation at the treatment site and on increased liver weights in this treatment group. Acetone is an accepted vehicle for the murine local lymph node assay, which is used to evaluate skin sensitizers. Therefore, based on this and solubility, it was selected as the vehicle for the dermal triclosan exposures. In studies presented here, mice were simultaneously sensitized to OVA (dissolved in sterile PBS) as previously described by ip injection and pulmonary aspiration (Fairley et al., 2007). In brief, animals were exposed to OVA (0.9 μg OVA + 0.5 mg Alum/200 μl PBS) or 0.5 mg Alum/200 μl sterile PBS by ip injection on days 1 and 7. Mice were then challenged with OVA (125 μg/50 μl sterile PBS) or 50 μl sterile PBS via pharyngeal aspiration under light anesthesia (isofurane) on days 19 and 27 using oropharyngeal aspiration as previously described (Rao et al., 2003). The study consisted of five groups that are represented by their specific exposure scenario: a vehicle control (VC: acetone[dermal]/PBS[pulmonary]), OVA control (OVA: acetone[dermal]/OVA[pulmonary]), and three coexposure groups (0.75, 1.5, or 3% triclosan[dermal]/OVA[pulmonary]). Although the animals were simultaneously exposed to OVA and triclosan, it was through different exposure routes, and therefore, there was never a mixture of triclosan and OVA being administered to the animals.
Hematology
Selected hematological parameters were evaluated using an automatic hematology analyzer (Hemavet 950; Drew Scientific, Waterbury, CT): erythrocyte and leukocyte counts, leukocyte differential (lymphocytes, neutrophils, monocytes, basophils, and eosinophils), platelet count, hemoglobin, mean corpuscular hemoglobin (MCH), mean corpuscular hemoglobin concentration, mean platelet volume, and platelet distribution width.
Airway Hyperreactivity
Nonspecific airway hyperreactivity (AHR) and specific AHR were evaluated and expressed as enhanced pause (Penh), a dimensionless parameter used to measure pulmonary resistance, calculated from changes in the pattern of chamber pressure induced by airway challenge.
Nonspecific challenge
Forty-eight hours after the first OVA challenge on day 21, AHR was assessed. An initial 5-min baseline reading was obtained prior to challenge with increasing concentrations of aerosolized Mch (10, 25, and 50 mg/ml in PBS). For each concentration of Mch, average Penh values were collected every 30 s for 5 min. Mch exposure occurred only for the first 3 min of this 5-min period. During the final 2 min, mice were exposed to fresh air alone. Average Penh values for each 5-min period were used as the measure of AHR.
Specific challenge
On day 27, immediately following the final pulmonary OVA challenge, AHR was assessed as changes in airway function following specific allergen challenge (OVA) using the Buxco unrestrained whole body plethysmography system (Buxco Research Systems, Wilmington, NC). Airway measurements (Penh) were collected over a 6-h period. Data were presented as area under the curve (AUC). On day 28, 24 h after the final OVA challenge, mice were euthanized by an overdose of pentobarbital (injected ip). Body and organ weights were measured, the tracheobronchial lymph nodes (TBLN) and whole lungs were collected for cytokine analysis, blood was collected by transection of the abdominal aorta for antibody (IgE and IgG1) analysis and hematological analyses, bronchoalveolar lavage (BAL) fluid was collected for analysis of cellular infiltrates, and histopathologic analysis was performed on lung tissue from a representative animal from each exposure group.
OVA-Specific ELISA
Standard colorimetric sandwich ELISAs were performed on serum collected from experimental animals. For the OVA-specific IgE ELISA, the antibodies and standard controls were purchased from BD Pharmingen (San Jose, CA) and Genway (San Diego, CA). In brief, 96-well fat bottom plates (Immunlon-4HBX) were coated with (2 μg/ml in PBS) purified monoclonal rat anti-mouse IgE antibody (clone R35-72) and incubated overnight at 4°C. The plates were washed thrice with PBS/Tween and then blocked for 1 h with diluent (PBS/1% nonfat milk) at room temperature. Serum samples were diluted 1:10, and the IgE control standard (anti-OVA IgE; Genway Cat no. 20-783-71815) was prepared, added to the coated plates, and incubated at room temperature for 1 h. The plates were then washed, OVA (25 μg/ml; Sigma Cat no. A-5503) was added, and plates were incubated at room temperature for 1 h. The plates were washed, rabbit anti-OVA horseradish peroxidase (Genway Cat no. 18-272-197841; 1:8000 dilution) was added, and plates were incubated for 1 h at room temperature. The anti-Ovalbumin IgG1 (mouse) EIA Kit (Item No. 500830) purchased from Cayman Chemical Company (Ann Arbor, MI) was used according to manufacturer's directions. In brief, serum samples were diluted 1:30,000, added to the 96-well precoated plate provided in the kit, and incubated at room temperature for 2 h on an orbital microplate shaker at 100–250 rpm. The plate was washed four times, and detection antibody working solution was added to the plate. The plate was then incubated for 1 h at room temperature with shaking. To stop the final enzymatic reaction for both the IgE and IgG1 assay, 3,3′,5,5′-tetramethylbenzidine (Sigma Cat no. T4444) was added to the plates, which were then incubated at room temperature until color change. The reactions were stopped with 2N sulfuric acid. Absorbance was determined using a Spectramax Vmax plate reader (Molecular Devices, Sunnyvale, CA) at 405 nm. OVA-specific antibody concentrations (IgE and IgG1) for each sample were interpolated from a standard curve using multipoint analysis.
Bronchial Alveolar Lavage—Cellular Infiltrate Phenotyping
Following euthanasia, lungs were perfused, via the right ventricle of the heart, with 10 ml of PBS to remove blood cells present within the lung vasculature. BAL samples were then collected by cannulating the trachea of each mouse and lavaging thrice, each time with 1 ml of sterile PBS. Approximately 2.5 ml of bronchial lavage fluid was recovered from each mouse. Suspended cells were pelleted by centrifugation (5 min at 486 × g) and resuspended in 200 μl of flow staining buffer containing the following combinations of fluorochrome-conjugated antibodies to identify infiltrating eosinophil, neutrophil, and alveolar macrophage (CD45-APC, Siglec-F-PE, CD11c-biotin, Ly6G-FITC) populations. Cell suspensions were incubated with labeled antibodies on ice in the dark for 30 min and washed. Samples stained with biotin labeled anti-CD11c (1:100 dilutions in flow staining buffer) were resuspended in flow staining buffer containing streptavidin PerCP, incubated for an additional 30 min on ice in the dark, and washed. All samples were then fixed by resuspending in 100 μl BD cytofixation buffer (BD Bioscience, San Diego, CA) and incubating for 15 min. Cells were then washed, resuspended in flow staining buffer, and enumerated using a LSRII Flow Cytometer (Becton Dickinson, San Jose, CA) within 48 h. Lung cellular infiltrates were identified phenotypically based upon the distinct expression of the following cell surface markers: eosinophils (CD45hi, LY6Glow, Siglec Fhi, CD11clow), neutrophils (CD45hi, LY6Ghi, CD11clow), and alveolar macrophages (CD45hi, LY6Glow, Siglec Fhi, CD11chi). An aliquot of BAL fluid (10 μl) was counted on a Cellometer Auto A4 (Nexcelom Bioscience, Lawrence, MA) to determine the total number of cells present.
Histopathology
Lungs were insufflated with 10% formalin and collected for histopathology. Lung tissues were embedded in paraffin, sectioned at 5 μm, and stained with hematoxylin and eosin, alcian blue/PAS, Geimsa, and toluidine blue, and a representative lung from each group was evaluated by a veterinary pathologist. Semiquantitative pathology scores were described as the sum of the severity and distribution of the histopathologic changes as previously described (Hubbs et al., 2008).
Cytokine mRNA Analysis
Lungs from exposed mice were analyzed for mRNA expression. Lungs were collected in 0.8 ml of RNAlater (Ambion, Grand Island, NY) and stored at −80°C for subsequent processing. RNA was isolated using the miRCURY RNA Isolation Kit (Exiqon, Woburn, MA) as specified by the manufacturer. The concentration and purity (260/280) of RNA were determined using an ND-1000 spectrophotometer (Thermo Scientific NanoDrop, Wilmington, DE). One microgram of RNA was reverse transcribed using the High Capacity cDNA Reverse Transcription Kit (Applied Biosystems, Foster City, CA) as directed by the manufacturer. Relative fold changes in gene expression were assessed using RT-PCR on a 7500 Fast Real-Time PCR System (Applied Biosystems) using TaqMan PCR Master Mix (Applied Biosystems) as specified in the manufacturer's protocol. RT-PCR data were collected and expressed as relative fold increase over control, calculated by the following formula: 2−ΔΔCt = ΔCtSample − ΔCtControl⋅ ΔCt = CtTarget − CtGAPHD, where Ct is the cycle threshold as defined by Control Target GAPDH manufacturer's instructions. Cytokines assessed were interferon gamma (IFN-γ) and interleukin (IL)-4, -5, -13, -17, -21, and -22. Glyceraldehyde 3-phosphate dehydrogenase was used as the endogenous control.
Ex Vivo Analysis of Cytokine Production From Tracheobronchial Lymph Node Cells
TBLN were collected in 3 ml of sterile PBS. Single cell suspensions of lymph node cells were made by grinding the tissue between the frosted ends of two microscope slides. Cells were counted using a Coulter Counter (Z1 model; Beckman Coulter, San Jose, CA), adjusted to 1 × 10⁶ cells/ml in sterile RPMI media containing 10% fetal calf serum, and seeded in 48-well plates (500,000 cells per well). Cells were then stimulated with α-CD3 and α-CD28 antibodies (2 μg/ml each; BD Pharmingen) for 24 h at 37°C and 5% CO2. Supernatants were analyzed for IL-4, IL-5, IL-13, and IFN-γ levels using OptEIA ELISA kits purchased from BD Biosciences according to the manufacturer's instructions.
Statistical Analysis
All variables with the exception of Penh were analyzed using GraphPad Prism version 5.0 (San Diego, CA). Data were first tested for homogeneity using the Bartlett's Chi Square test. A one-way ANOVA was conducted. If the ANOVA showed significance at p < 0.05 or less, the Dunnett's Multiple Range t -test was used to compare treatment groups with the control group. Linear trend analysis was performed to determine whether the test articles had exposure concentration–related effects for the specified endpoints. Statistical significance is designated by * (p ≤ 0.05) and ** (p ≤ 0.01). SAS/STAT software (Version 9.2 of the SAS system for Windows; SAS Institute, Cary, NC) was used to analyze nonspecific AHR using Penh. A two-way factorial ANOVA with concentration of Mch treated as a repeated measure to account for multiple measures in individual animals was performed using PROC MIXED. Comparisons between treatment groups were then calculated at each level of MCH utilizing the “slice” option. Specific AHR was assessed using AUC for the 6-h period following the OVA challenge. AUC values across treatment groups were analyzed utilizing Proc GLM. Subsequent pairwise comparisons between triclosan exposed animals with either vehicle or OVA controls were performed with Fishers' least significant difference test. All differences were considered significant at p < 0.05.
Results
Toxicity
There were no deaths in triclosan-exposed animals. During the first 2 weeks of exposure, mice dosed with triclosan had a mild degree of irritation (redness, scabbing, etc.) that resolved after the 3rd week. There were no significant changes in body weights throughout the course of the study (Table 1). All exposure groups had statistically significant increases in spleen weights (mg, % bw) compared with the VC (Table 1). Exposure to the highest concentration of triclosan (3%) resulted in a statistically significant increase in spleen weights (mg) compared with the OVA control. Although this result was not statistically significant when evaluated as a percent body weight, there was a dose-responsive trend (linear trend test p < 0.05). Hematological analysis demonstrated a statistically significant decrease in % lymphocytes (OVA, 0.75% triclosan + OVA, 1.5% triclosan + OVA) along with an increase in % neutrophils for the coexposure groups (OVA, 1.5% triclosan + OVA) compared with the VC (Table 2). Although there was a general increasing trend in eosinophils and basophils for the coexposure groups compared with the OVA control, they did not reach statistical significance. There were no other statistically significant changes in hematological parameters following exposure (Table 2).
Table 1. Body/Organ Weights of Female BALB/c Mice Coexposed to Triclosan and OVA.
| Parameter | VC | OVA | Triclosan (%) + OVA | ||
|---|---|---|---|---|---|
|
| |||||
| 0.75 | 1.5 | 3.0 | |||
| Body weight (g) | 20.43 ± 0.38 | 19.71 ± 0.42 | 19.43 ± 0.33 | 19.50 ± 0.49 | 20.02 ± 0.48 |
| Kidney weight | |||||
| (mg) | 239 ± 8 | 222 ± 7 | 215 ± 6 | 216 ± 8 | 239 ± 8 |
| % bw | 1.17 ± 0.04 | 1.13 ± 0.03 | 1.11 ± 0.03 | 1.11 ± 0.03 | 1.19 ± 0.03 |
| Spleen weight | |||||
| (mg) | 87 ± 6 | 116 ± 5* | 124 ± 5* | 119 ± 7* | 141 ± 7*,# |
| % bw | 0.43 ± 0.03 | 0.59 ± 0.03* | 0.64 ± 0.03* | 0.61 ± 0.03* | 0.71 ± 0.05* |
| Thymus weight | |||||
| (mg) | 37 ± 2 | 42 ± 4 | 39 ± 2 | 34 ± 2 | 39 ± 2 |
| % bw | 0.18 ± 0.01 | 0.21 ± 0.02 | 0.20 ± 0.01 | 0.17 ± 0.01 | 0.19 ± 0.01 |
| Liver weight | |||||
| (mg) | 1028 ± 32 | 986 ± 37 | 963 ± 31 | 978 ± 35 | 1057 ± 39 |
| % bw | 5.03 ± 0.14 | 5.00 ± 0.14 | 5.00 ± 0.10 | 5.00 ± 0.08 | 5.27 ± 0.12 |
Note. Values are expressed as means (± SE) for each group. bw, body weight.
Significantly different (p < 0.05) from VC (*) or OVA control(#).
Table 2. Hematology Parameters of Female BALB/c Mice Coexposed to Triclosan and OVA.
| Parameter | VC | OVA | Triclosan (%) + OVA | ||
|---|---|---|---|---|---|
|
| |||||
| 0.75 | 1.5 | 3.0 | |||
| Hemoglobin (g/dl) | 8 ± 0.8 | 8 ± 1 | 8 ± 1 | 9 ± 1 | 5 ± 1 |
| Erythrocytes (M/μl) | 6 ± 0.7 | 6 ± 0.7 | 5 ± 2 | 7 ± 1 | 5 ± 1 |
| Platelets (K/μl) | 112 ± 24 | 163 ± 37 | 156 ± 53 | 207 ± 41 | 109 ± 34 |
| MCV (fl) | 52 ± 0.7 | 51 ± 1 | 51 ± 0.8 | 51 ± 0.5 | 49 ± 0.2 |
| MCH (pg) | 14 ± 0.3 | 13 ± 0.4 | 13 ± 0.5 | 13 ± 0.3 | 13 ± 0.1 |
| MCHC (g/dl) | 27 ± 0.4 | 31 ± 1 | 24 ± 1 | 26 ± 0.5 | 26 ± 0.08 |
| PDW (%) | 16 ± 0.2 | 16 ± 0.3 | 16 ± 0.2 | 17 ± 0.2 | 17 ± 0.03 |
| Leukocytes (K/μl) | 1 ± 0.3 | 1 ± 0.3 | 1 ± 0.4 | 1 ± 0.2 | 1 ± 0.6 |
| % Lymphocytes | 77 ± 2 | 59 ± 33* | 60 ± 33* | 61 ± 43* | 65 ± 2 |
| % Neutrophils | 17 ± 3 | 30 ± 13* | 28 ± 5 | 29 ± 53* | 21 ± 2 |
| % Monocytes | 4 ± 1 | 9 ± 2 | 8 ± 2 | 7 ± 2 | 9 ± 2 |
| % Eosinophils | 0.9 ± 0.3 | 1.2 ± 1 | 2.5 ± 1.6 | 2.4 ± 1.1 | 3.4 ± 1.6 |
| % Basophils | 0.5 ± 0.1 | 0.4 ± 0.1 | 1.2 ± 0.8 | 0.6 ± 0.2 | 2.1 ± 0.8 |
Note. Values are expressed as the means (± SE) for each group.
Significantly different (p < 0.05, *) from the VC.
Coexposure of OVA and Triclosan Enhances Nonspecific and Specific AHR
Penh values for the OVA control group were elevated compared with the VC following Mch challenge reaching statistical significance after challenge with the 10 mg/ml dose (Table 3). Coexposure of triclosan and OVA and challenge with 25 and 50 mg/ml Mch resulted in statistically significant enhancements in AHR for all coexposure groups compared with the OVA control (Fig. 1A and Table 3). A concentration dose response to triclosan was not observed. Specific challenge with OVA resulted in a statistically significant increased AUC for all animals coexposed to triclosan and OVA (Table 3, Fig. 1B) compared with the OVA alone groups. This response was not dose responsive. Although not statistically significant, the AUC for the OVA control group was elevated compared with the VC (Table 3). Results from a preliminary study evaluating repeated dermal exposure to triclosan (3%) in the absence of OVA did not identify an effect on nonspecific AHR (Supplementary data S1A).
Table 3. Assessment of Airway Hyperreactivity Following Coexposure to Triclosan and OVA.
| Nonspecific AHR | Specific AHR | ||||
|---|---|---|---|---|---|
|
|
|
||||
| Triclosan | 10 mg/ml | 25 mg/ml | 50 mg/ml | Triclosan | AUC |
| 0%a | 0.18 ± 0.04 | 0.92 ± 0.19 | 1.87 ± 0.39 | 0%a | 15,661 ± 620 |
| 0%b | 0.66 ± 0.14# | 1.57 ± 0.21 | 2.87 ± 0.44 | 0%b | 40,596 ± 8679 |
| 0.75% | 1.16 ± 0.13 | 3.95 ± 0.403* | 8.52 ± 1.133* | 0.75% | 76,851 ± 11,4943* |
| 1.5% | 1.10 ± 0.37 | 4.96 ± 2.183* | 7.94 ± 2.733* | 1.5% | 85,050 ± 97613* |
| 3% | 1.08 ± 0.13 | 3.78 ± 0.633* | 7.54 ± 1.183* | 3% | 78,091 ± 10,9183* |
Notes. Mice (eight per group) were dermally exposed to triclosan for 28 days, sensitized with OVA on days 1 and 7 of the experiment, and then challenged with OVA via pharyngeal aspiration on days 19 and 27. Nonspecific AHR was evaluated on day 21, and specific AHR was evaluated on day 27 immediately following pulmonary challenge. Values represent the mean Penh ± SE following Mch challenge (0, 10, 25, and 50 mg/ml) or AUC.
Statistical significance is designated as # (p ≤ 0.01) compared with the VC (0%a) or * (p ≤ 0.01) compared with the OVA control (0%b).
Fig. 1.
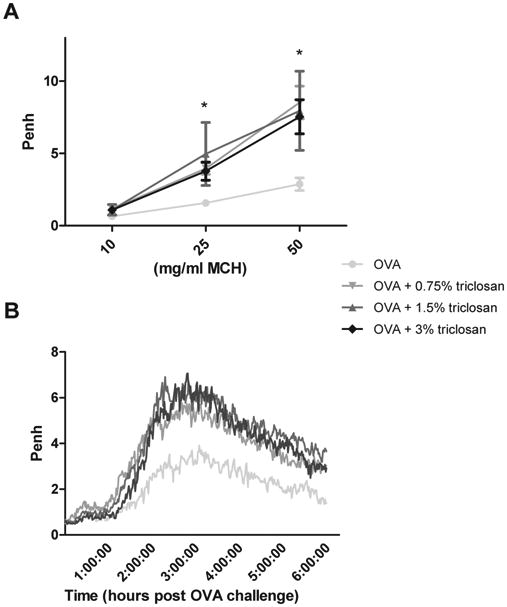
Effect of coexposure to triclosan and OVA on airway hyperreactivity. Nonspecific (A) and specific (B) airway hyperreactivity were evaluated in mice (eight per group) that were dermally exposed to triclosan for 28 days and sensitized with OVA on days 1 and 7 of the experiment and then challenged with OVA via pharyngeal aspiration on days 19 and 27. Nonspecific AHR was evaluated on day 21, and specific AHR was evaluated on day 27 immediately following pulmonary challenge. Each point/line represents mean values (baseline subtracted) ± SE of eight mice per group. Levels of statistical significance are designated as * (p < 0.05) for all coexposure groups compared with the OVA control. The data graphed are the average Penh value plotted over the 6-h collection period for the OVA-specific airway response.
Enhanced Serum Antibody Levels
Serum OVA-specific IgE levels were dose responsively (linear trend test p < 0.05) increased from 679 ng/ml ± 136 in the OVA control mice to 1644 ng/ml ± 225 in mice exposed to 3% triclosan and OVA (Fig. 2A), where statistical significance was reached. OVA-specific IgG1 levels were not significantly elevated for any of the coexposure groups compared with the OVA control (Fig. 2B). Antibody levels (OVA-specific IgE and IgG1) were statistically increased for all exposure groups compared with the VC (Fig. 2). Results from a preliminary study evaluating repeated dermal exposure to triclosan (3%) in the absence of OVA did not identify an effect on total serum IgE (Supplementary data S1B).
Fig. 2.
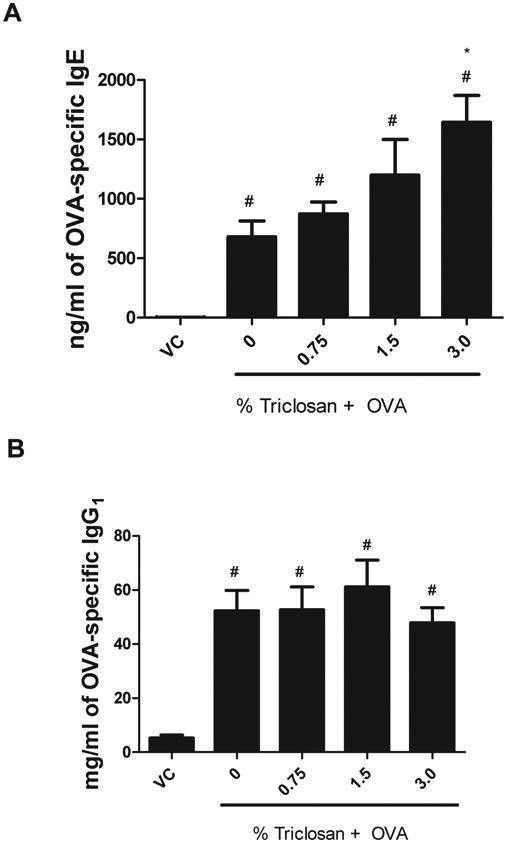
OVA-specific antibody production following coexposure to triclosan and OVA. Analysis of OVA-specific (A) IgE and (B) IgG1, following exposure to triclosan and OVA, was measured using an ELISA. Bars represent mean ± SE for each group of eight mice. Statistical significance (p ≤ 0.05) is designated as * compared with the OVA control or # compared with the VC.
Increased Lung Eosinophils Following Triclosan and OVA Exposure
A significant increase in the number of BAL cells was observed following OVA treatment (18.2 × 10⁵ cells/lung ± 1.5 × 10⁵) compared with the VC (2.1 × 10⁵ cells/lung ± 0.3 × 10⁵) (Fig. 3A). The number of total cells was significantly elevated for the 0.75% triclosan + OVA group (29.6 × 10⁵ cells/lung ± 1.4 × 10⁵) compared with the OVA control (18.2 × 10⁵ cells/lung ± 1.5 × 10⁵). The number of eosinophils was statistically significantly increased in the 0.75% triclosan + OVA group (14.2 × 10⁵ cells/lung ± 1.0 × 10⁵) compared with the OVA control (5.7 × 10⁵ cells/lung ± 1.7 × 10⁵) (Fig. 3B). A significant increase in the absolute number of neutrophils was observed for the OVA treatment groups (4.1 × 10⁵ cells/lung ± 1.2 × 10⁵) compared with the VC (1483 cells/lung ± 1297), but no difference was detected when the coexposure groups were compared with the OVA control (Fig. 3C). No significant changes in the absolute number of alveolar macrophages were observed for the triclosan + OVA groups compared with the OVA control or VC (Fig. 3D). Results from a preliminary study evaluating repeated dermal exposure to triclosan (3%) in the absence of OVA did not identify any effect on eosinophil number (Supplementary data S1C).
Fig. 3.
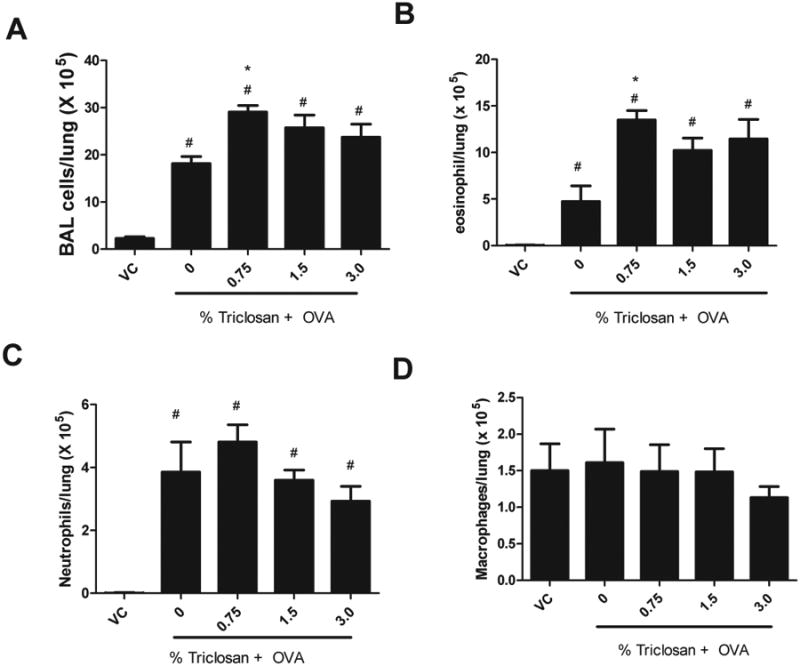
Effect of coexposure to triclosan and OVA on BAL infiltrates. Absolute numbers of (A) total BAL cells, (B) eosinophils, (C) neutrophils, and (D) macrophages evaluated in mice following exposure to triclosan + OVA. Error bars represent mean ± SE of seven mice per group. Statistical significance (p ≤ 0.05) is designated as * compared with the OVA control or # compared with the VC.
Histology
No significant lesions were observed in the lungs of the representative control mouse (Fig. 4A). The histopathologic changes associated with combined OVA and triclosan exposure included multifocal and coalescent, eosinophilic and plasmacytic bronchointerestitial pneumonia with multifocal and coalescent, pleocellular alveolitis with rare giant cells; multifocal, eosinophilic vasculitis with associated reactive endothelium; eosinophilic and plasmacytic perivascular cuffing; multifocal and coalescent, lymphohistiocytic and eosinophilic, pleuritis; multifocal, alveolar epithelial cell hypertrophy and hyperplasia; and mucous metaplasia of airway epithelium (Figs. 4B and C). Similar changes were noted in the representative mouse from the other combined exposure groups (OVA + 0.75% or 1.5% triclosan) (data not shown). Changes in the representative OVA-exposed mouse were noted to be similar but with a less striking eosinophilic response and with smaller inflammatory foci (Fig. 4D). Significant mast cell infiltration was not seen in toluidine blue–stained lung sections in any mouse. The overall histopathology findings were consistent with the findings in the BAL fluid.
Fig. 4.
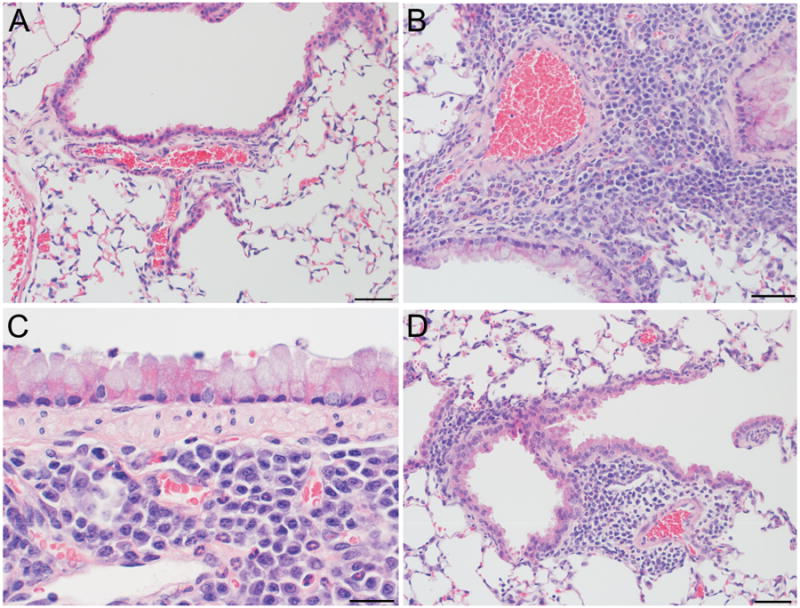
Lung histopathology following coexposure to triclosan and OVA. Photomicrographs represent (A) lung of a VC mouse (bar = 50 μm); (B) lung of a mouse exposed to OVA and 3% triclosan demonstrating peribronchiolar, vascular, and perivascular infiltrates with extension into alveolar spaces (bar = 50 μm); (C) higher magnifications of the lung from the mouse in B showing mucous metaplasia and peribronchiolar plasma cells and eosinophils (bar = 20 μm); (D) lung of a mouse exposed to OVA alone showing perivascular and peribronchiolar inflitrates with extension into alveolar spaces (bar = 50 μm).
Increased IL-13 mRNA Expression in Lung Tissue Following Triclosan and OVA Exposure
Supporting its role in promoting mucus secretion, AHR, and tissue remodeling, expression of IL-13 mRNA in lung tissue was found to be dose responsively upregulated in all groups of animals exposed to triclosan and/or OVA compared with those exposed to VC alone (Fig. 5). Fold changes of 3.9 (OVA), 12.2 (OVA + 0.75% triclosan), 51.4 (OVA + 1.5% triclosan), and 68.2 (OVA + 3.0% triclosan) were obtained with statistical significance demonstrated for all coexposure groups compared with VC. Statistical significance was only obtained for the high concentration group compared with the OVA control. Based on this preliminary data, no significant modulation of IL-4, IL-5, IL-17, IL-21, IL-22, IL-9, or IFN-γ mRNA was observed following treatment with any triclosan concentration tested.
Fig.5.
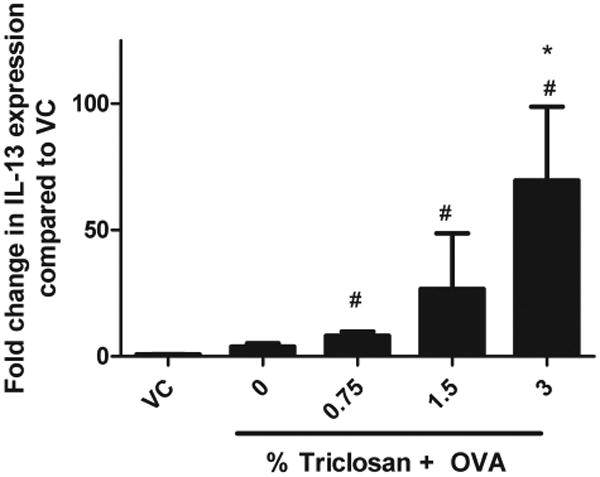
Effect of coexposure to triclosan and OVA on IL-13 mRNA cytokine production by the Lung. IL-13 mRNA expression was evaluated in mice following coexposure to triclosan + OVA. Error bars represent mean ± SE of four mice per group. Statistical significance (p ≤ 0.05) is designated as * compared with the OVA control or # compared with the VC.
Increasing Trend in IL-13 Cytokine Production by Lymph Nodes
An increase in IL-4, IL-5, IL-13, and IFN-γ cytokine production by TBLN was observed for all OVA-treated groups compared with the VC (Fig. 6). A dose-responsive trend in IL-13 production (linear trend test p < 0.05) was observed for the coexposure groups compared with the OVA controls (Fig. 6C), with an almost twofold increase in the 3% triclosan + OVA (828 ± 155 pg/ml) exposure group compared with the OVA controls (433 ± 92 pg/ml). Although IL-4 and IL-5 are also designated as prototypical allergic cytokines, no statistically significant changes were observed when coexposed groups were compared with the OVA control (Figs. 6A and B). This finding supports the requirement of earlier roles for IL-4 and IL-5 in the allergic response such as those essential for driving IgE production and promoting the terminal differentiation and survival of eosinophils compared with the later roles of IL-13 involved in AHR. No statistically significant change in IFN-γ cytokine production compared with the OVA control was observed (Fig. 6D). Results from a preliminary study evaluating repeated dermal exposure to triclosan (3%) in the absence of OVA did not identify an elevation in IL-13 cytokine levels (Supplementary data S1D).
Fig. 6.
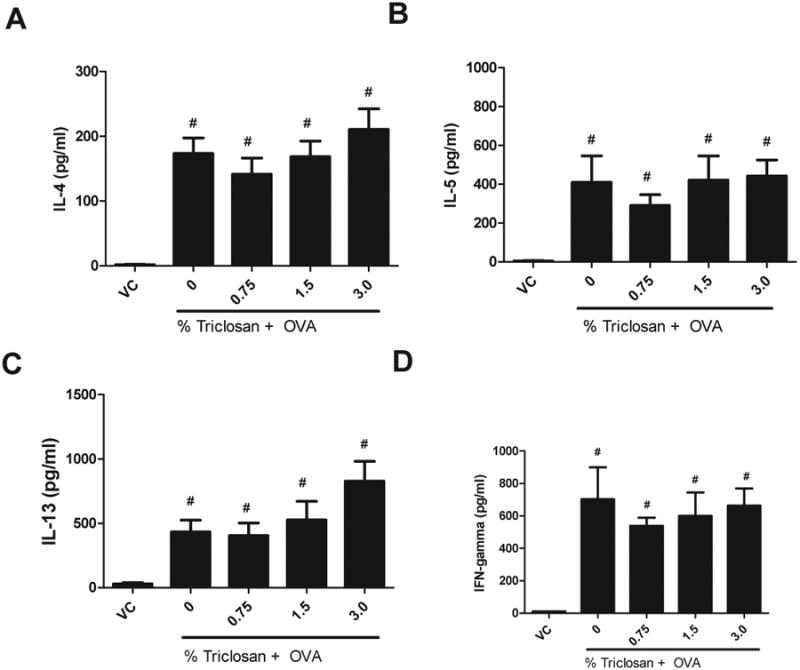
Effect of coexposure to triclosan and OVA on cytokine production by the tracheobronchial lymph node. (A) IL-4, (B) IL-5, (C) IL-13, and (D) IFN-γ protein expression were evaluated by ELISA in ex vivo stimulated lymph node cells following coexposure to triclosan + OVA. Error bars represent mean ± SE of eight mice per group. Statistical significance (p ≤ 0.05) is designated as # compared with the VC.
Discussion
During the last decade, there has been a remarkable and unexplained increase in the prevalence of asthma. Some have hypothesized that widespread use of antimicrobial ingredients such as triclosan may be a contributing factor. This concept is based on the hygiene hypothesis, which proposes that lack of pathogen exposure during development can alter the usual development of the immune system by eliminating or changing the commensal microbiota (Okada et al., 2010). Although this provides one potential explanation, individuals in industrial societies are also exposed to an increasing number of man-made chemicals. During the same time span for the observed increases in allergic disease, individuals in industrial societies have been exposed to an increasing number of chemicals with 50,000 in industrial use and an additional 500 new chemicals being introduced yearly. Although many chemicals are known to directly induce asthma, there is also the potential for chemicals to function as adjuvants, augmenting the immune response induced by other chemical and/or protein allergens. Studies in our laboratory and others did not identify triclosan to be a sensitizing chemical (DeSalva et al., 1989; Fang et al., 2010); however, in the present studies, dermal exposure to triclosan in the presence of an allergen was found to augment the allergic response to that allergen (OVA) in a mouse model of asthma. Although this does not support the classification of triclosan as a skin sensitizer, it does suggest the potential for a role in chemical adjuvancy.
The high level of consumer exposure to triclosan is reflected by its detection in environmental wastewater and presence in human fluids. Triclosan was among the top seven organic wastewater contaminants found in samples from a network of 139 streams across 30 states by the U.S. Geological Survey (Kolpin et al., 2002). Triclosan has been found in drinking water, surface water, wastewater, and environmental sediment (Lindström et al., 2002). Given the prevalence of triclosan in the environment, it is not surprising that measurable levels have been detected in the majority of individuals examined to date (Adolfsson-Erici et al., 2002; Calafat et al., 2008; Sandborgh-Englund et al., 2006) The primary routes of occupational exposure are through dermal contact and inhalation, and it has been estimated that a total of 188,670 employees in 16 different industries were potentially exposed to triclosan (www.cdc.gov/noes). Triclosan has been shown to undergo dermal absorption in both rodent and to a lesser degree human skin, affording it the potential to interact with immune cells in the dermis (Black et al., 1975; Kanetoshi et al., 1992). A study conducted by Kanetoshi et al. (1992), which applied [3H] triclosan to mouse skin, detected maximum systemic levels between 12 and 18 h postexposure, with the greatest concentration in the gall bladder, liver, body fat, lungs, kidneys, blood, heart, testes, spleen, and brain. The concentrations of triclosan in consumer products range from 0.1 to 1%, which is similar to concentrations tested in the studies described in this article (Fang et al., 2010). While concentrations up to 3% were tested in these studies for hazard identification purposes, significant effects on eosinophil numbers and pulmonary function occurred even at the lowest concentration tested (0.75%), further supporting the potential for adverse effects at biologically relevant concentrations.
Other endocrine-disrupting chemicals such as phthalates, pesticides, and perfluorinated compounds have been associated with allergic disease (Fairley et al., 2007; Kwak et al., 2009; White et al., 2011). Using the same OVA model of asthma, our lab previously found that dermal application of perfluorooctanonic acid simultaneously with exposure to OVA augments the allergic response to that allergen (Fairley et al., 2007). Other groups using animal models have reported similar adjuvant-like effects following phthalate exposure (Larsen and Nielsen, 2007). As reviewed by Chalubinski and Kowalski (2006), endocrine disruptors have been shown to modulate the immune system by impacting the T-helper cell Th1/Th2 balance and subsequently augmenting cytokine and antibody levels, which could cause alterations in allergic responses. With the interaction of the endocrine, nervous, and immune systems, it is likely that EDCs such as triclosan may induce multiple organ affects, and recent attention has focused on a role for them in the development of asthma and allergies. In the development of asthma, it has been demonstrated that danger signals from contaminating molecules or environmental exposures may be required for dendritic cell activation. Some allergens have intrinsic activating properties, whereas the experimental allergen OVA does not (Willart and Lambrecht, 2009). In these studies, using a well-established model, OVA was administered with the adjuvant Alum to induce murine asthma. Although the effects of triclosan on the allergic response to OVA independent of Alum were not explored in these studies, coexposure to triclosan in this model enhanced the allergic response over that observed with OVA and Alum alone.
A role for the innate immune system in asthma pathogenesis has been reported (Melvin and Ramanathan, 2012). For example, a role for toll-like receptors (TLR) in allergic airway inflammation has been described, and it has been shown that the amount of lipopolysaccharide (LPS) present during sensitization can determine whether Th1 or Th2 immunity is observed (Eisenbarth et al., 2002). Numerous studies have described effects of triclosan on the innate immune system. In vitro studies highlighting the potential anti-inflammatory effect of triclosan have demonstrated the inhibition of LPS-stimulated expression of TLR signaling molecules, proinflammatory mediators, and the dampening of the Th1 cell immune response activation by CD70 suppression (Barros et al., 2010; Mustafa et al., 2000). The inhibition and suppression of Th1 cytokines such as IFN-γ have been demonstrated to enhance Th2 immunity (Williams et al., 2012). Although LPS stimulation was not used in the present asthma model, the findings mentioned above support the notion that triclosan exposure is capable of augmenting immune responses by potentially regulating danger signals required for immune activation, which could result in polarization to a Th2 immune response.
Further support for triclosan acting early in the development of sensitization is suggested by experiments conducted by Palmer et al. (2012) who demonstrated reduced degranulation of an IgE-sensitized mucosal mast cell line (RBL-2H3) following triclosan exposure. These findings support the previous findings that mechanism behind the adjuvant-like effects observed for triclosan may occur in the early microenvironment prior to or during the sensitization process.
Additional studies focusing on identifying a potential biological target have demonstrated that triclosan significantly enhanced the binding of [3H] ryanodine to the ryanodine (RyR1) receptor, resulting in an increase in cytosolic calcium levels in a calcium signaling bioassay screen (Ahn et al., 2008). The RyR1 receptor is expressed on numerous cell types including B lymphocytes and dendritic cells (Bracci et al., 2007; Vukcevic et al., 2008). In addition to elevating intracellular calcium stores, studies conducted by Vukcevic et al. (2008) found that RyR1 activation also caused a very rapid increase in the expression of major histocompatibility complex class II molecules on the surface of dendritic cells, suggesting that activation of the RyR1 signaling cascade may be critical in early immunity. Concomitant activation of ryanodine receptor–induced calcium release together with the activation of TLR provided synergistic signals, resulting in dendritic cell maturation and stimulation of T-cell functions (Bracci et al., 2007). These types of early signaling events are instrumental in the development of the adaptive immune response, and the presence of chemicals such as triclosan may amplify signals in the presence of allergens, thereby augmenting allergic responses. Increases in calcium levels have been shown to regulate many immune pathways. A related study found that increases in calcium levels via the 1,4,5-trisphosphate receptor, which is similar to the RyR1 receptor, were found to augment the asthma hallmark of airway hyperresponsiveness in rat airway smooth muscle cells (Tao et al., 2000). Although we do not know the exact mechanism of action for triclosan, it is hypothesized that augmentations in intracellular signaling events resulting in alternations in cytokine expression may be responsible for enhanced Th2 polarization.
In summary, triclosan was identified as a nonsensitizing chemical capable of augmenting the allergic response to a known allergen. Given the widespread use of this chemical, there is concern for its possible contribution to the rising incidence of allergic disease. Consistent with epidemiologic studies associating urinary triclosan levels and allergy, repeated dermal exposure to triclosan enhanced AHR, IgE, lung eosinophilic infiltration, and enhanced IL-13 cytokine production in a mouse model of asthma. This is the first animal study to associate triclosan with allergic disease. These results in addition to its high production volume, widespread applications, and endocrine-disrupting effects encourage additional investigations and increased awareness about triclosan exposure.
Supplementary Material
Acknowledgments
Special thanks to Jodi Richardson and Carrie Long for their technical assistance. The findings and conclusion in this report are those of the authors and do not necessarily represent the official position of the National Institute for Occupational Safety and Health.
Funding: This work was supported by internal funds from the Health Effects Laboratory Division.
Footnotes
Supplementary Data: Supplementary data are available online at http://toxsci.oxfordjournals.org/.
References
- Adolfsson-Erici M, Pettersson M, Parkkonen J, Sturve J. Triclosan, a commonly used bactericide found in human milk and in the aquatic environment in Sweden. Chemosphere. 2002;46:1485–1489. doi: 10.1016/s0045-6535(01)00255-7. [DOI] [PubMed] [Google Scholar]
- Ahn KC, Zhao B, Chen J, Cherednichenko G, Sanmarti E, Denison MS, Lasley B, Pessah IN, Kültz D, Chang DP, et al. In vitro biologic activities of the antimicrobials triclocarban, its analogs, and triclosan in bioassay screens: Receptor-based bioassay screens. Environ Health Perspect. 2008;116:1203–1210. doi: 10.1289/ehp.11200. [DOI] [PMC free article] [PubMed] [Google Scholar]
- Barros SP, Wirojchanasak S, Barrow DA, Panagakos FS, Devizio W, Offenbacher S. Triclosan inhibition of acute and chronic inflammatory gene pathways. J Clin Periodontol. 2010;37:412–418. doi: 10.1111/j.1600-051X.2010.01548.x. [DOI] [PubMed] [Google Scholar]
- Black JG, Howes D, Rutherford T. Percutaneous absorption and metabolism of Irgasan DP300. Toxicology. 1975;3:33–47. doi: 10.1016/0300-483x(75)90006-2. [DOI] [PubMed] [Google Scholar]
- Bracci L, Vukcevic M, Spagnoli G, Ducreux S, Zorzato F, Treves S. Ca2+ signaling through ryanodine receptor 1 enhances maturation and activation of human dendritic cells. J Cell Sci. 2007;120(Pt 13):2232–2240. doi: 10.1242/jcs.007203. [DOI] [PubMed] [Google Scholar]
- Calafat AM, Ye X, Wong LY, Reidy JA, Needham LL. Urinary concentrations of triclosan in the U.S. population: 2003-2004. Environ Health Perspect. 2008;116:303–307. doi: 10.1289/ehp.10768. [DOI] [PMC free article] [PubMed] [Google Scholar]
- Chalubinski M, Kowalski ML. Endocrine disrupters—Potential modulators of the immune system and allergic response. Allergy. 2006;61:1326–1335. doi: 10.1111/j.1398-9995.2006.01135.x. [DOI] [PubMed] [Google Scholar]
- Clayton EM, Todd M, Dowd JB, Aiello AE. The impact of bisphenol A and triclosan on immune parameters in the U.S. population, NHANES 2003-2006. Environ Health Perspect. 2011;119:390–396. doi: 10.1289/ehp.1002883. [DOI] [PMC free article] [PubMed] [Google Scholar]
- DeSalva SJ, Kong BM, Lin YJ. Triclosan: A safety profile. Am J Dent. 1989;2(Spec No):185–196. [PubMed] [Google Scholar]
- Diamanti-Kandarakis E, Bourguignon JP, Giudice LC, Hauser R, Prins GS, Soto AM, Zoeller RT, Gore AC. Endocrine-disrupting chemicals: An Endocrine Society scientific statement. Endocr Rev. 2009;30:293–342. doi: 10.1210/er.2009-0002. [DOI] [PMC free article] [PubMed] [Google Scholar]
- Eisenbarth SC, Piggott DA, Huleatt JW, Visintin I, Herrick CA, Bottomly K. Lipopolysaccharide-enhanced, toll-like receptor 4-dependent T helper cell type 2 responses to inhaled antigen. J Exp Med. 2002;196:1645–1651. doi: 10.1084/jem.20021340. [DOI] [PMC free article] [PubMed] [Google Scholar]
- Fairley KJ, Purdy R, Kearns S, Anderson SE, Meade BJ. Exposure to the immunosuppressant, perfuorooctanoic acid, enhances the murine IgE and airway hyperreactivity response to ovalbumin. Toxicol Sci. 2007;97:375–383. doi: 10.1093/toxsci/kfm053. [DOI] [PubMed] [Google Scholar]
- Fang JL, Stingley RL, Beland FA, Harrouk W, Lumpkins DL, Howard P. Occurrence, efficacy, metabolism, and toxicity of triclosan. J Environ Sci Health C Environ Carcinog Ecotoxicol Rev. 2010;28:147–171. doi: 10.1080/10590501.2010.504978. [DOI] [PubMed] [Google Scholar]
- FDA. Triclosan: Supporting Information for Toxicological Evaluation by the National Toxicology Program. U.S. Food and Drug Administration, Department of Health and Human Services; Silver Spring, MD: 2008. [Google Scholar]
- Foran CM, Bennett ER, Benson WH. Developmental evaluation of a potential non-steroidal estrogen: Triclosan. Mar Environ Res. 2000;50:153–156. doi: 10.1016/s0141-1136(00)00080-5. [DOI] [PubMed] [Google Scholar]
- Gee RH, Charles A, Taylor N, Darbre PD. Oestrogenic and androgenic activity of triclosan in breast cancer cells. J Appl Toxicol. 2008;28:78–91. doi: 10.1002/jat.1316. [DOI] [PubMed] [Google Scholar]
- Glaser A. The ubiquitous triclosan: A common antibacterial agent exposed. [Accessed November 5, 2012];Pestic You. 2004 24:12–17. Available at: http://www.beyondpesticides.org/pesticides/factsheets/Triclosan%20cited.pdf. [Google Scholar]
- Gunsolley JC. A meta-analysis of six-month studies of antiplaque and antigingivitis agents. J Am Dent Assoc. 2006;137:1649–1657. doi: 10.14219/jada.archive.2006.0110. [DOI] [PubMed] [Google Scholar]
- Hubbs AF, Goldsmith WT, Kashon ML, Frazer D, Mercer RR, Battelli LA, Kullman GJ, Schwegler-Berry D, Friend S, Castranova V. Respiratory toxicologic pathology of inhaled diacetyl in sprague-dawley rats. Toxicol Pathol. 2008;36:330–344. doi: 10.1177/0192623307312694. [DOI] [PubMed] [Google Scholar]
- Jones RD, Jampani HB, Newman JL, Lee AS. Triclosan: A review of effectiveness and safety in health care settings. Am J Infect Control. 2000;28:184–196. [PubMed] [Google Scholar]
- Kanetoshi A, Katsura E, Ogawa H, Ohyama T, Kaneshima H, Miura T. Acute toxicity, percutaneous absorption and effects on hepatic mixed function oxidase activities of 2,4,4′-trichloro-2′-hydroxydiphenyl ether (Irgasan DP300) and its chlorinated derivatives. Arch Environ Contam Toxicol. 1992;23:91–98. doi: 10.1007/BF00226000. [DOI] [PubMed] [Google Scholar]
- Kligman AM, Epstein W. Updating the maximization test for identifying contact allergens. Contact Derm. 1975;1:231–239. doi: 10.1111/j.1600-0536.1975.tb05389.x. [DOI] [PubMed] [Google Scholar]
- Kolpin DW, Furlong ET, Meyer MT, Thurman EM, Zaugg SD, Barber LB, Buxton HT. Pharmaceuticals, hormones, and other organic wastewater contaminants in U.S. streams, 1999-2000: A national reconnaissance. Environ Sci Technol. 2002;36:1202–1211. doi: 10.1021/es011055j. [DOI] [PubMed] [Google Scholar]
- Kwak ES, Just A, Whyatt R, Miller RL. Phthalates, pesticides, and bisphenol-A exposure and the development of nonoccupational asthma and allergies: How valid are the links? Open Allergy J. 2009;2:45–50. doi: 10.2174/1874838400902010045. [DOI] [PMC free article] [PubMed] [Google Scholar]
- Larsen ST, Nielsen GD. The adjuvant effect of di-(2-ethyl-hexyl) phthalate is mediated through a PPARalpha-independent mechanism. Toxicol Lett. 2007;170:223–228. doi: 10.1016/j.toxlet.2007.03.009. [DOI] [PubMed] [Google Scholar]
- Lindström A, Buerge IJ, Poiger T, Bergqvist PA, Müller MD, Buser HR. Occurrence and environmental behavior of the bactericide triclosan and its methyl derivative in surface waters and in waste-water. Environ Sci Technol. 2002;36:2322–2329. doi: 10.1021/es0114254. [DOI] [PubMed] [Google Scholar]
- Lyman FL, Furia T. Toxicology of 2, 4, 4′-trichloro-2′-hydroxy-diphenyl ether. IMS Ind Med Surg. 1969;38:64–71. [PubMed] [Google Scholar]
- Marzulli FN, Maiback HI. Antimicrobials: Experimental contact sensitization in man. J Soc Cosmet Chem. 1973;24:399–421. [Google Scholar]
- Melvin TA, Ramanathan M., Jr Role of innate immunity in the pathogenesis of allergic rhinitis. Curr Opin Otolaryngol Head Neck Surg. 2012;20:194–198. doi: 10.1097/MOO.0b013e3283533632. [DOI] [PubMed] [Google Scholar]
- Ming X, Nichols M, Rothenburger S. In vivo antibacterial efficacy of MONOCRYL plus antibacterial suture (Poliglecaprone 25 with triclosan) Surg Infect (Larchmt) 2007;8:209–214. doi: 10.1089/sur.2006.004. [DOI] [PubMed] [Google Scholar]
- Mustafa M, Bakhiet M, Wondimu B, Modéer T. Effect of triclosan on interferon-gamma production and major histocompatibility complex class II expression in human gingival fibroblasts. J Clin Periodontol. 2000;27:733–737. doi: 10.1034/j.1600-051x.2000.027010733.x. [DOI] [PubMed] [Google Scholar]
- Okada H, Kuhn C, Feillet H, Bach JF. The ‘hygiene hypothesis’ for autoimmune and allergic diseases: An update. Clin Exp Immunol. 2010;160:1–9. doi: 10.1111/j.1365-2249.2010.04139.x. [DOI] [PMC free article] [PubMed] [Google Scholar]
- Palmer RK, Hutchinson LM, Burpee BT, Tupper EJ, Pelletier JH, Kormendy Z, Hopke AR, Malay ET, Evans BL, Velez A, et al. Antibacterial agent triclosan suppresses RBL-2H3 mast cell function. Toxicol Appl Pharmacol. 2012;258:99–108. doi: 10.1016/j.taap.2011.10.012. [DOI] [PubMed] [Google Scholar]
- Paul KB, Hedge JM, Bansal R, Zoeller RT, Peter R, DeVito MJ, Crofton KM. Developmental triclosan exposure decreases maternal, fetal, and early neonatal thyroxine: A dynamic and kinetic evaluation of a putative mode-of-action. Toxicology. 2012;300:31–45. doi: 10.1016/j.tox.2012.05.023. [DOI] [PMC free article] [PubMed] [Google Scholar]
- Rao GV, Tinkle S, Weissman DN, Antonini JM, Kashon ML, Salmen R, Battelli LA, Willard PA, Hoover MD, Hubbs AF. Efficacy of a technique for exposing the mouse lung to particles aspirated from the pharynx. J Toxicol Environ Health Part A. 2003;66:1441–1452. doi: 10.1080/15287390306417. [DOI] [PubMed] [Google Scholar]
- Sandborgh-Englund G, Adolfsson-Erici M, Odham G, Ekstrand J. Pharmacokinetics of triclosan following oral ingestion in humans. J Toxicol Environ Health Part A. 2006;69:1861–1873. doi: 10.1080/15287390600631706. [DOI] [PubMed] [Google Scholar]
- Savage JH, Matsui EC, Wood RA, Keet CA. Urinary levels of triclosan and parabens are associated with aeroallergen and food sensitization. J Allergy Clin Immunol. 2012;130:453–460 e457. doi: 10.1016/j.jaci.2012.05.006. [DOI] [PMC free article] [PubMed] [Google Scholar]
- Savage L, Rose R, Wilkinson M. Airborne contact dermatitis to triclosan. Contact Derm. 2011;65:239–240. doi: 10.1111/j.1600-0536.2011.01934.x. [DOI] [PubMed] [Google Scholar]
- Steinkjer B, Braathen LR. Contact dermatitis from triclosan (Irgasan DP 300) Contact Derm. 1988;18:243–244. doi: 10.1111/j.1600-0536.1988.tb02815.x. [DOI] [PubMed] [Google Scholar]
- Stoker TE, Gibson EK, Zorrilla LM. Triclosan exposure modulates estrogen-dependent responses in the female Wistar rat. Toxicol Sci. 2010;117:45–53. doi: 10.1093/toxsci/kfq180. [DOI] [PubMed] [Google Scholar]
- Tan L, Nielsen NH, Young DC, Trizna Z. Use of antimicrobial agents in consumer products. Arch Dermatol. 2002;138:1082–1086. doi: 10.1001/archderm.138.8.1082. [DOI] [PubMed] [Google Scholar]
- Tao FC, Tolloczko B, Mitchell CA, Powell WS, Martin JG. Inositol (1,4,5)trisphosphate metabolism and enhanced calcium mobilization in airway smooth muscle of hyperresponsive rats. Am J Respir Cell Mol Biol. 2000;23:514–520. doi: 10.1165/ajrcmb.23.4.3966. [DOI] [PubMed] [Google Scholar]
- Vukcevic M, Spagnoli GC, Iezzi G, Zorzato F, Treves S. Ryanodine receptor activation by Ca v 1.2 is involved in dendritic cell major histocompatibility complex class II surface expression. J Biol Chem. 2008;283:34913–34922. doi: 10.1074/jbc.M804472200. [DOI] [PMC free article] [PubMed] [Google Scholar]
- White SS, Fenton SE, Hines EP. Endocrine disrupting properties of perfuorooctanoic acid. J Steroid Biochem Mol Biol. 2011;127:16–26. doi: 10.1016/j.jsbmb.2011.03.011. [DOI] [PMC free article] [PubMed] [Google Scholar]
- Willart MA, Lambrecht BN. The danger within: Endogenous danger signals, atopy and asthma. Clin Exp Allergy. 2009;39:12–19. doi: 10.1111/j.1365-2222.2008.03118.x. [DOI] [PubMed] [Google Scholar]
- Williams CM, Rahman S, Hubeau C, Ma HL. Cytokine pathways in allergic disease. Toxicol Pathol. 2012;40:205–215. doi: 10.1177/0192623311430694. [DOI] [PubMed] [Google Scholar]
Associated Data
This section collects any data citations, data availability statements, or supplementary materials included in this article.