

Abstract
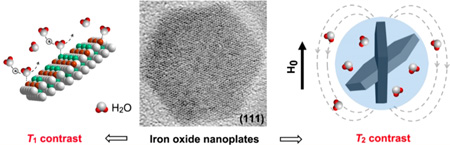
Iron oxide has been developed as either T1 or T2 magnetic resonance imaging (MRI) contrast agents by controlling the size and composition; however, the underlying mechanism of T1 and T2 contrasts in one iron oxide entity is still not well understood. Herein, we report that freestanding superparamagnetic magnetite nanoplates with (111) exposed facets have significant but interactional T1 and T2 contrast effects. We demonstrate that the main contribution of the T1 contrast of magnetic nanoplates is the chemical exchange on the iron-rich Fe3O4(111) surfaces, whereas the T2 relaxation is dominated by the intrinsic superparamagnetism of the nanoplates with an enhanced perturbation effect. We are able to regulate the balance of T1 and T2 contrasts by controlling structure and surface features, including morphology, exposed facets, and surface coating. This study provides an insightful understanding on the T1 and T2 contrast mechanisms, which is urgently needed to allow more sophisticated design of high-performance MRI contrast agents.
Keywords: T1 and T2 contrasts, magnetite nanoplates, Fe3O4(111), morphology
Graphical abstract
Iron oxide nanomaterials are among the most comprehensively studied magnetic platforms in magnetic resonance imaging (MRI) owing to their superior magnetic properties,1–5 which triggers a large number of versatile contrast agents for both longitudinal (T1) and transverse (T2)MRI contrasts. To achieve high-performance T1 and T2 MRI contrast agents, there is much interest in artificial control of the magnetic behaviors of iron oxide nanoparticles over the size, dopant, and crystal structure.6–10 Nevertheless, the morphology and surface structure of iron oxide nanomaterials were usually overlooked when accounting for their T1 and T2 contrast enhancements. Although the theory on metal complex-based contrast agents has been well-established over the past decades, the investigation on the relaxation mechanisms (especially T1 relaxation) of magnetic nanomaterial-based contrast agents is rare. Therefore, fundamental understanding of T1 relaxivity and the relationship of T1 and T2 contrast enhancements in nanomaterial-based contrast agents is urgently needed in the fast-growing MRI research community.
Paramagnetic compounds as T1 contrast agents are investigated by the Solomon, Bloembergen, and Morgan (SBM) theory.11,12 Their contrast efficiency was realized to be associated with the following key parameters during chemical exchange: the molecular tumbling time (τR), proton residence lifetime (τM), and the coordinating number (q) of water molecules (Figure 1a). Ideally, long τR, short τM, and large number q are expected for contrast agents to achieve efficient chemical exchange and strong T1 contrast effect.13,14 Despite the fact that nanosized iron oxide particles can show T1 shortening, probably due to the existence of iron on the particle surface, their T1 contrast is often negligible as compared with the generally strong T2 decay effect (Figure 1b). Generally speaking, these two relaxations rely on the kinetic/dynamic experiences and behaviors of protons surrounding the iron oxide nanomaterials. T1 contrast enhancement is mainly related to the innersphere regime that chemically exchanges with the paramagnetic centers directly, and T2 is mainly attributed to the proton's effective diffusion and interaction with the magnetic dipolar moment in the outersphere regime (Supporting Information Figure S1 and Note).2 However, T1 relaxation in the innersphere regime of iron oxide nanoparticles is barely exploited. Basically, there are two strategies to regulate T1 contrast effect in an iron oxide system: lowering T2 contribution and enhancing T1 contribution. The former has been achieved when the size of iron oxide nanoparticles is decreased to about 3 nm with typically paramagnetic rather than superparamagnetic behaviors.10,15 To enhance T1 contribution, one can fine-tune the surface structure of superparamagnetic iron oxide nanoparticles. As depicted in Figure 1c, a great number of exposed paramagnetic metals on an optimal flat surface of nanostructures with long tumbling time and large coordinating number may promise highly efficient chemical exchange. Together with intrinsic superparamagnetic properties, the optimized iron oxide nanostructures may have significantly strong T1 and T2 contrast abilities.
Figure 1.

Schematic illustrations of proton phenomena in magnetic systems relating to T1 and T2 relaxations. (a) Paramagnetic metal complex system and the selected key parameters to T1 relaxation of protons: molecular tumbling time (τR), proton residence lifetime (τM), and the coordinating water molecular number (q), while the magnetic gradient field around paramagnetic center is neglected. (b) Phenomena of proton interaction with a spherical magnetic nanoparticle system: water molecular diffusion and chemical exchange with surface magnetic metals, related to their T2 and T1 contrast enhancements, respectively. (c) Optimized magnetic nanoparticle with flattened metal-exposed surface and plate-shaped morphology, which may have significant effects on molecular diffusion and chemical exchange.
On the basis of these rationales, we report herein the superparamagnetic magnetite nanoplates with two exposed (111) basal planes possessing strong T1 and T2 contrast effects. These features are controlled by the interplay between the two contributions: one is the Feoct2-tet1-terminated Fe3O4(111) surface on the two planes that can greatly increase the interactions between surface paramagnetic metal ions and water protons in their vicinity, which mainly contributes to T1 contrast enhancement; the other is an intrinsically high magnetic moment with unique morphology that provides a strong local field in homogeneity and results in high T2 contrast enhancement. The unique surface structure and morphology of Fe3O4 nanoplates reveal the different factors that contribute to either T1 or T2 contrast in one nanoentity. Moreover, for the first time, we demonstrate the interplay mechanism of T1 and T2 contrast effects at molecular levels and successfully regulate the balance to display either T1 or T2 contrast (or even T1–T2 dual modal) by tuning their structural features.
RESULTS AND DISCUSSION
Synthesis and Characterization of Fe3O4 Nanoplates
The synthesis of various types of iron oxide nanostructures has been extensively explored.16–19 The formation of anisotropic magnetite nanoplates with controllable morphology and sizes is still challenging.20 We synthesized the freestanding magnetite nanoplates with two flattened hexagonal basal planes by thermal decomposition of iron oleate in the presence of oleic acid, sodium oleate, and benzyl ether. The edge length and thickness of iron oxide nanoplates can be tuned by the amount of sodium oleate in a reproducible way and can be made at large scale (detailed in Methods). The transmission electron microscopy (TEM) images (Figure 2a–c) show that the obtained hexagonal nanoplates are uniform with thicknesses of 8.8, 4.8, and 2.8 nm (denoted as IOP-8.8, IOP-4.8, and IOP-2.8, respectively). Their UV–vis spectra strongly confirmed the anisotropic morphology of nanoplates with three adsorption peaks at around 220, 330, and 480 nm, indicating different sizes at three dimensions (Figure S2). The X-ray diffraction patterns for the as-synthesized Fe3O4 samples reveal a typical face-centered cubic (fcc) magnetite structure (JCPDS 074-0748, Figure S3). The high-resolution TEM (HRTEM) images of perpendicular nanoplates (Figure 2a–c, insets) show the interplanar spacing distance of about 4.8 Å, and the flattened nanoplates (Figure 2d) reveal crossed lattice spacing distance of about 2.9 Å corresponding to (220) planes.20,21 These characteristics are consistent with the typical fast Fourier transform pattern (Figure S4), indicating the (111) basal planes of Fe3O4 nanoplates. We then studied the surface characteristics on (111) planes according to the Fe3O4 crystal structure. The previous calculations revealed that the energetically most favorable Feoct2-tet1-terminated (Figure 2e,f) and Fetet1-terminated (Figure S5) facets usually coexist on Fe3O4(111) surface,22,23 suggesting the presence of adequate magnetic metal ions with long order on the surface of Fe3O4 nanoplates.
Figure 2.

Characterizations of magnetite nanoplates and their MRI measurements. Representative TEM and HRTEM (insets) images of (a) 8.8 nm, (b) 4.8 nm, and (c) 2.8 nm thick nanoplates, with the lattice spacing distances of 4.8 Å from the perpendicular views of nanoplates suggesting (111) planes; scale bars = 50 nm (insets: 5 nm). (d) HRTEM image of a typical nanoplate with crossed lattice spacing distances of 2.9 Å, indicating (220) planes; scale bar = 5 nm. (e) Perspective view and (f) top views of the Feoct2-tet1-terminated (111) planes of the Fe3O4 structure, indicating the iron-rich characteristics.
The hysteresis curves indicate that the three Fe3O4 nanoplates exhibit typical superparamagnetic behaviors at 300 K and become soft ferromagnetic at 5 K (Figure 3a–c). Note that the samples for measurement were prepared as powder after multistep washing with ethanol and then treatment with a plasma cleaner. The magnetic saturation moments (Ms) of IOP-8.8, IOP-4.8, and IOP-2.8 are 74.1, 57.6, and 34.5 emu/g Fe3O4, suggesting a thickness-dependent crystallinity and size-dependent magnetism in these samples. The decline of Ms values with reduced thickness, especially for the IOP-2.8, is probably due to the spin-canting effect at the corner of the nanoplates (with a thickness of 0.5–0.9 nm) and the strong demagnetization effect.24–26 Additionally, the thermal dependence of magnetization curves of zero field cooling (ZFC) and field cooling (FC) also show expected differences in the blocking temperature (TB). The high TB at around 240 and 250 K for the IOP-8.8 and IOP-4.8, respectively, are in sharp contrast to 175 K for the IOP-2.8 (Figure 3d–f). These results demonstrate that the alignment of magnetic vectors in nanoplates is highly thickness-dependent, which is of great interest in the T2 relaxation study.
Figure 3.

Magnetic hysteresis (M–H) loops and zero field cooling and field cooling curves of nanoplates. The IOP-8.8 (a,d), IOP-4.8 (b,e), and IOP-2.8 (c,f) all indicate superparamagnetism at 300 K and ferromagnetism at 5 K (insets: magnification of M–H curves from −3000 to 3000 Oe). The ZFC–FC results show the blocking temperature for the 8.8, 4.8, and 2.8 nm thick nanoplates are around 240, 250, and 175 K, respectively. The M–H curves were measured at 300 and 5 K, and the thermal dependence magnetization curves were measured at an applied magnetic field of 50 Oe.
MRI Performance of Fe3O4 Nanoplates
To evaluate the MRI performance of the magnetic samples, we conducted the relaxivity and phantom studies on a 0.5 T MRI scanner (Figure 4a,b). The r1 and r2 values are employed to characterize the relaxivity efficacy of Fe3O4 nanoplates on longitudinal and transverse directions, respectively. Initially, we chose small molecule meso-2,3-dimercaptosuccinic acid (DMSA) as a thin layer modifying agent to endow the surface with effective water solubility and permeability.7 The IOP-8.8 shows an outstanding r2 value of 311.88 (7.47 mM−1 s−1 at 0.5 T (Figure 4a and Table S1), which is the highest among the three nanoplates (182.2 ± 7.73 mM−1 s−1 for IOP-4.8 and 78.63 ± 6.41 mM−1 s−1 for IOP-2.8). The large r2 value for the IOP-8.8 is mainly predominated by the high magnetic moment and the large efficient radius under the external magnetic field.9 More interestingly, there are exceptionally large r1 values in these unique superparamagnetic nanoplates. The IOP-8.8 and IOP-4.8 both show remarkably large r1 values of 38.11 ± 1.04 and 43.18 ± 3.33 mM−1 s−1 at 0.5 T, respectively (Figure 4a and Table S1), which are rarely reported in the superparamagnetic systems. Such large r1 values in superparamagnetic nanostructures are probably produced by the highly exposed iron centers on the particle surface, that is, the (111) surface of the Fe3O4 crystal. The decrease of r1 values from IOP-4.8 to IOP-8.8 can be ascribed to the ratio of (111) surface area to volume (0.47 for IOP-4.8 and 0.31 for IOP-8.8). To further confirm this assumption, we prepared the (111) enclosed Fe3O4 octahedral nanoparticles with a (111) surface to volume ratio of 0.28 (Figure S6).27 The r1 value of Fe3O4 octahedral nanoparticles is 21.67 (1.89 mM−1 s−1, which is lower than those of IOP-8.8 and IOP-4.8 with larger (111) surface to volume ratios. However, the r1 value of Fe3O4 octahedral nanoparticles is still much larger than those of spherical nanoparticles because of the metal-exposed (111) facets (Tables S2 and S3). This result further implies the critical role of the metal-exposed (111) surface for their T1 contrast ability. However, there is a significant reduction of r1 value (14.36 ± 1.24 mM−1 s−1) for the IOP-2.8, although with the highest (111) surface to volume ratio of 0.70, which is probably due to the spin-disorder at the corner of the ultrathin nanoplates. The disordered metal atoms at the spin-canted corners would lead to an ineffective coordinating and chemical exchanging process of protons, which decreases the number of effective exposed metal centers on the surface and weakens the T1 contrast ability. The spin-canting effect is often applied to explain the T1 contrast effect in small sized magnetic nanoparticles, whereas the mechanism is not well understood.10,28 It is of note that the spin-canting effect may not directly contribute to the T1 effect. The “released” T1 contrast effect in small-sized iron oxide nanomaterials is probably caused by the reduction of Ms and decreased r2/r1 ratio (Table S3 and Figure S9).
Figure 4.

MRI relaxivity and phantom study. (a) Columns to show the r1 and r2 values (0.5 T) of the three nanoplates, respectively. (b) T1 (left) and T2 (right) MRI phantom studies (0.5 T) of the IOP-8.8 (top), IOP-4.8 (middle), and IOP-2.8 (bottom) at different iron concentrations (mM) in 1% agarose. The capability of displaying T1 or T2 contrasts is denoted as ON for good contrast and OFF for poor contrast. (c) T1 NMRD profiles of the three nanoplates as the function of applied magnetic fields, measured by aqueous colloidal suspensions of each samples.
For the routine MR images, the r2/r1 ratio is an important reference to predict whether a given contrast agent has either T1- or T2-dominated MRI contrast. It was realized that high r2/r1 ratio (>8) results in T2-dominated contrast and the lower ratio (<5) leads to T1-dominated contrast.28,29 Our results also fit well with this trend and show that the IOP-8.8 (r2/r1 ~ 8.18) is a T2-dominated and the IOP-2.8 (r2/r1 ~ 5.47) is a T1-dominated contrast agent, while the IOP-4.8 with adequate T1 and T2* effects (r2/r1 ~ 4.22) is a T1–T2 dual-modal contrast agent. By tuning the thickness of the nanoplates, the T1–T2 MRI contrast abilities of IOP-8.8, IOP-4.8, and IOP-2.8 samples can be divided into OFF–ON,ON–ON, and ON–OFF types in a seesaw way (Figure 4b), respectively.
We also performed nuclear magnetic relaxation dispersion (NMRD) measurements for the three nanoplates to further characterize their relaxivity tendency as a function of applied magnetic fields (Figure 4c). At low fields (<1 MHz), the r1 value is virtually unchanged, which indicates a field-independent thermal equilibrium behavior for all the nanoplates.30 The peaks in the 1–2.5 MHz region for IOP-4.8 and IOP-2.8 are characteristic of a synergistic effect in the paramagnetic metal cluster colloids (the highly metal-exposed nanoplates in this case) because of the fluctuations of the dipolar magnetic coupling between nanocrystal magnetization and the proton spins.30,31 Afterward, the rapid drop in relaxivity with increasing magnetic fields extending to 40 MHz is probably dominated by the relatively slow tumbling features of nanomaterials.32,33 Finally, their r1 values reveal an over 10-fold decrease at the field up to 7 T (Figure S7 and Table S1).
Mechanism of T1 and T2 Contrast Enhancement Effects
The nanoplates with identified surface structure enable us to investigate the possible mechanisms of T1 contrast enhancement at a molecular level. Starting from the small molecule DMSA as a surface modifier, the large-area exposed iron-rich (111) facets of Fe3O4 nanoplates may greatly facilitate proton exchange on the surface, accelerating T1 relaxation (Figure 5a). In addition, the ordered metal atoms with distances of 2.9 Å on the surface would endow protons with great opportunities for further interaction with irons atom-by-atom when they are hopping away from the former irons.34,35 However, spherical iron oxide nanoparticles are usually polyhedral, and it is difficult to build a suitable surface model because the spin-canting effect would cause a randomly distributed magnetic spin-order on their surface. For comparison, we synthesized various spherical iron oxide nanoparticles with different sizes by the thermal decomposition method (Figures S8 and S9) and coated with DMSA to achieve similar surface modification. The iron oxide spheres with diameters of 26, 21, and 16 nm (denoted as IO-26, IO-21, and IO-16, respectively) have equivalent whole surface areas to IOP-8.8 (~2398 nm2), IOP-4.8 (~1421 nm2), and IOP-2.8 (~624 nm2), respectively (Table S2). The r1 values of IO-26 (16.49 ± 2.87mM−1 s−1), IO-21 (11.73 ± 0.24 mM−1 s−1), and IO-16 (7.67 ± 1.05 mM−1 s−1) are much lower than those of corresponding nanoplates (Figure 5b), suggesting that there are much fewer exposed irons on the surface of spherical particles. This result indicates that the highly exposed iron ions (e.g., the (111) facets) on the surface of nanoplates play key roles in their T1 contrast effects.36 It should be noted that T1 relaxation enhancement is also observed in other metal-exposed facets, such as Fe3O4(100) facet enclosed IO cubes and Fe3O4(311) facet composed IO octapods (Figure S10). It is noteworthy that the r1 values of spherical iron oxide nanoparticles are generally increased with the increase of diameters from 3 to 26 nm (Table S3). Considering that the spin-canting effect in spherical iron oxide nanoparticles decreases with their sizes,24 this observation provides strong evidence for a weakening of the T1 relaxation by the spin-canting effect in iron oxide nanoparticles.
Figure 5.

Fe3O4(111) nanoplates have great effects on water diffusion and chemical exchange. (a) Nanoplate with metal-rich (111) facets exposed on the surface facilitates water exchange in their vicinity (left), while the metals on the surface of the spherical nanoparticle are less and randomly distributed (right). (b) Relationships of T1 relaxivity with the (111) surface of the nanoplates, compared to spherical nanoparticles with equivalent whole surface areas. (c) Nanoplate is superior to spherical nanoparticles in terms of inducing local field inhomogeneity, rendering a larger effective radius (R) than the latter (r) when they are with equivalent solid volumes. The comparisons of (d) T2 relaxivity and (e) effective diameter of nanoplates and spheres to solid volume reveal that the nanoplates with larger effective radius have stronger T2 contrast effect than corresponding nanospheres. (f) Simulations of the induced magnetic field distribution of IOP-4.8, IOP-8.8, IO-16, and IO-21 at distances of 2 and 4 nm from the surface of nanomaterials under the field of 0.5 T.
The understanding of proton T2 relaxation is mainly predominated by the outersphere theory, which describes the diffusion phenomenon across the testing areas.37,38 Hence, the T2 relaxation is governed by local field inhomogeneity induced by magnetic nanoparticles. Following Hwang and Freed's theory,37 the r2 value is proportional to the square of two key parameters in highly magnetized nanomaterials: Ms value and effective radius of magnetic core (R). Basically, the Ms value determines the local magnetic field inhomogeneity induced by magnetic nanomaterials; on the other hand, the effective radius is responsible for the field perturbation areas for the outersphere protons. Because of the rapid random flipping of the nanomaterials in media, the nanoplates with anisotropic morphology are recognized as a simulated sphere (or ellipse) determined by their edge lengths (Figure 5c), the effective radius R of a nanoplate is much larger than that of a sphere with similar solid volume (Table S4). The IO-21, IO-16, and IO-10 nanospheres have equivalent solid volumes to those of IOP-8.8 (~4841 nm3), IOP-4.8 (~2137 nm3), and IOP-2.8 (~511 nm3), respectively. However, their r2 values (IO-21, 232.16 ± 4.91; IO-16, 118.83 ± 4.07; and IO-10, 59.38 ± 5.34 mM−1 s−1) are much lower than those of corresponding nanoplates (Figure 5d), which may be ascribed to the larger effective diameters of nanoplates (Figure 5e). Moreover, the nanoplates are considered to be able to generate a larger area of local field inhomogeneity compared with nanospheres under an applied magnetic field. We used the Landau–Lifshitz–Gilbert equation to calculate the differences of the field inhomogeneity induced by magnetic nanomaterials under the magnetic field.39 The simulated results show a significantly stronger local field inhomogeneity for the nanoplates (e.g., IOP-4.8 and IOP-8.8) than the corresponding spheres (e.g., IO-16 and IO-21) at distances of 2 and 4 nm from their surfaces (Figure 5f, Figure S11, and Tables S5 and S6). These results provide direct evidence that iron oxide nanoplates could further increase the r2 values by the excellent field perturbation ability due to the unique morphology. The magnitude phase gradient mapping of the nanoplates also reveals obviously thickness-dependent signal loss phenomena (Figure S12), indicating the essential role of the inhomogeneous magnetic field gradient for the T2 contrast enhancement. Because of possible differences for shaped nanoplates that interact with biological cells,40,41 we did the preliminary study to test cell viability (3-(4,5-dimethylthiazol-2-y1)-2,5-diphenyl tetrazolium bromide, MTT assay) of the three nanoplates using two different cell lines (SMMC-7721 and Huh-7). The results show little toxicity for nanoplates to both cells with cell viability >90% at a maximum concentration of 85 µg Fe/mL (Figure S13), indicating that the nanoplates are biocompatible within biologically acceptable concentrations. The more extensive study on the cell interaction and response to IO nanoplates is needed in the future to systematically evaluate biosafety issues of the nanoplates.
Surface Blocking and Particle Clustering
To further identify the T1 and T2 relaxation contributions, we emphasized the surface coating effect on their T1 and T2 relaxivities of the nanoplates. The small DMSA molecules on nanoplates can provide a free and permeable environment for the surrounding protons to exchange and interact with the surface metals (Figure 6a). On the contrary, silica coating may produce a partially permeable shell on the surface of nanoplates depending on the silica thickness,42,43 which may have a significant impact on the exchange path between protons and surface metals (Figure 6b). The nanoplates were coated with an approximately 8 nm thick silica shell by an inverse-micelle method (Figure S14). After the silica coating, the r1 values of three nanoplate samples reveal a dramatic drop to the level of about 2 mM−1 s−1 (Figure 6c); on the other hand, the r2 values of IOP-2.8, IOP-4.8, and IOP-8.8 were reduced to 59.38 ± 6.34, 118.73 ± 8.07, and 232.16 ± 7.91 mM−1 s−1, respectively (Figure 6d). The remnant but extremely small T1 relaxivity is reasonably attributed to (i) the partially permeable part of the silica layer that causes inevitable water permeation to the surface of the nanoplates43 and (ii) the existence of outersphere translational diffusion of protons, which was described by Freed et al.44 and was also noticed in molecular contrast agents.45 This result suggests that the water-permeable surface coating on magnetic nanomaterials is extremely important for strong interactions of surrounding protons and surface metals, which results in large T1 relaxivity. The decrease of the r2 values of nanoplates with a silica shell may be caused by the hindrance of the shell to the proton diffusion in the outersphere region.
Figure 6.

Effects of silica coating and particle clustering on the T1 and T2 relaxations of nanoplates. (a) Small molecule DMSA-coated nanoplates (right, TEM image, scale bar = 50 nm), showing permeable water penetration and facile chemical exchange on the surface. (b) Nanoplates coated with a dense SiO2 layer (right, TEM image, scale bar = 50 nm), resulting in an inefficient permeability for surrounding water. Columns to show the changes of (c) r1 and (d) r2 values of the three nanoplates (orange, IOP-2.8; blue, IOP-4.8; green, IOP-8.8) before and after SiO2 coating, respectively. (e) Lamellar assembly of IOP-4.8 nanoplates by amphiphilic stearic acid–polyetherimide (stPEI) coating (right, TEM image, scale bar = 50 nm). (f) Changes of r1 (left) and r2 (right) values of IOP-4.8 before and after stPEI coating, showing the significant r1 decrease and r2 increase by particle clustering effect.
Moreover, we used IOP-4.8 as an example to investigate the clustering effect on the T1 and T2 relaxivities. Upon the amphiphilic stearic acid–polyetherimide (stPEI) coating, the lamellar assembly of nanoplates led to a spherical-shaped nanostructure with face-to-face stacking (Figure 6e). The obtained IOP-4.8@stPEI nanostructures have diameters of about 60 nm in the TEM images and hydrodynamic sizes of about 90 nm in aqueous solution (Figure S15). As expected, the T2 relaxivity of the IOP-4.8@stPEI sample increases to 338.9 ± 6.97 mM−1 s−1 probably because the agglomeration may produce stronger dipolar fields than the individual nanoplates,46–48 while the decrease and blocking of (111) exposed surfaces in the compact nanostructures resulted in a significant drop of T1 relaxivity, from 43.18 ± 3.33 to 3.59 ± 1.01 mM−1 s−1 (Figure 6f). These results further confirm the significant role of the metal-exposed surface to the T1 contrast enhancement effect of magnetic nanomaterials. Besides, the interfacial environment of nanomaterials may also influence the exchange and interaction of surrounding water protons with the magnetic metal ions on the surface, which are also crucial to the T1 and T2 contrast effects.
CONCLUSIONS
Owing to their unique morphology and surface structure, freestanding superparamagnetic magnetite nanoplates with tunable thickness exhibit excellent and interactional contributions in T1 and T2 relaxations. We demonstrated that the morphological anisotropy of nanoplates with enlarged efficient radius is the main reason for their enhanced T2 contrast ability, and the strong T1 contrast enhancement of nanoplates is due to their large-area exposed iron-rich Fe3O4(111) facets for efficient chemical exchanges. We believe that the investigation on the T1 relaxivity of superparamagnetic nanostructures at the molecular level is highly significant for the MRI research field. This work may shed new light on the basic understanding of the T1 and T2 contrast enhancement effects in magnetic nanoparticle systems and open up new venues to rationally design high-performance MRI contrast agents for biomedical applications.
METHODS
Synthesis of Fe3O4 Nanoplates with Tunable Thickness
A straight-forward synthetic route to IOP-8.8 is as follows: 0.9 g (1 mmol) of iron oleate complex was dissolved in 10mL of benzyl ether, with the addition of 0.16 mL (0.5 mmol) of oleic acid and 15 mg (0.05 mmol) of sodium oleate. The solution was kept at 120 °C for 20 min before reaching reflux and was allowed to react for 1 h before cooling to room temperature. The products were obtained by addition of 50 mL of ethanol and centrifugation at 7000 rpm for 10 min. After being washed with ethanol twice, the precipitate was dispersed in hexane and stored for further use. The preparation of IOP-4.8 and IOP-2.8 is similar to the above procedure except for the quantity of sodium oleate (0.1 and 0.2 mmol, respectively).
Synthesis of Fe3O4 Octahedral Nanoparticles
The synthesis of Fe3O4 octahedral nanoparticles was followed by a modified procedure. Briefly, iron oleate (1 mmol), oleic aicd (0.5 mmol), sodium chloride (60 mg), and distilled water (60 µL) were mixed with 1-octadecene (20 mL) into a three-neck flask. The system was degassed with nitrogen, heated to 100 °C, and maintained for 20 min. Subsequently, the solution was heated to reflux for 30 min before cooling to room temperature with a constant heat rate of ~5 °C per min. The black precipitation was obtained by centrifugation after addition of isopropyl. The as-prepared products were finally dispersed in hexane for further use.
DMSA Modification Strategy
The preparation of DMSA-coated nanoparticles was carried out through a ligand exchange process.7 For example, excess DMSA (10 mg) was dissolved in 10 mL of ultrapure water in a three-neck flask, and the as-prepared iron oxide nanoparticles (100 µmol) dissolved in hexane were added to the flask. The solution was then heated to reflux for 2 h before cooling to room temperature. The nanoparticles were obtained at down-layer, suggesting the successful DMSA coating. The obtained water-soluble nanoparticles were stored at 4 °C.
Silica Coating
In a typical experiment, 2 mL of iron oxide nanoplates (0.6 mg/mL) was added with 1.2 mL of Co-520, 0.2 mL of tetraethyl orthosilicate, 0.4 mL of ammonia, and 20 mL of cyclohexane. After being stirred for 16 h at room temperature, the solution was mixed with 40 mL of ethanol and washed three times by centrifugation (14 000 rpm, 15 min). The silicacoated nanoplates (IOP@SiO2) were dissolved in ultrapure water and stored at 4 °C.
StPEI Coating Method
For the preparation of stPEI-coated nanoplates, 5 mg of stPEI was mixed with the as-prepared IO-4.8 (10 mg) in chloroform (2 mL). The organic solution was slowly added into ultrapure water (4 mL) under vigorous sonication, and the mixture was further shaken overnight to obtain transparent solution. The residual chloroform was removed by rotary evaporation, and the final aqueous solution was stored at 4 °C for further use.
MRI Relaxivity Study
The phantom study of MRI samples was prepared in 1% agar with the Fe concentrations ranges of 400, 200, 100, 50, and 25 µM, and with water at 0 µMfor comparison. The samples for the three-sized iron oxide nanoplates and the six-sized spherical iron oxide nanoparticles were prepared three times (n = 3) and measured separately. The T1 and T2 relaxation times for all the samples were measured (at 305 K) with a 0.5 T MRI scanner and used to calculate the relaxation rates of the samples. The T2-weighted and T1-weighted MR images for all the samples were acquired using the MSE sequence under the following parameters: TR/TE = 2000/60 ms (T2), TR/TE = 100/12 ms (T1), 128 × 256 matrices, repetition times = 4.
Calculation of the Induced Magnetic Fields around the Iron Oxide Nanoparticles
A 3D numerical modeling was carried out by solving the Landau–Lifshitz–Gilbert (LLG) equation, which is a powerful tool for studying the magnetization process on nanoscopic magnets. We set the external static field at 0.5 T as in the MRI studies; the exchange stiffness constant A = 1.0 × 10⁻⁶ erg/cm; Gilbert damping constant is 1.0; and the unit cell dimensions are 1 nm × 1 nm × 1 nm. The magnetic field data from LLG was obtained with Matlab to show the magnetic field distribution outside the nanoplates (IOP-8.8 and IOP-4.8) or spherical (IO-21 and IO-16) nanoparticles. We then calculated the intensity of stray field at various distances from the surface induced by iron oxide nanoplates and spherical nanoparticles.
Supplementary Material
Acknowledgment
This work was supported by the National Key Basic Research Program of China (2013CB933901, 2014CB744502, and 2014CB932004), National Natural Science Foundation of China (21222106, 81370042, and 81000662), Natural Science Foundation of Fujian (2013J06005), IRT13036, Fok Ying Tung Education Foundation (142012), and Program for New Century Excellent Talents in University (NCET-10-0709). We thank Dennis W. Hwang and Y.W. Chen for NMRD measurements, and E. Meggers, L.S. Zheng, and C.B. Cai for the fruitful discussions.
Footnotes
Conflict of Interest: The authors declare no competing financial interest.
Supporting Information Available: UV–vis, XRD, SAED, magnetic properties, surface atomic structure, phase mapping, TEM of silica and stPEI coating, DLS analysis, MRI relaxivity, and TEM images. This material is available free of charge via the Internet at http://pubs.acs.org.
REFERENCES AND NOTES
- 1.Colombo M, Carregal-Romero S, Casula MF, Gutiérrez L, Morales MP, Böhm IB, Heverhagen JT, Prosperi D, Parak WJ. Biological Applications of Magnetic Nanoparticles. Chem. Soc. Rev. 2012;41:4306–4334. doi: 10.1039/c2cs15337h. [DOI] [PubMed] [Google Scholar]
- 2.Laurent S, Forge D, Port M, Roch A, Robic C, Vander Elst L, Muller RN. Magnetic Iron Oxide Nanoparticles: Synthesis, Stabilization, Vectorization, Physicochemical Characterizations, and Biological Applications. Chem. Rev. 2008;108:2064–2110. doi: 10.1021/cr068445e. [DOI] [PubMed] [Google Scholar]
- 3.Lee N, Hyeon T. Designed Synthesis of Uniformly Sized Iron Oxide Nanoparticles for Efficient Magnetic Resonance Imaging Contrast Agents. Chem. Soc. Rev. 2012;41:2575–2579. doi: 10.1039/c1cs15248c. [DOI] [PubMed] [Google Scholar]
- 4.Gao JH, Gu HW, Xu B. Multifunctional Magnetic Nanoparticles: Design, Synthesis, and Biomedical Applications. Acc. Chem. Res. 2009;42:1097–1107. doi: 10.1021/ar9000026. [DOI] [PubMed] [Google Scholar]
- 5.Reddy LH, Arias JL, Nicolas J, Couvreur P. Magnetic Nanoparticles: Design and Characterization, Toxicity and Biocompatibility, Pharmaceutical and Biomedical Applications. Chem. Rev. 2012;112:5818–5878. doi: 10.1021/cr300068p. [DOI] [PubMed] [Google Scholar]
- 6.Lee JH, Huh YM, Jun Y-w, Seo J-w, Jang J-t, Song H-T, Kim S, Cho E-J, Yoon H-G, Suh J-S, et al. Artificially Engineered Magnetic Nanoparticles for Ultrasensitive Molecular Imaging. Nat. Med. 2006;13:95–99. doi: 10.1038/nm1467. [DOI] [PubMed] [Google Scholar]
- 7.Jun Y-w, Huh Y-M, Choi J-s, Lee J-H, Song H-T, Kim S, Yoon S, Kim K-S, Shin J-S, Suh J-S, et al. Nanoscale Size Effect of Magnetic Nanocrystals and Their Utilization for Cancer Diagnosis via Magnetic Resonance Imaging. J. Am. Chem. Soc. 2005;127:5732–5733. doi: 10.1021/ja0422155. [DOI] [PubMed] [Google Scholar]
- 8.Zhou ZJ, Huang DT, Bao JF, Chen QL, Liu G, Chen Z, Chen XY, Gao JH. A Synergistically Enhanced T1 – T2 Dual-Modal Contrast Agent. Adv. Mater. 2012;24:6223–6228. doi: 10.1002/adma.201203169. [DOI] [PMC free article] [PubMed] [Google Scholar]
- 9.Zhao ZH, Zhou Z, Bao J, Wang Z, Hu J, Chi X, Ni K, Wang R, Chen X, Chen Z, et al. Octapod Iron Oxide Nanoparticles as High-Performance T2 Contrast Agents for Magnetic Resonance Imaging. Nat. Commun. 2013;4:2266. doi: 10.1038/ncomms3266. [DOI] [PubMed] [Google Scholar]
- 10.Kim BH, Lee N, Kim H, An K, Park YI, Choi Y, Shin K, Lee Y, Kwon SG, Na HB, et al. Large-Scale Synthesis of Uniform and Extremely Small-Sized Iron Oxide Nanoparticles for High-Resolution T1 Magnetic Resonance Imaging Contrast Agents. J. Am. Chem. Soc. 2011;133:12624–12631. doi: 10.1021/ja203340u. [DOI] [PubMed] [Google Scholar]
- 11.Bloembergen N, Morgan LO. Proton Relaxation Times in Paramagnetic Solutions. Effects of Electron Spin Relaxation. J. Chem. Phys. 1961;34:842–850. [Google Scholar]
- 12.Solomon I. Relaxation Processes in a System of Two Spins. Phys. Rev. 1955;99:559–565. [Google Scholar]
- 13.Werner EJ, Datta A, Jocher CJ, Raymond KN. High-Relaxivity MRI Contrast Agents: Where Coordination Chemistry Meets Medical Imaging. Angew. Chem. Int. Ed. 2008;47:8568–8580. doi: 10.1002/anie.200800212. [DOI] [PubMed] [Google Scholar]
- 14.Ananta JS, Godin B, Sethi R, Moriggi L, Liu X, Serda RE, Krishnamurthy R, Muthupillai R, Bolskar RD, Helm L, et al. Geometrical Confinement of Gadolinium-Based Contrast Agents in Nanoporous Particles Enhances T1 Contrast. Nat. Nanotechnol. 2010;5:815–821. doi: 10.1038/nnano.2010.203. [DOI] [PMC free article] [PubMed] [Google Scholar]
- 15.Li Z, Yi PW, Sun Q, Lei H, Li Zhao H, Zhu ZH, Smith SC, Lan MB, Lu GQ. Ultrasmall Water-Soluble and Biocompatible Magnetic Iron Oxide Nanoparticles as Positive and Negative Dual Contrast Agents. Adv. Funct. Mater. 2012;22:2387–2393. [Google Scholar]
- 16.Cheon J, Kang N-J, Lee S-M, Lee J-H, Yoon J-H, Oh SJ. Shape Evolution of Single-Crystalline Iron Oxide Nanocrystals. J. Am. Chem. Soc. 2004;126:1950–1951. doi: 10.1021/ja038722o. [DOI] [PubMed] [Google Scholar]
- 17.Niederberger M, Krumeich F, Hegetschweiler K, Nesper R. An Iron Polyolate Complex as a Precursor for the Controlled Synthesis of Monodispersed Iron Oxide Colloids. Chem. Mater. 2001;14:78–82. [Google Scholar]
- 18.Kim D, Lee N, Park M, Kim BH, An K, Hyeon T. Synthesis of Uniform Ferrimagnetic Magnetite Nanocubes. J. Am. Chem. Soc. 2008;131:454–455. doi: 10.1021/ja8086906. [DOI] [PubMed] [Google Scholar]
- 19.Peng S, Sun S. Synthesis and Characterization of Monodisperse Hollow Fe3O4 Nanoparticles. Angew. Chem. Int. Ed. 2007;46:4155–4158. doi: 10.1002/anie.200700677. [DOI] [PubMed] [Google Scholar]
- 20.Lu J, Jiao X, Chen D, Li W. Solvothermal Synthesis and Characterization of Fe3O4 and γ-Fe2O3 Nanoplates. J. Phys. Chem. C. 2009;113:4012–4017. [Google Scholar]
- 21.Zeng Y, Hao R, Xing B, Hou Y, Xu Z. One-Pot Synthesis of Fe3O4 Nanoprisms with Controlled Electrochemical Properties. Chem. Commun. 2010;46:3920–3922. doi: 10.1039/c0cc00246a. [DOI] [PubMed] [Google Scholar]
- 22.Ahdjoudj J, Martinsky C, Minot C, Van Hove MA, Somorjai GA. Theoretical Study of the Termination of the Fe3O4(111) Surface. Surf. Sci. 1999;443:133–153. [Google Scholar]
- 23.Zhou C, Zhang Q, Chen L, Han B, Ni G, Wu J, Garg D, Cheng H. Density Functional Theory Study of Water Dissociative Chemisorption on the Fe3O4(111) Surface. J. Phys. Chem. C. 2010;114:21405–21410. [Google Scholar]
- 24.Linderoth S, Hendriksen PV, Bodker F, Wells S, Davies K, Charles SW, Morup S. On Spin-Canting in Maghemite Particles. J. Appl. Phys. 1994;75:6583–6585. [Google Scholar]
- 25.Noh S-h, Na W, Jang J-t, Lee J-H, Lee EJ, Moon SH, Lim Y, Shin J-S, Cheon J. Nanoscale Magnetism Control via Surface and Exchange Anisotropy for Optimized Ferri-magnetic Hysteresis. Nano Lett. 2012;12:3716–3721. doi: 10.1021/nl301499u. [DOI] [PubMed] [Google Scholar]
- 26.Baberschke K. Anisotropy in Magnetism. Berlin: Springer; 2001. [Google Scholar]
- 27.Zheng RK, Gu H, Xu B, Fung KK, Zhang XX, Ringer SP. Self-Assembly and Self-Orientation of Truncated Octahedral Magnetite Nanocrystals. Adv. Mater. 2006;18:2418–2421. [Google Scholar]
- 28.Zhou ZJ, Wang L, Chi X, Bao J, Yang L, Zhao W, Chen Z, Wang X, Chen X, Gao J. Engineered Iron-Oxide-Based Nanoparticles as Enhanced T1 Contrast Agents for Efficient Tumor Imaging. ACS Nano. 2013;7:3287–3296. doi: 10.1021/nn305991e. [DOI] [PMC free article] [PubMed] [Google Scholar]
- 29.Na HB, Song IC, Hyeon T. Inorganic Nanoparticles for MRI Contrast Agents. Adv. Mater. 2009;21:2133–2148. [Google Scholar]
- 30.Koenig SH, Kellar KE. Theory of 1/T1 and 1/T2 NMRD Profiles of Solutions of Magnetic Nanoparticles. Magn. Reson. Med. 1995;34:227–233. doi: 10.1002/mrm.1910340214. [DOI] [PubMed] [Google Scholar]
- 31.Burtea C, Laurent S, Elst L, Muller R. Contrast Agents: Magnetic Resonance. In: Semmler W, Schwaiger M, editors. Molecular Imaging I. 185/1. Berlin: Springer; 2008. pp. 135–165. [DOI] [PubMed] [Google Scholar]
- 32.Caravan P. Strategies for Increasing the Sensitivity of Gadolinium Based MRI Contrast Agents. Chem. Soc. Rev. 2006;35:512–523. doi: 10.1039/b510982p. [DOI] [PubMed] [Google Scholar]
- 33.Caravan P, Farrar CT, Frullano L, Uppal R. Influence of Molecular Parameters and Increasing Magnetic Field Strength on Relaxivity of Gadolinium- and Manganese-Based T1 Contrast Agents. Contrast Media Mol. Imaging. 2009;4:89–100. doi: 10.1002/cmmi.267. [DOI] [PMC free article] [PubMed] [Google Scholar]
- 34.Merte LR, Peng G, Bechstein R, Rieboldt F, Farberow CA, Grabow LC, Kudernatsch W, Wendt S, Lægsgaard E, Mavrikakis M, et al. Water-Mediated Proton Hopping on an Iron Oxide Surface. Science. 2012;336:889–893. doi: 10.1126/science.1219468. [DOI] [PubMed] [Google Scholar]
- 35.Joseph Y, Ranke W, Weiss W. Water on FeO(111) and Fe3O4(111): Adsorption Behavior on Different Surface Terminations. J. Phys. Chem. B. 2000;104:3224–3236. [Google Scholar]
- 36.Park JY, Baek MJ, Choi ES, Woo S, Kim JH, Kim TJ, Jung JC, Chae KS, Chang Y, Lee GH. Paramagnetic Ultrasmall Gadolinium Oxide Nanoparticles as Advanced T1 MRI Contrast Agent: Account for Large Longitudinal Relaxivity, Optimal Particle Diameter, and In Vivo T1 MR Images. ACS Nano. 2009;3:3663–3669. doi: 10.1021/nn900761s. [DOI] [PubMed] [Google Scholar]
- 37.Hwang LP, Freed JH. Dynamic Effects of Pair Correlation Functions on Spin Relaxation by Translational Diffusion in Liquids. J. Chem. Phys. 1975;63:4017–4025. [Google Scholar]
- 38.Gillis P, Koenig SH. Transverse Relaxation of Solvent Protons Induced by Magnetized Spheres: Application to Ferritin, Erythrocytes, and Magnetite. Magn. Reson. Med. 1987;5:323–345. doi: 10.1002/mrm.1910050404. [DOI] [PubMed] [Google Scholar]
- 39.Zhang S, Zhang SSL. Generalization of the Landau–Lifshitz–Gilbert Equation for Conducting Ferromagnets. Phys. Rev. Lett. 2009;102:086601. doi: 10.1103/PhysRevLett.102.086601. [DOI] [PubMed] [Google Scholar]
- 40.Wang T, Wang X, LaMontagne D, Wang Z, Wang Z, Cao YC. Shape-Controlled Synthesis of Colloidal Super-particles from Nanocubes. J. Am. Chem. Soc. 2012;134:18225–18228. doi: 10.1021/ja308962w. [DOI] [PubMed] [Google Scholar]
- 41.Vácha R, Martinez-Veracoechea FJ, Frenkel D. Receptor-Mediated Endocytosis of Nanoparticles of Various Shapes. Nano Lett. 2011;11:5391–5395. doi: 10.1021/nl2030213. [DOI] [PubMed] [Google Scholar]
- 42.Pinho SLC, Pereira GA, Voisin P, Kassem J, Bouchaud V, Etienne L, Peters JA, Carlos L, Mornet S, Geraldes CFGC, et al. Fine Tuning of the Relaxometry of γ-Fe2O3@SiO2 Nanoparticles by Tweaking the Silica Coating Thickness. ACS Nano. 2010;4:5339–5349. doi: 10.1021/nn101129r. [DOI] [PubMed] [Google Scholar]
- 43.Pinho SLC, Laurent S, Rocha J, Roch A, Delville M-H, Mornet S, Carlos LD, Vander Elst L, Muller RN, Geraldes CFGC. Relaxometric Studies of γ-Fe2O3@SiO2 Core Shell Nanoparticles: When the Coating Matters. J. Phys. Chem. C. 2011;116:2285–2291. [Google Scholar]
- 44.Freed JH. Dynamic Effects of Pair Correlation Functions on Spin Relaxation by Translational Diffusion in Liquids. II. Finite Jumps and Independent T1 Processes. J. Chem. Phys. 1978;68:4034. [Google Scholar]
- 45.Caravan P, Greenfield MT, Li X, Sherry AD. The Gd3+ Complex of a Fatty Acid Analogue of DOTP Binds to Multiple Albumin Sites with Variable Water Relaxivities. Inorg. Chem. 2001;40:6580–6587. doi: 10.1021/ic0102900. [DOI] [PubMed] [Google Scholar]
- 46.Tong S, Hou S, Zheng Z, Zhou J, Bao G. Coating Optimization of Superparamagnetic Iron Oxide Nanoparticles for High T2 Relaxivity. Nano Lett. 2010;10:4607–4613. doi: 10.1021/nl102623x. [DOI] [PMC free article] [PubMed] [Google Scholar]
- 47.Tromsdorf UI, Bigall NC, Kaul MG, Bruns OT, Nikolic MS, Mollwitz B, Sperling RA, Reimer R, Hohenberg H, Parak WJ, et al. Size and Surface Effects on the MRI Relaxivity of Manganese Ferrite Nanoparticle Contrast Agents. Nano Lett. 2007;7:2422–2427. doi: 10.1021/nl071099b. [DOI] [PubMed] [Google Scholar]
- 48.Paquet C, de Haan HW, Leek DM, Lin H-Y, Xiang B, Tian G, Kell A, Simard B. Clusters of Superparamagnetic Iron Oxide Nanoparticles Encapsulated in a Hydrogel: A Particle Architecture Generating a Synergistic Enhancement of the T2 Relaxation. ACS Nano. 2011;5:3104–3112. doi: 10.1021/nn2002272. [DOI] [PubMed] [Google Scholar]
Associated Data
This section collects any data citations, data availability statements, or supplementary materials included in this article.