

Abstract
The mitochondrial deacetylase SIRT3 regulates several important metabolic processes. SIRT3 is transcriptionally upregulated in multiple tissues during nutrient stresses such as dietary restriction and fasting, but the molecular mechanism of this induction is unclear. We conducted a bioinformatic study to identify transcription factor(s) involved in SIRT3 induction. Our analysis identified an enrichment of binding sites for nuclear respiratory factor 2 (NRF-2), a transcription factor known to play a role in the expression of mitochondrial genes, in the DNA sequences of SIRT3 and genes with closely correlated expression patterns. In vitro, knockdown or overexpression of NRF-2 modulated SIRT3 levels, and the NRF-2α subunit directly bound to the SIRT3 promoter. Our results suggest that NRF-2 is a regulator of SIRT3 expression and may shed light on how SIRT3 is upregulated during nutrient stress.
Keywords: calorie restriction, dietary restriction, microarray analysis, nuclear respiratory factor 2, SIRT3
Introduction
The NAD+-dependent mitochondrial deacetylase sirtuin-3 (SIRT3) is central to the regulation of cellular metabolism, including the adaptation to nutrient stresses such as fasting and dietary restriction (DR) (Lombard et al., 2007; Hebert et al., 2013). SIRT3 protein levels are upregulated by fasting and DR in liver, where it stimulates fatty acid oxidation (Hirschey et al., 2010) and activates key nodes of ketone body production (Shimazu et al., 2010) and the urea cycle (Hallows et al., 2011). SIRT3 mRNA levels are also upregulated by DR in brown adipose tissue, where SIRT3 activates mitochondrial thermogenesis (Shi et al., 2005). In addition, SIRT3 mediates some of the beneficial effects of DR, such as the activation of mitochondrial superoxide dismutase to reduce oxidative stress (Qiu et al., 2010; Tao et al., 2010) and the prevention of age-related hearing loss in mice (Someya et al., 2010). Conversely, livers of mice fed a chronic high-fat diet exhibit reduced SIRT3 mRNA and protein levels (Hirschey et al., 2011), indicating that SIRT3 expression is dynamically regulated by nutrient intake.
Surprisingly, little is known about the molecular control of SIRT3 expression. In murine adipocytes and hepatocytes, the transcription factor estrogen-related receptor α (ERRα) has been shown to induce SIRT3 expression in conjunction with peroxisome proliferator-activated receptor γ coactivator 1-α (PGC-1α) (Kong et al., 2010; Giralt et al., 2011). In this study, we employed a bioinformatic approach to identify additional transcription factors which regulate SIRT3 expression. We searched publicly available microarray data to identify datasets with an induction of SIRT3 by either DR or fasting and then computationally identified transcription factor binding motifs enriched in the regulatory regions of SIRT3 and co-induced genes. Our bioinformatic analysis and experimental validation in cell culture identified nuclear respiratory factor 2 (NRF-2) as a novel transcriptional regulator of SIRT3 expression.
Results
Bioinformatic analysis
To identify transcription factors involved in SIRT3 induction, we undertook a systematic bioinformatic approach (Fig.1A). We first identified datasets in which SIRT3 mRNA expression was increased with DR in neocortex (GSE11291; Barger et al., 2008), cochlea (GSE4786, Someya et al., 2007), and liver (GSE26267, Streeper et al., 2012), and with fasting in kidney (GSE24504, Hakvoort et al., 2011). We conducted gene set enrichment analysis (Table S1, Supporting information) to verify that this induction was part of a larger metabolic adaptation. Next, based on the rationale that co-expressed genes may share common transcriptional regulators, we identified the genes most closely co-induced with SIRT3 in each dataset (Fig.1B, File S1, Supporting information). Groups of 25, 50, and 100 genes were analyzed, allowing for greater statistical power than an analysis of SIRT3 alone. Gene ontology analysis showed that the genes most closely co-induced with SIRT3 were enriched in metabolism-related annotations, as well as processes such as the cellular response to stress (Fig.1C, Table S2, Supporting information), suggesting that many co-regulated genes are functionally related to SIRT3. For each dataset, a DNA sequence analysis algorithm (Warner et al., 2008) was then used to calculate the enrichment of a set of transcription factor motifs in 20 kbp of sequence surrounding (i) the most SIRT3-correlated genes overall or (ii) the most SIRT3-correlated mitochondrial genes (as determined by inclusion in the MitoCarta, Pagliarini et al., 2008; File S2, Supporting information). The mitochondrial group was included because SIRT3 is a mitochondrial-localized protein, and factors which regulate its expression may act specifically on nuclear-encoded mitochondrial genes during processes induced by nutrient stress such as mitochondrial biogenesis (e.g., Scarpulla, 2002).
Fig 1.

Bioinformatic identification of NRF-2 binding site enrichment in DNA sequences of SIRT3 and co-expressed genes. (A) Overview of bioinformatic steps analyzing transcription factor binding motif enrichment in the DNA sequences of SIRT3 and co-expressed genes. (B) Top 25 most SIRT3-correlated genes (by Pearson’s r) in the mouse neocortex dataset. (C) Enrichment of selected gene ontology terms in top 50 most SIRT3-correlated genes in neocortex (full results in Table S2, Supporting information). (D–F) Heat maps of transcription factor motif enrichment in the (D) 25 most SIRT3-correlated genes, (E) 50 most SIRT3-correlated genes, and (F) 100 most SIRT3-correlated genes (by expression levels across samples) for the neocortex dataset. All genes = most SIRT3-correlated genes analyzed from all genes in dataset. Mitochondrial = most SIRT3-correlated mitochondrial genes analyzed in the dataset. Top ten motifs are shown, ordered by motif’s maximum AUC score, a measure of enrichment. Red = greater enrichment; white = less enrichment. * indicates q < 0.05; ** indicates q < 0.01. (G) Overlap of significantly enriched transcription factor motifs identified in (D–F), showing results from analyzing the 25 (red circle), 50 (blue circle), and 100 (yellow circle) most SIRT3-correlated genes for the neocortex dataset.
The highest-scoring transcription factor motif identified by this study was nuclear respiratory factor 2 (NRF-2, also known as GABP) (Rosmarin et al., 2004) from the neocortex dataset, regardless of number of genes analyzed (Fig.1D–F; for the other datasets, Fig. S1 (Supporting information); full results for all datasets are in File S3, Supporting information). NRF-2 was also the only motif significantly enriched across the analyses of 25, 50, and 100 genes (Fig.1G). NRF-2 is an E26 transformation-specific (ETS) family transcription factor that is important for the expression of many mitochondrial genes (Scarpulla, 2002). NRF-2 is bound and co-activated by PGC-1α, and it is central to mitochondrial biogenesis and metabolism (Mootha et al., 2004; Baldelli et al., 2013). All ten nuclear-encoded cytochrome c oxidase subunits have functional NRF-2 binding sites (Ongwijitwat & Wong-Riley, 2005), and recognition sites for NRF-2 are also present in the promoters of ATP synthase subunit-β and succinate dehydrogenase subunits B, C, and D (Scarpulla, 2002). The effects of DR/fasting on NRF-2 and its targets in the datasets studied are included as Fig. S2 (Supporting information). SIRT3 directly interacts with several components of the electron transport chain, including ATP synthase subunit β and succinate dehydrogenase subunit A (Finley et al., 2011; Vassilopoulos et al., 2014), and one of its few known regulators is PGC-1α. This functional overlap supports our bioinformatic finding of NRF-2 as a candidate regulator of SIRT3.
Analysis of SIRT3 promoter
To investigate whether NRF-2 regulates SIRT3 expression, we probed for NRF-2 binding sites in the SIRT3 promoter. SIRT3 shares a short bidirectional promoter with the 26S proteasome non-ATPase regulatory subunit 13 (PSMD13) (Bellizzi et al., 2007). The two genes are coded on opposite strands, with their 5′ ends toward each other and < 1 kbp apart. Because of the bidirectional promoter, any binding sites in the SIRT3 promoter are also in the PSMD13 promoter. Dissection of the promoter using a separate sequence analysis tool (MAPPER, http://genome.ufl.edu/mapper/; Marinescu et al., 2005) identified several transcription factor binding motifs (Fig.2A). Notably, NRF-2 was the only overlap between our significant DNA sequence analysis results for the neocortex dataset and the MAPPER results (Fig.2B). Moreover, NRF-2 sites often occur in tandem (Virbasius & Scarpulla, 1991), and the best-conserved region of the entire promoter is a pair of NRF-2 consensus sequences (Fig.2C). NRF-2 is also known to direct transcription from many bidirectional promoters (Collins et al., 2007). Taken together with the motif enrichment results above, our findings strongly suggested that NRF-2 may play a role in regulating SIRT3 expression, and perhaps PSMD13 expression as well, via the PSMD13-SIRT3 promoter.
Fig 2.
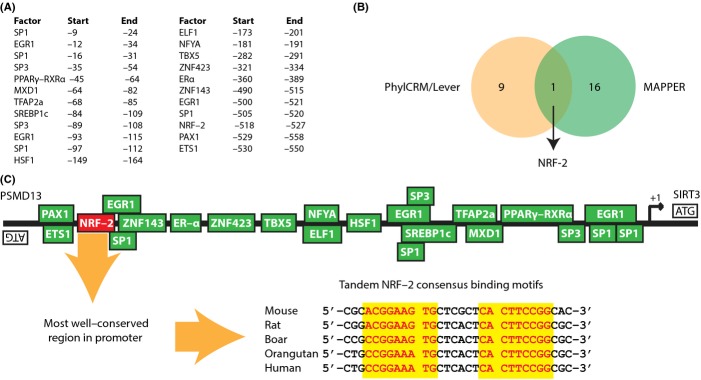
Analysis of SIRT3 promoter. (A) List of transcription factor binding sites identified by MAPPER in the mouse SIRT3 promoter. (B) Overlap of enriched transcription factor motifs identified by analysis of SIRT3 correlated genes in the neocortex dataset (pink circle) with transcription factors identified in the SIRT3 promoter (green circle). (C) Schematic of PSMD13-SIRT3 promoter, highlighting tandem NRF-2 binding sites with red text/yellow background and showing sequence across multiple species.
Experimental investigation of NRF-2 and SIRT3
We tested experimentally whether NRF-2 regulates SIRT3 and PSMD13 gene expression using human 293T cells. NRF-2 functions as a heterodimer, with the α subunit binding DNA and the β subunit facilitating binding between heterodimers (Batchelor et al., 1998). When NRF-2α and NRF-2β1 were transiently overexpressed together (Fig.3A,B), SIRT3 mRNA levels were significantly induced (P = 0.046 for HA-tagged NRF-2, P = 0.003 for untagged NRF-2, Fig.3C) to a greater degree than known NRF-2 target DNA polymerase subunit γ-2 (POLG2) (P = 0.26 for HA-tagged NRF-2, P = 0.44 for untagged NRF-2, Fig.3D). PSMD13 levels were not significantly affected (P = 0.21 for HA-tagged NRF-2, P = 0.77 for untagged NRF-2, Fig.3E) and were likewise only weakly correlated with SIRT3 expression in the four datasets examined (File S1, Supporting information). Conversely, when the DNA-binding NRF-2α subunit was knocked down (Fig.3F), SIRT3 mRNA levels significantly dropped (P = 0.005, Fig.3G). These data demonstrate that SIRT3 expression responded dynamically to NRF-2 levels.
Fig 3.

Experimental investigation of NRF-2 control of the SIRT3 promoter. (A) Validation of NRF-2α overexpression and B) NRF-2β1 overexpression in 293T cells by quantitative PCR. The two subunits together compose NRF-2. (C) Effect of NRF-2 overexpression on mRNA levels of SIRT3, (D) mitochondrial DNA polymerase subunit γ-2 (POLG2), and (E) PSMD13. (F) Validation of NRF-2α knockdown in 293T cells and (G) effect on SIRT3 mRNA levels. (H) Relative luminescence from forward (SIRT3) and (I) reversed (PSMD13) bidirectional promoter luciferase reporter following the overexpression of vector control or NRF-2-HA in 293T cells. (J) Diagrams of changes introduced in two reporter constructs with mutated NRF-2 binding sites: a double transversion mutation (DM) and a 26-base pair deletion mutation (DEL). Mutations introduced are shown in red. NRF-2 binding sites are highlighted with a yellow background. (K) Relative luminescence from SIRT3 promoter reporter with wild-type sequence (NRF-2 wt), mutated NRF-2 binding sites (NRF-2 DM), or deleted NRF-2 binding sites (NRF-2 DEL). (L) Chromatin immunoprecipitation of HA tag in 293T cells following the overexpression of NRF-2α-HA, showing percent input (relative to β-actin) of SIRT3 and positive (mTERF, POLRMT, TFB2M) and negative (mTERF3, RPL30) NRF-2 controls. (M) Chromatin immunoprecipitation of histone H3 in 293T cells following the overexpression of NRF-2α-HA, showing percent input (relative to β-actin) of SIRT3 and positive and negative NRF-2 controls. For A–G, n = 3 samples per condition, and B2M was used as the reference gene; for H–K, n = 4 samples per condition; for L and M, n = 3 separate immunoprecipitations; and for all, bars are standard error. * indicates P < 0.05; ** indicates P < 0.01; and *** indicates P < 0.001. Two-tailed Student’s t-test was used for P values.
Having identified the presence of canonical NRF-2 binding sites in the SIRT3 promoter and characterized the response of SIRT3 expression to NRF-2 overexpression, we next tested whether the response to NRF-2 occurs via the SIRT3 promoter. A luciferase reporter plasmid driven by the shared promoter in either the SIRT3 or PSMD13 direction (Satterstrom & Haigis, 2014) was transfected into 293T cells. NRF-2 was then overexpressed and luminescence measured. Overexpression of NRF-2 increased the activation of the reporter when driven by the SIRT3 promoter (P < 0.01, Fig.3H) but did not have a significant effect when the promoter was inserted in the PSMD13 direction (activity decreased, P = 0.09, Fig.3I). Further, point mutation or deletion of the NRF-2 binding site greatly reduced the activity of the reporter in the SIRT3 direction (Fig.3J–K). Together with the quantitative PCR data, these data suggest that NRF-2 may control SIRT3 expression by direct interaction with the SIRT3 promoter.
To test physical binding of the SIRT3 promoter by NRF-2, a chromatin immunoprecipitation was performed in 293T cells transiently overexpressing HA-tagged NRF-2α, the DNA-binding subunit of the NRF-2 heterodimer. Following chromatin isolation, HA tag was immunoprecipitated and qPCR was used to quantify the levels of target DNA. Immunoprecipitation and quantification were carried out three times. Using β-actin as a background normalization factor across experiments, SIRT3 was significantly enriched in the NRF-2α-treated condition compared to the untreated condition (P = 0.005). This enrichment was to approximately the same degree as genes known to be transcriptionally regulated by NRF-2 (Bruni et al., 2010), such as mitochondrial transcription termination factor (mTERF) (P = 0.99), mitochondrial RNA polymerase (POLRMT) (P = 0.30), and mitochondrial transcription factor B2 (TFB2M) (P = 0.43), and to a significantly greater degree than non-NRF-2-regulated genes such as mTERF3 (P = 0.01) and ribosomal protein L30 (RPL30) (P = 0.002) (Fig.3L). This enhancement was not seen with control anti-histone H3 immunoprecipitations (Fig.3M). These results suggest that NRF-2α physically binds the SIRT3 promoter to affect SIRT3 gene expression.
Discussion
In this study, we have discovered that nuclear respiratory factor 2 (NRF-2) is a novel regulator of SIRT3 expression. We used a bioinformatic analysis to show that NRF-2 binding sites are highly enriched in the regulatory regions of SIRT3 and genes that are similarly induced by DR. We have also demonstrated that SIRT3 mRNA levels respond to overexpression or knockdown of NRF-2 in 293T cells and that the same effect occurs when using a luciferase reporter with the SIRT3 promoter. Finally, we have shown by chromatin immunoprecipitation that the α subunit of NRF-2 binds the SIRT3 promoter directly, suggesting a model wherein NRF-2 binds the SIRT3 promoter, leading to the expression of SIRT3 mRNA. Our data also suggest that SIRT3 and PSMD13 are regulated independently, as NRF-2 induces the expression of SIRT3 but not PSMD13 under the conditions studied.
NRF-2 binds and is co-activated by PGC-1α, leading to an increase in its induction of target genes (Mootha et al., 2004; Baldelli et al., 2013). Notably, ERRα, which is already known to play a role in activating SIRT3 transcription, is also co-activated by PGC-1α (Schreiber et al., 2003). Both NRF-2 and ERRα drive the expression of oxidative genes as well as each other (Mootha et al., 2004), but they may be active at different times or in different tissues; in support of this idea, NRF-2 was a significant result for our analysis of the neocortex dataset, while one significant result for our analysis of the liver dataset was ERRβ (which has a nearly identical binding motif to ERRα; ERRα was not in the set of JASPAR motifs). Although further study is needed to determine the relative importance of these transcription factors for the induction of SIRT3 in different physiological contexts, our data suggest that NRF-2 plays an important role.
Because PGC-1α is induced in certain tissues by fasting or DR (Lehman et al., 2000), the PGC-1α/NRF-2 pathway may underlie the upregulation of SIRT3 and other mitochondrial genes in DR. The overlap in pathways affected by NRF-2 and SIRT3 supports this idea. Even under basal conditions, the deletion of NRF-2 in mouse embryonic fibroblasts reduces many markers of mitochondrial biogenesis, including oxygen consumption and ATP production (Yang et al., 2014). SIRT3, meanwhile, is known to increase oxygen consumption (Shi et al., 2005), to be important for ATP production (Ahn et al., 2008), and to be important for mitochondrial biogenesis (Kong et al., 2010). These functions are enhanced during stress (e.g., Vassilopoulos et al., 2014). Thus, not only do NRF-2 and SIRT3 function in similar stress-induced pathways, but SIRT3 carries out functions which are abrogated when NRF-2 is absent. Although whole-body knockout of NRF-2 leads to embryonic lethality (Ristevski et al., 2004), necessitating the use of tissue-specific deletion or other more nuanced methods, further study will determine whether NRF-2 is required for the action of SIRT3 under basal and stressed conditions.
Our analysis additionally identified multiple transcription factors of interest which may be involved in the regulation of SIRT3 expression. CCAAT/enhancer-binding protein α (CEBPα), whose motif was enriched in the neocortex dataset, and c-MYC, whose motif was enriched in the kidney dataset, regulate metabolic processes and would be reasonable candidate regulators of SIRT3. CEBPα regulates transcription of the human fat mass and obesity-associated gene (FTO) (Ren et al., 2014), and c-MYC is well known for its role in cancer metabolism (reviewed in Miller et al., 2012). Additionally, our inspection of the SIRT3 promoter identified binding sites for transcription factors known to interact with NRF-2, including Sp1 and Sp3 (Galvagni et al., 2001), or share common targets with it, including ZNF143 (Gérard et al., 2007) and EGR1 (Fromm & Rhode, 2004). Finally, ETS-1, ELF-1, ELK1, and ELK4 are all members of the same family of transcription factors as NRF-2. It is possible that one or more was identified because of its similar binding motif without actually playing a role in SIRT3 expression; it is also possible that they are important in different contexts, or, when they are co-expressed, multiple factors may bind the same promoter element to activate gene expression with different strengths (Takahashi et al., 2008).
Our findings are an important step toward elucidating the molecular regulation upstream of SIRT3 expression. SIRT3 levels are increased in multiple tissues during nutrient stresses such as DR. DR is associated with increased lifespan (Anderson & Weindruch, 2010), as is a SIRT3 allele with increased activity (Bellizzi et al., 2005). We have shown that NRF-2 plays a role in the induction of SIRT3, and this may help to uncover the molecular pathways activated by DR and to inform therapies that delay the onset of age-related disease.
Experimental procedures
Analysis of SIRT3 levels in microarray datasets
Microarray series data and corresponding platform annotations from DR/fasting experiments were downloaded from the Gene Expression Omnibus at http://www.ncbi.nlm.nih.gov/geo/. Significance of the effect on SIRT3 was determined using a two-tailed Student’s t-test with a significance threshold of P < 0.05. In cases where the platform had more than one probe for SIRT3, each probe was examined individually.
Gene set enrichment analysis
Gene set enrichment analysis of each dataset showing a significant induction of SIRT3 by DR/fasting was performed using the GSEA version 2.0.10 java program from http://www.broadinstitute.org/gsea/downloads.jsp. Data files were prepared with the Broad GEOImporter preprocess utility and were analyzed for the enrichment of gene ontology-related gene sets as contained in the c5.all.v3.1.symbols.gmt gene sets database. Datasets were collapsed from probes to gene symbols using default settings, and 1000 permutations were conducted. Gene set permutations were used because none of the datasets had a sufficient number of samples per condition to allow the use of phenotype permutations. Datasets which showed no significant induction of any gene sets were not included in subsequent analysis.
Calculation of co-regulated gene sets
The robust multiarray average (RMA) algorithm as implemented in the Bioconductor package ‘affy’ (Gautier et al., 2004) for R was used to background adjust and normalize the raw data files for each dataset that showed upregulation of Sirt3 and gene ontology-related gene sets upon DR (except for GSE24504, for which the GEO series matrix was used). Correlations (Pearson’s r) were then computed between the SIRT3 probe and each probe in the array. To control for probe specificity, probes whose label contained an _s_ or _x_ were removed from datasets generated from the Affymetrix Mouse Genome 430 2.0 Array unless doing so would leave the gene without any valid probes. For genes with multiple probes, correlations were averaged to compute a single correlation value for the gene.
Gene ontology analysis
Analysis of overrepresented gene ontology terms was carried out within the Cytoscape software program using the BiNGO plugin (Maere et al., 2005), with the whole mus musculus annotation as the reference set. The hypergeometric statistical test and Benjamini & Hochberg FDR correction options were used.
DNA sequence analysis
Analysis was conducted using the PhylCRM-Lever algorithm (Warner et al., 2008). The sequence analysis looked at 20 kbp for each gene, from −10 kbp to +10 kbp surrounding the transcription start site. Motif enrichment was calculated for all 130 mammalian motifs hosted by version 4 of the JASPAR database (Portales-Casamar et al., 2010; http://jaspar.genereg.net/). The analysis included weighting based on the conservation of transcription factor motifs across genomes of multiple species: mouse (mm9), rat (rn4), human (hg18), chimpanzee (panTro2), rhesus macaque (rheMac2), cow (bosTau3), dog (canFam2), and chicken (galGal3). SIRT3 itself was included in the lists of SIRT3-correlated genes.
Additional DNA sequence analysis was performed using MAPPER (Marinescu et al., 2005). MAPPER database runs with default filtering options examined 2 kbp of mus musculus DNA sequence upstream of the transcription start, using TRANSFAC, MAPPER, and JASPAR models.
Cell culture
Human embryonic kidney 293T cells were grown in Dulbecco’s modified Eagle’s minimal essential medium (Life Technologies, cat. # 11995) with 10% fetal bovine serum (HyClone GE Healthcare, Little Chalfont, Buckinghamshire, United Kingdom) and 1% penicillin–streptomycin supplement (Life Technologies, Carlsbad, CA, USA) and maintained in an incubator at standard tissue culture conditions (37 °C, 5% CO2). A control knockdown line was created using a GFP shRNA construct, and a 293T NRF-2α knockdown cell line was created using shRNA construct TRCN0000235698 from the RNAi consortium (both via the Dana-Farber/Harvard Cancer Center RNAi Core facility).
Expression and reporter plasmids
HA-tagged overexpression plasmids for NRF-2α and NRF-2β1 were generated using Gateway cloning techniques, starting from the HsCD00080063 and HsCD00370955 entry clones, respectively, from the PlasmID database of the Dana-Farber/Harvard Cancer Center DNA Resource Core. Untagged overexpression plasmids were generated via Gateway cloning techniques from HsCD00296808 and HsCD00338810. The reversible SIRT3-PSMD13 promoter reporter construct was cloned as described (Satterstrom & Haigis, 2014). Plasmid DNA was transfected into 293T cells using FuGene6 (Roche, Basel, Switzerland) according to the manufacturer’s instructions, and cells were allowed to grow for 48 h prior to analysis.
SIRT3 promoter reporter mutagenesis
SIRT3 promoter reporter mutants were cloned with altered NRF-2 binding sites (a change of two bases in each of the two binding sites) or with deleted NRF-2 binding sites (both binding sites and the intervening sequence removed, a total of 26 bases). A QuikChange II mutagenesis kit (Agilent Technologies, Santa Clara, CA) was used to produce the mutant with altered binding sites, in which both NRF-2 binding sites have a mutation of CCGGAA to CCTTAA (Virbasius et al., 1993). To produce the mutant with both binding sites deleted, a Q5 Site-Directed Mutagenesis Kit (New England Biolabs, Ipswich, MA, USA) was used with an annealing temperature of 72 °C. Primers used are given in Table S3 (Supporting information). For the altered binding site mutant, the pair labeled DM1 was used prior to the pair labeled DM2.
Luciferase
Cells were grown in an opaque 96-well plate. Following co-transfection of the SIRT3 reporter plasmid and the pRL renilla control vector (Promega, Madison, WI, USA), the Dual-Luciferase Reporter Assay System (Promega) was used according to the manufacturer’s instructions. Sample luminescence was assayed with a Cary Varian Eclipse fluorescence spectrophotometer.
Chromatin immunoprecipitation
Chromatin immunoprecipitation (ChIP) was performed with the SimpleChIP Enzymatic Chromatin IP Kit (Cell Signaling, Danvers, MA, USA) with antibodies against HA tag (Cell Signaling), histone H3 (Cell Signaling), or normal rabbit IgG (Cell Signaling). Relative quantities of precipitated DNA fragments were obtained using quantitative PCR. Three separate immunoprecipitations were performed. To control for variation in percent input across precipitations, the percent input of each target gene was divided by the percent input of a random background gene, β-actin. These normalized values were then averaged across precipitations and analyzed for significance.
Quantitative PCR
For overexpression experiments in cells, RNA was extracted using RNEasy Mini Kits (Qiagen, Hilden, Germany) and cDNA was synthesized using iScript cDNA Synthesis Kits (Bio-Rad, Hercules, CA, USA). For both overexpression experiments and ChIP analysis, quantitative PCR was performed with 2× PerfeCTa SYBR Green FastMix (Quanta BioSciences, Gaithersburg, MD, USA). Control primers for ChIP analysis were from Bruni et al. (2010); other primer sequences are given in Table S3 (Supporting information) (except RPL30; Cell Signaling). For non-ChIP analysis, β2-microglobulin (B2M) was used as a reference gene.
Funding
F. K. S. was supported by NIH Training Grant No. T32 DK007260. M. L. B. was supported in part by NIH Grant No. R01 DK088718. M. C. H. was supported by an American Cancer Society Research Scholar Award and the Glenn Foundation for Medical Research.
Conflict of interest
None declared.
Supporting Information
Additional Supporting Information may be found in the online version of this article at the publisher's web-site.
Fig. S1 Heat maps of transcription factor motif enrichment in DNA sequences of SIRT3 and co-expressed genes for cochlea (A–C), liver (D–F), and kidney (G–I) datasets based on sequence analysis of the top 25, 50, and 100 SIRT3-correlated genes in each dataset.
Fig. S2 Effect of DR or fasting on NRF-2 and its target genes, including ERRα, in the datasets used in this study (neocortex, GSE11291; cochlea, GSE4786; liver, GSE26267, kidney, GSE24504) as well as a mouse dataset previously generated by our laboratory (GSE34773, skeletal muscle).
Table S1 Gene set enrichment analysis summary for datasets with significant induction of SIRT3 in mouse tissue by dietary restriction or fasting.
Table S2 Overrepresented gene ontology terms in the top 50 SIRT3-correlated genes in each of the four datasets analyzed.
Table S3 Sequences of primers used in this study.
File S1 Complete correlations with SIRT3 expression for each gene in each of four datasets analyzed.
File S2 All input gene groups used in PhylCRM-Lever DNA sequence analysis algorithm.
File S3 Complete PhylCRM-Lever results for each analyzed dataset.
References
- Ahn BH, Kim HS, Song S, Lee IH, Liu J, Vassilopoulos A, Deng CX, Finkel T. A role for the mitochondrial deacetylase Sirt3 in regulating energy homeostasis. Proc. Natl. Acad. Sci. U. S. A. 2008;105:14447–14452. doi: 10.1073/pnas.0803790105. [DOI] [PMC free article] [PubMed] [Google Scholar]
- Anderson RM, Weindruch R. Metabolic reprogramming, caloric restriction and aging. Trends Endocrinol. Metab. 2010;21:134–141. doi: 10.1016/j.tem.2009.11.005. [DOI] [PMC free article] [PubMed] [Google Scholar]
- Baldelli S, Aquilano K, Ciriolo MR. Punctum on two different transcription factors regulated by PGC-1α: nuclear factor erythroid-derived 2-like 2 and nuclear respiratory factor 2. Biochim. Biophys. Acta. 2013;1830:4137–4146. doi: 10.1016/j.bbagen.2013.04.006. [DOI] [PubMed] [Google Scholar]
- Barger JL, Kayo T, Vann JM, Arias EB, Wang J, Hacker TA, Wang Y, Raederstorff D, Morrow JD, Leeuwenburgh C, Allison DB, Saupe KW, Cartee GD, Weindruch R, Prolla TA. A low dose of dietary resveratrol partially mimics caloric restriction and retards aging parameters in mice. PLoS One. 2008;3:e2264. doi: 10.1371/journal.pone.0002264. [DOI] [PMC free article] [PubMed] [Google Scholar]
- Batchelor AH, Piper DE, de la Brousse FC, McKnight SL, Wolberger C. The structure of GABPalpha/beta: an ETS domain- ankyrin repeat heterodimer bound to DNA. Science. 1998;279:1037–1041. doi: 10.1126/science.279.5353.1037. [DOI] [PubMed] [Google Scholar]
- Bellizzi D, Rose G, Cavalcante P, Covello G, Dato S, De Rango F, Greco V, Maggiolini M, Feraco E, Mari V, Franceschi C, Passarino G, De Benedictis G. A novel VNTR enhancer within the SIRT3 gene, a human homologue of SIR2, is associated with survival at oldest ages. Genomics. 2005;85:258–263. doi: 10.1016/j.ygeno.2004.11.003. [DOI] [PubMed] [Google Scholar]
- Bellizzi D, Dato S, Cavalcante P, Covello G, Di Cianni F, Passarino G, Rose G, De Benedictis G. Characterization of a bidirectional promoter shared between two human genes related to aging: SIRT3 and PSMD13. Genomics. 2007;89:143–150. doi: 10.1016/j.ygeno.2006.09.004. [DOI] [PubMed] [Google Scholar]
- Bruni F, Polosa PL, Gadaleta MN, Cantatore P, Roberti M. Nuclear respiratory factor 2 induces the expression of many but not all human proteins acting in mitochondrial DNA transcription and replication. J. Biol. Chem. 2010;285:3939–3948. doi: 10.1074/jbc.M109.044305. [DOI] [PMC free article] [PubMed] [Google Scholar]
- Collins PJ, Kobayashi Y, Nguyen L, Trinklein ND, Myers RM. The ets-related transcription factor GABP directs bidirectional transcription. PLoS Genet. 2007;3:e208. doi: 10.1371/journal.pgen.0030208. [DOI] [PMC free article] [PubMed] [Google Scholar]
- Finley LW, Haas W, Desquiret-Dumas V, Wallace DC, Procaccio V, Gygi SP, Haigis MC. Succinate dehydrogenase is a direct target of sirtuin 3 deacetylase activity. PLoS One. 2011;6:e23295. doi: 10.1371/journal.pone.0023295. [DOI] [PMC free article] [PubMed] [Google Scholar]
- Fromm L, Rhode M. Neuregulin-1 induces expression of Egr-1 and activates acetylcholine receptor transcription through an Egr-1-binding site. J. Mol. Biol. 2004;339:483–494. doi: 10.1016/j.jmb.2004.04.018. [DOI] [PubMed] [Google Scholar]
- Galvagni F, Capo S, Oliviero S. Sp1 and Sp3 physically interact and co-operate with GABP for the activation of the utrophin promoter. J. Mol. Biol. 2001;306:985–996. doi: 10.1006/jmbi.2000.4335. [DOI] [PubMed] [Google Scholar]
- Gautier L, Cope L, Bolstad BM, Irizarry RA. affy–analysis of Affymetrix GeneChip data at the probe level. Bioinformatics. 2004;20:307–315. doi: 10.1093/bioinformatics/btg405. [DOI] [PubMed] [Google Scholar]
- Gérard MA, Krol A, Carbon P. Transcription factor hStaf/ZNF143 is required for expression of the human TFAM gene. Gene. 2007;401:145–153. doi: 10.1016/j.gene.2007.07.011. [DOI] [PubMed] [Google Scholar]
- Giralt A, Hondares E, Villena JA, Ribas F, Díaz-Delfín J, Giralt M, Iglesias R, Villarroya F. Peroxisome proliferator-activated receptor-gamma coactivator-1alpha controls transcription of the Sirt3 gene, an essential component of the thermogenic brown adipocyte phenotype. J. Biol. Chem. 2011;286:16958–16966. doi: 10.1074/jbc.M110.202390. [DOI] [PMC free article] [PubMed] [Google Scholar]
- Hakvoort TB, Moerland PD, Frijters R, Sokolović A, Labruyère WT, Vermeulen JL, Loren Ver, van Themaat E, Breit TM, Wittink FR, van Kampen AH, Verhoeven AJ, Lamers WH, Sokolović M. Interorgan coordination of the murine adaptive response to fasting. J. Biol. Chem. 2011;286:16332–16343. doi: 10.1074/jbc.M110.216986. [DOI] [PMC free article] [PubMed] [Google Scholar]
- Hallows WC, Yu W, Smith BC, Devries MK, Ellinger JJ, Someya S, Shortreed MR, Prolla T, Markley JL, Smith LM, Zhao S, Guan KL, Denu JM. Sirt3 promotes the urea cycle and fatty acid oxidation during dietary restriction. Mol. Cell. 2011;41:139–149. doi: 10.1016/j.molcel.2011.01.002. [DOI] [PMC free article] [PubMed] [Google Scholar]
- Hebert AS, Dittenhafer-Reed KE, Yu W, Bailey DJ, Selen ES, Boersma MD, Carson JJ, Tonelli M, Balloon AJ, Higbee AJ, Westphall MS, Pagliarini DJ, Prolla TA, Assadi-Porter F, Roy S, Denu JM, Coon JJ. Calorie restriction and SIRT3 trigger global reprogramming of the mitochondrial protein acetylome. Mol. Cell. 2013;49:186–199. doi: 10.1016/j.molcel.2012.10.024. [DOI] [PMC free article] [PubMed] [Google Scholar]
- Hirschey MD, Shimazu T, Goetzman E, Jing E, Schwer B, Lombard DB, Grueter CA, Harris C, Biddinger S, Ilkayeva OR, Stevens RD, Li Y, Saha AK, Ruderman NB, Bain JR, Newgard CB, Farese RV, Jr, Alt FW, Kahn CR, Verdin E. SIRT3 regulates mitochondrial fatty-acid oxidation by reversible enzyme deacetylation. Nature. 2010;464:121–125. doi: 10.1038/nature08778. [DOI] [PMC free article] [PubMed] [Google Scholar]
- Hirschey MD, Shimazu T, Jing E, Grueter CA, Collins AM, Aouizerat B, Stančáková A, Goetzman E, Lam MM, Schwer B, Stevens RD, Muehlbauer MJ, Kakar S, Bass NM, Kuusisto J, Laakso M, Alt FW, Newgard CB, Farese RV, Jr, Kahn CR, Verdin E. SIRT3 deficiency and mitochondrial protein hyperacetylation accelerate the development of the metabolic syndrome. Mol. Cell. 2011;44:177–190. doi: 10.1016/j.molcel.2011.07.019. [DOI] [PMC free article] [PubMed] [Google Scholar]
- Kong X, Wang R, Xue Y, Liu X, Zhang H, Chen Y, Fang F, Chang Y. Sirtuin 3, a new target of PGC-1alpha, plays an important role in the suppression of ROS and mitochondrial biogenesis. PLoS One. 2010;5:e11707. doi: 10.1371/journal.pone.0011707. [DOI] [PMC free article] [PubMed] [Google Scholar]
- Lehman JJ, Barger PM, Kovacs A, Saffitz JE, Medeiros DM, Kelly DP. Peroxisome proliferator-activated receptor gamma coactivator-1 promotes cardiac mitochondrial biogenesis. J. Clin. Invest. 2000;106:847–856. doi: 10.1172/JCI10268. [DOI] [PMC free article] [PubMed] [Google Scholar]
- Lombard DB, Alt FW, Cheng HL, Bunkenborg J, Streeper RS, Mostoslavsky R, Kim J, Yancopoulos G, Valenzuela D, Murphy A, Yang Y, Chen Y, Hirschey MD, Bronson RT, Haigis M, Guarente LP, Farese RV, Jr, Weissman S, Verdin E, Schwer B. Mammalian Sir2 homolog SIRT3 regulates global mitochondrial lysine acetylation. Mol. Cell. Biol. 2007;24:8807–8814. doi: 10.1128/MCB.01636-07. [DOI] [PMC free article] [PubMed] [Google Scholar]
- Maere S, Heymans K, Kuiper M. BiNGO: a Cytoscape plugin to assess overrepresentation of gene ontology categories in biological networks. Bioinformatics. 2005;21:3448–3449. doi: 10.1093/bioinformatics/bti551. [DOI] [PubMed] [Google Scholar]
- Marinescu VD, Kohane IS, Riva A. MAPPER: a search engine for the computational identification of putative transcription factor binding sites in multiple genomes. BMC Bioinformatics. 2005;6:79. doi: 10.1186/1471-2105-6-79. [DOI] [PMC free article] [PubMed] [Google Scholar]
- Miller DM, Thomas SD, Islam A, Muench D, Sedoris K. c-Myc and cancer metabolism. Clin. Cancer Res. 2012;18:5546–5553. doi: 10.1158/1078-0432.CCR-12-0977. [DOI] [PMC free article] [PubMed] [Google Scholar]
- Mootha VK, Handschin C, Arlow D, Xie X, St Pierre J, Sihag S, Yang W, Altshuler D, Puigserver P, Patterson N, Willy PJ, Schulman IG, Heyman RA, Lander ES, Spiegelman BM. Errα and Gabpa/b specify PGC-1α-dependent oxidative phosphorylation gene expression that is altered in diabetic muscle. Proc. Natl. Acad. Sci. U. S. A. 2004;101:6570–6575. doi: 10.1073/pnas.0401401101. [DOI] [PMC free article] [PubMed] [Google Scholar]
- Ongwijitwat S, Wong-Riley MT. Is nuclear respiratory factor 2 a master transcriptional coordinator for all ten nuclear-encoded cytochrome c oxidase subunits in neurons? Gene. 2005;360:65–77. doi: 10.1016/j.gene.2005.06.015. [DOI] [PubMed] [Google Scholar]
- Pagliarini DJ, Calvo SE, Chang B, Sheth SA, Vafai SB, Ong SE, Walford GA, Sugiana C, Boneh A, Chen WK, Hill DE, Vidal M, Evans JG, Thorburn DR, Carr SA, Mootha VK. A mitochondrial protein compendium elucidates complex I disease biology. Cell. 2008;134:112–123. doi: 10.1016/j.cell.2008.06.016. [DOI] [PMC free article] [PubMed] [Google Scholar]
- Portales-Casamar E, Thongjuea S, Kwon AT, Arenillas D, Zhao X, Valen E, Yusuf D, Lenhard B, Wasserman WW, Sandelin A. JASPAR 2010: the greatly expanded open-access database of transcription factor binding profiles. Nucleic Acids Res. 2010;38:D105–D110. doi: 10.1093/nar/gkp950. [DOI] [PMC free article] [PubMed] [Google Scholar]
- Qiu X, Brown K, Hirschey MD, Verdin E, Chen D. Calorie restriction reduces oxidative stress by SIRT3-mediated SOD2 activation. Cell Metab. 2010;12:662–667. doi: 10.1016/j.cmet.2010.11.015. [DOI] [PubMed] [Google Scholar]
- Ren W, Guo J, Jiang F, Lu J, Ding Y, Li A, Liang X, Jia W. CCAAT/enhancer-binding protein α is a crucial regulator of human fat mass and obesity associated gene transcription and expression. Biomed. Res. Int. 2014;2014:406909. doi: 10.1155/2014/406909. [DOI] [PMC free article] [PubMed] [Google Scholar]
- Ristevski S, O’Leary DA, Thornell AP, Owen MJ, Kola I, Hertzog PJ. The ETS transcription factor GABPalpha is essential for early embryogenesis. Mol. Cell. Biol. 2004;24:5844–5849. doi: 10.1128/MCB.24.13.5844-5849.2004. [DOI] [PMC free article] [PubMed] [Google Scholar]
- Rosmarin AG, Resendes KK, Yang Z, McMillan JN, Fleming SL. GA-binding protein transcription factor: a review of GABP as an integrator of intracellular signaling and protein-protein interactions. Blood Cells Mol. Dis. 2004;32:143–154. doi: 10.1016/j.bcmd.2003.09.005. [DOI] [PubMed] [Google Scholar]
- Satterstrom FK, Haigis MC. Luciferase-based reporter to monitor the transcriptional activity of the SIRT3 promoter. Methods Enzymol. 2014;543:141–163. doi: 10.1016/B978-0-12-801329-8.00007-6. [DOI] [PMC free article] [PubMed] [Google Scholar]
- Scarpulla RC. Nuclear activators and coactivators in mammalian mitochondrial biogenesis. Biochim. Biophys. Acta. 2002;1576:1–14. doi: 10.1016/s0167-4781(02)00343-3. [DOI] [PubMed] [Google Scholar]
- Schreiber SN, Knutti D, Brogli K, Uhlmann T, Kralli A. The transcriptional coactivator PGC-1 regulates the expression and activity of the orphan nuclear receptor estrogen-related receptor alpha (ERRalpha) J. Biol. Chem. 2003;278:9013–9018. doi: 10.1074/jbc.M212923200. [DOI] [PubMed] [Google Scholar]
- Shi T, Wang F, Stieren E, Tong Q. SIRT3, a mitochondrial sirtuin deacetylase, regulates mitochondrial function and thermogenesis in brown adipocytes. J. Biol. Chem. 2005;280:13560–13567. doi: 10.1074/jbc.M414670200. [DOI] [PubMed] [Google Scholar]
- Shimazu T, Hirschey MD, Hua L, Dittenhafer-Reed KE, Schwer B, Lombard DB, Li Y, Bunkenborg J, Alt FW, Denu JM, Jacobson MP, Verdin E. SIRT3 deacetylates mitochondrial 3-hydroxy-3-methylglutaryl CoA synthase 2 and regulates ketone body production. Cell Metab. 2010;12:654–661. doi: 10.1016/j.cmet.2010.11.003. [DOI] [PMC free article] [PubMed] [Google Scholar]
- Someya S, Yamasoba T, Weindruch R, Prolla TA, Tanokura M. Caloric restriction suppresses apoptotic cell death in the mammalian cochlea and leads to prevention of presbycusis. Neurobiol. Aging. 2007;28:1613–1622. doi: 10.1016/j.neurobiolaging.2006.06.024. [DOI] [PubMed] [Google Scholar]
- Someya S, Yu W, Hallows WC, Xu J, Vann JM, Leeuwenburgh C, Tanokura M, Denu JM, Prolla TA. Sirt3 mediates reduction of oxidative damage and prevention of age-related hearing loss under caloric restriction. Cell. 2010;143:802–812. doi: 10.1016/j.cell.2010.10.002. [DOI] [PMC free article] [PubMed] [Google Scholar]
- Streeper RS, Grueter CA, Salomonis N, Cases S, Levin MC, Koliwad SK, Zhou P, Hirschey MD, Verdin E, Farese RV., Jr Deficiency of the lipid synthesis enzyme, DGAT1, extends longevity in mice. Aging (Albany, NY) 2012;4:13–27. doi: 10.18632/aging.100424. [DOI] [PMC free article] [PubMed] [Google Scholar]
- Takahashi K, Hayashi N, Shimokawa T, Umehara N, Kaminogawa S, Ra C. Cooperative regulation of Fc receptor gamma-chain gene expression by multiple transcription factors, including Sp1, GABP, and Elf-1. J. Biol. Chem. 2008;283:15134–15141. doi: 10.1074/jbc.M800498200. [DOI] [PMC free article] [PubMed] [Google Scholar]
- Tao R, Coleman MC, Pennington JD, Ozden O, Park SH, Jiang H, Kim HS, Flynn CR, Hill S, Hayes McDonald W, Olivier AK, Spitz DR, Gius D. Sirt3-mediated deacetylation of evolutionarily conserved lysine 122 regulates MnSOD activity in response to stress. Mol. Cell. 2010;40:893–904. doi: 10.1016/j.molcel.2010.12.013. [DOI] [PMC free article] [PubMed] [Google Scholar]
- Vassilopoulos A, Pennington JD, Andresson T, Rees DM, Bosley AD, Fearnley IM, Ham A, Flynn CR, Hill S, Rose KL, Kim HS, Deng CX, Walker JE, Gius D. SIRT3 deacetylates ATP synthase F1 complex proteins in response to nutrient- and exercise-induced stress. Antioxid. Redox Signal. 2014;21:551–564. doi: 10.1089/ars.2013.5420. [DOI] [PMC free article] [PubMed] [Google Scholar]
- Virbasius JV, Scarpulla RC. Transcriptional activation through ETS domain binding sites in the cytochrome c oxidase subunit IV gene. Mol. Cell. Biol. 1991;11:5631–5638. doi: 10.1128/mcb.11.11.5631. [DOI] [PMC free article] [PubMed] [Google Scholar]
- Virbasius JV, Virbasius CA, Scarpulla RC. Identity of GABP with NRF-2, a multisubunit activator of cytochrome oxidase expression, reveals a cellular role for an ETS domain activator of viral promoters. Genes Dev. 1993;7:380–392. doi: 10.1101/gad.7.3.380. [DOI] [PubMed] [Google Scholar]
- Warner JB, Philippakis AA, Jaeger SA, He FS, Lin J, Bulyk ML. Systematic identification of mammalian regulatory motifs’ target genes and functions. Nat. Methods. 2008;5:347–353. doi: 10.1038/nmeth.1188. [DOI] [PMC free article] [PubMed] [Google Scholar]
- Yang ZF, Drumea K, Mott S, Wang J, Rosmarin AG. GABP transcription factor (nuclear respiratory factor 2) is required for mitochondrial biogenesis. Mol. Cell. Biol. 2014;34:3194–3201. doi: 10.1128/MCB.00492-12. [DOI] [PMC free article] [PubMed] [Google Scholar]
Associated Data
This section collects any data citations, data availability statements, or supplementary materials included in this article.
Supplementary Materials
Fig. S1 Heat maps of transcription factor motif enrichment in DNA sequences of SIRT3 and co-expressed genes for cochlea (A–C), liver (D–F), and kidney (G–I) datasets based on sequence analysis of the top 25, 50, and 100 SIRT3-correlated genes in each dataset.
Fig. S2 Effect of DR or fasting on NRF-2 and its target genes, including ERRα, in the datasets used in this study (neocortex, GSE11291; cochlea, GSE4786; liver, GSE26267, kidney, GSE24504) as well as a mouse dataset previously generated by our laboratory (GSE34773, skeletal muscle).
Table S1 Gene set enrichment analysis summary for datasets with significant induction of SIRT3 in mouse tissue by dietary restriction or fasting.
Table S2 Overrepresented gene ontology terms in the top 50 SIRT3-correlated genes in each of the four datasets analyzed.
Table S3 Sequences of primers used in this study.
File S1 Complete correlations with SIRT3 expression for each gene in each of four datasets analyzed.
File S2 All input gene groups used in PhylCRM-Lever DNA sequence analysis algorithm.
File S3 Complete PhylCRM-Lever results for each analyzed dataset.