

Abstract
Background
The epithelial–mesenchymal transition (EMT) has been implicated as an important process in tumor cell invasion, metastasis, and drug resistance. The transcription factor brachyury has recently been described as a driver of EMT of human carcinoma cells.
Methods
Brachyury mRNA and protein expression was analyzed in human breast carcinomas and benign tissues. The role of brachyury in breast tumor prognosis and drug resistance and the ability of brachyury-specific T cells to lyse human breast carcinoma cells were also evaluated. Kaplan–Meier analyses were used to evaluate the association between brachyury expression and survival. All statistical tests were two-sided.
Results
The level of brachyury expression in breast cancer cells was positively associated with their ability to invade the extracellular matrix, efficiently form mammospheres in vitro, and resist the cytotoxic effect of docetaxel. A comparison of survival among breast cancer patients treated with tamoxifen in the adjuvant setting who had tumors with high vs low brachyury mRNA expression demonstrated that high expression of brachyury is associated as an independent variable with higher risk of recurrence (hazard ratio [HR] = 7.5; 95% confidence interval [CI] = 2.4 to 23.5; P = 5.14×10⁻⁴) and distant metastasis (HR = 15.2; 95% CI = 3.5 to 66.3; P = 3.01×10⁻⁴). We also demonstrated that brachyury-specific T cells can lyse human breast carcinoma cells.
Conclusions
The studies reported here provide the rationale for the use of a vaccine targeting brachyury for the therapy of human breast cancer, either as a monotherapy or in combination therapies.
The epithelial–mesenchymal transition (EMT) is a normal developmental process that allows the conversion of epithelial, polarized, and stationary cells into highly motile and invasive mesenchymal cells, a phenomenon required for the normal formation of the embryo (1,2). Recent investigations have demonstrated that a similar phenotypic switch can aberrantly take place during tumor progression, allowing epithelial cancer cells to lose cell polarity, epithelial markers, and cell-to-cell contacts, while simultaneously acquiring mesenchymal-associated markers, cell motility, and invasiveness (3,4). As a result, carcinoma cells undergoing EMT are enabled to initiate the cascade of events leading to the establishment of distant metastases (5).
In breast cancer, the phenomenon of EMT has been shown to take place in highly aggressive tumors with a basal-like phenotype, which frequently show overexpression of mesenchymal proteins, including vimentin and smooth-muscle-actin, and cadherin switching (reduced E-cadherin and overexpression of N-cadherin) (6,7). In breast cancer patients undergoing neoadjuvant therapy, moreover, it has been shown that recurring tumors after treatment with standard anthracycline-taxane chemotherapy had an increased proportion of cells expressing EMT-associated genes, thus highlighting the importance of EMT in therapeutic resistance (8).
We have identified brachyury, an embryonic transcription factor of the T-box family (9,10), as a driver of EMT in human carcinomas (11,12). High levels of brachyury expression in epithelial tumor cells have been shown to drive the acquisition of mesenchymal features in vitro, including motility and invasiveness, and to favor metastatic dissemination of tumor cells in vivo (11,12). In a recent study conducted with a monoclonal murine antibody, expression of brachyury protein was found in approximately 40% of non–small cell lung carcinomas and not in a range of human adult normal tissues, with the exception of low levels observed in testis and selected thyroid samples (13,14). We have been able to demonstrate the generation of brachyury-specific T cells capable of lysing human lung carcinoma cells (13). A phase I study is ongoing using a brachyury-based vaccine in patients with metastatic tumors (15).
In this study we characterize the expression of brachyury in a range of malignant and benign breast tissues both at the mRNA and protein levels and present data on the potential role of brachyury in the biology of breast cancer. We also demonstrate the ability of brachyury-specific T cells to lyse human breast carcinoma cells, providing the rationale for the use of a brachyury-specific vaccine as a monotherapy or in combination therapy approaches for breast carcinoma.
Methods
Patients and Tissue Collection
Thirty patients with histologically diagnosed primary infiltrating ductal carcinoma of the breast were enrolled in the Interinstitutional Multidisciplinary BioBank of the Department of Laboratory Medicine and Advanced Biotechnologies, IRCCS San Raffaele Pisana, Rome, Italy, in collaboration with the Surgical and Pathology Departments of San Giovanni Addolorata Hospital and the Medical Oncology Unit of the “Tor Vergata” Clinical Center, Rome, Italy. Breast tumor tissue samples were collected at the time of surgery. All patients were women aged 26–82 years (mean age = 59±14 years). Informed consent was obtained from each participating subject; the study was performed under the appropriate institutional ethics approvals and in accordance with the principles embodied in the Declaration of Helsinki. Further details are available in the Supplementary Methods (available online).
Immunohistochemical Detection of Brachyury
Sections of formalin-fixed, paraffin-embedded tissues were evaluated for brachyury (T, brachyury homolog) expression by using a murine monoclonal antibrachyury antibody (ab57480; Abcam, Cambridge, MA), as previously described (14). Two pathologists independently evaluated the tumor and normal tissue samples in a blinded, randomized way. Further details are available in the Supplementary Methods (available online).
Immunohistochemical Detection of Human Epidermal Growth Factor Receptor 2 and Scoring Method
Formalin-fixed, paraffin-embedded tumor sections were used for immunohistochemical detection of the human epidermal growth factor receptor (HER2) protein. Breast tumor sections were pretreated using a commercially available kit (Poseidon; Kreatech Diagnostics, Amsterdam, the Netherlands) according to the manufacturer’s instructions. All tumors were immunostained with the CB11 anti-HER2 antibody (Ventana Medical Systems, Tucson, AZ). HER2 staining in surgical specimens was scored by the pathologist according to the College of American Pathologists and the American Society of Clinical Oncology joint guidelines on testing for HER2 status in invasive breast cancer (16). Further details are available in the Supplementary Methods (available online).
Brachyury Expression and Prognosis
Breast tumor gene expression data (n = 4010) derived from 23 datasets on the Gene Expression Omnibus at the National Center for Biotechnology Information were compiled, including subsets of samples for which recurrence-free survival (n = 1372) and distant metastasis-free survival (n = 2187) were available (17). Each of the 4010 samples was assigned into low (lowest 25%), intermediate, and high (highest 25%) subgroups according to the levels of brachyury mRNA expression (probe set ID: 206524_at). A particular subset of 357 breast cancer patients treated with tamoxifen monotherapy as adjuvant therapy for 5 years after diagnosis was subsequently chosen for further analysis. Further details are available in the Supplementary Methods (available online).
Statistical Analysis
Data were analyzed using GraphPad Prism (GraphPad Software, La Jolla, CA). The Fisher exact test was used for analysis of the data derived from the breast cancer cDNA arrays. The Spearman rank correlation matrix was used to evaluate the potential association between brachyury expression and clinical parameters for each patient. Kaplan–Meier analyses were used to evaluate the association between brachyury expression and survival. Cox proportional hazards (COXPH) regression was used to adjust for potential confounding factors such as tumor size, grade, nodal status, age, HER2, estrogen receptor (ER), and progesterone receptor (PR) status. The assumption of proportionality was verified by visual inspection of the Kaplan–Meier curves. A P value less than .05 was considered statistically significant. All statistical tests were two-sided.
Results
Expression of Brachyury mRNA in Breast Carcinoma Samples
Analysis of brachyury mRNA expression was performed on commercially available cDNAs prepared from 118 human primary breast carcinomas at various stages of disease. As controls, seven samples of normal breast cDNA from seven different individuals were analyzed; each control sample was obtained from a histologically normal section of breast from a patient with cancer or fibrocystic disease. As shown in Figure 1A, brachyury mRNA was detected in 25 of 118 (21.2%) breast cancer samples and none of the seven normal breast tissues evaluated (0%). Further analyses were conducted to evaluate the distribution of brachyury mRNA expression among tumor samples for which data regarding tumor grade (Nottingham histological grade), tumor stage (TNM classification system), or hormone receptor status were available. Analysis of a subgroup of 117 samples for which tumor grade was available showed that brachyury mRNA was expressed by a higher (but not statistically significant) percentage of breast tumors of a poor grade of differentiation (grade 3; 22.8%) compared with tumors of grade 1 or 2 (0% and 11.1%, respectively) (Figure 1B). Unlike with tumor grade, a comparison among tumors of different stages (stages I, II, and III) showed no differences on brachyury mRNA expression according to disease stage. Hormone receptor status of breast cancer is an additional prognostic factor; tumors that are negative for both ER and PR show more aggressive features and are associated with decreased survival compared with ER+ PR+ tumors (18–22). Analysis of a subset of 79 samples for which hormone receptor status was available demonstrated brachyury mRNA expression in 31.3% of ER− vs 10.5% of ER+ tumors and in 33.3% of PR− vs 14.5% of PR+ tumors. Analysis of ER and PR together showed that brachyury was expressed by a statistically significantly higher percentage (33.3%) of tumors that were negative for both ER and PR compared with ER+ PR+ tumors (11.6%; odds ratio [OR] = 3.8; 95% confidence interval [CI] = 1.19 to 12.2; Fisher exact test, P = 0.03) (Figure 1C).
Figure 1.
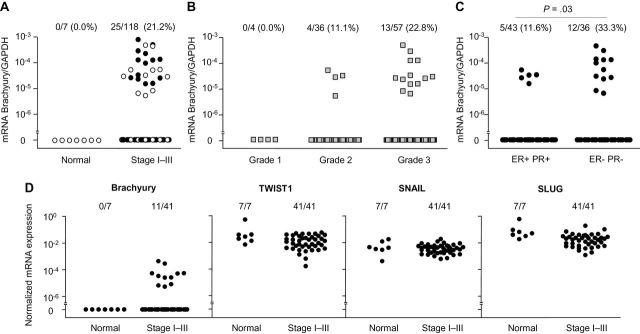
Brachyury mRNA expression in breast carcinoma tissues. A) Real-time polymerase chain reaction was performed for brachyury mRNA on human primary breast tumor tissue cDNAs prepared from 107 invasive ductal adenocarcinomas, six invasive lobular adenocarcinomas, and five mixed ductal/lobular adenocarcinomas. As controls, seven samples of normal breast cDNA originated from seven different individuals were also analyzed, each obtained from a histologically normal section of breast from a patient with cancer or fibrocystic disease. Brachyury mRNA expression is shown for breast primary tumor tissues from stages I to III grouped together (open circles indicate samples further used in the analysis presented in D) (A); breast primary tumor tissues grouped by histological tumor grade (Nottingham grading) (B); and breast primary tumor tissues grouped by estrogen receptor (ER) and progesterone receptor (PR) expression (P = .03, Fisher exact test, two-sided) (C). D) Real-time polymerase chain reaction was performed for brachyury, TWIST1, SNAIL, and SLUG expression in a subset of 41 breast tumors and seven normal breast tissues.
Other mediators of EMT, including twist, snail, and slug, are overexpressed in infiltrating ductal carcinomas and have been variously associated with histological grade, lymph node metastasis, and decreased survival (23–27). The expression of brachyury, TWIST1, SNAIL (SNAI1), and SLUG (SNAI2) mRNA were comparatively analyzed in a subset of cDNAs contained in a single array (indicated by open circles in Figure 1A) consisting of breast tumor tissues derived from 41 individual patients and seven different normal breast tissues. Whereas brachyury mRNA was expressed in breast tumors but not in the normal breast, TWIST1, SNAIL, and SLUG mRNA showed similar expression in both normal and tumor tissues (Figure 1D). These results were comparable with those previously reported (14), in which TWIST1 and SNAIL mRNA were equally expressed in lung normal and tumor tissues. Although these observations seem difficult to reconcile with previous reports of positive associations between twist, snail, and slug and breast cancer progression, the expression of these EMT drivers in normal tissues has been previously reported (28,29) and could potentially be attributed to their selective expression in a particular subset of normal cells.
Expression of Brachyury Protein in Breast Tumor Samples
The expression of brachyury was further analyzed in breast tissues by immunohistochemistry with a murine antibrachyury monoclonal antibody (14). As shown in Figure 2A, 27 of 30 primary breast tumors (90%) were positive for brachyury expression, including two cases where the expression was scored as focal. Sixteen benign breast tissues were negative for brachyury, with the exception of two cases of fibroadenoma in which focal expression of brachyury protein was detected. Representative cases are shown in Figure 2, B–G; expression of brachyury protein is seen predominantly in the nucleus of breast carcinoma cells (Figure 2, B–D) in contrast with benign breast tissues that were negative for brachyury expression (Figure 2, E–G). Table 1 details patient characteristics and brachyury protein levels in the tumor cells and in the stromal tissue adjacent vs distal to the tumors. The levels of brachyury expression in the tumors ranged from focal to 90% of the tumor cells, with intensities that varied from + to +++. Fifteen of 27 brachyury-positive breast tumor tissues also showed nuclear immunoreactivity for brachyury in adjacent, but not distal, tissue; these positive cells were characterized as stromal “fibroblasts” (see Discussion). Although a larger number of specimens would need to be evaluated to establish whether any relationship exists between brachyury and various clinical parameters, our results showed no relevant differences between samples with various levels of brachyury regarding tumor stage, grade, lymph node status, presence of lymphatic and/or vessel invasion, hormone receptor status, or HER2 positivity (Supplementary Table 1, available online).
Figure 2.
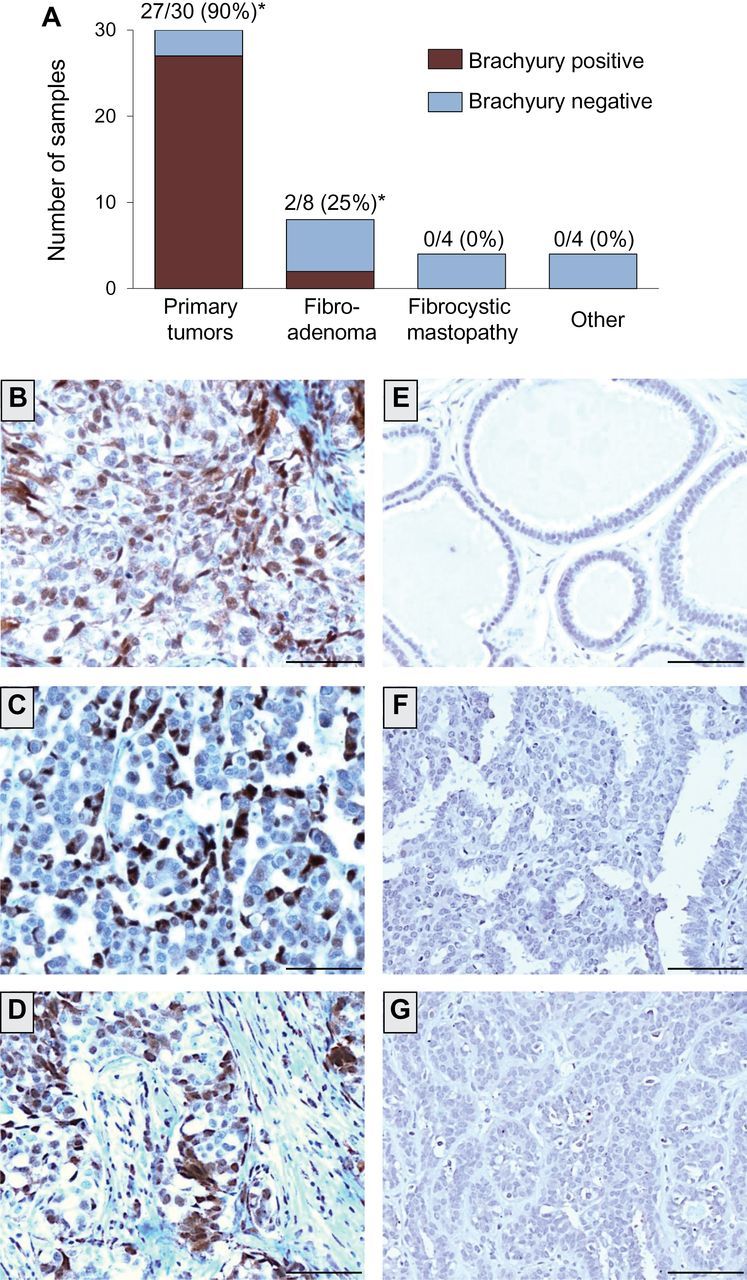
Brachyury protein expression in primary infiltrating ductal carcinomas vs benign breast tissues. A) Expression of brachyury protein was analyzed by immunohistochemistry with a brachyury-specific murine monoclonal antibody (Abcam) in 30 cases of primary infiltrating ductal carcinomas, eight cases of fibroadenoma, four cases of fibrocystic mastopathy, and one case of each of the following: usual ductal hyperplasia, sclerosing adenosis, intraductal papilloma, and normal terminal-ducto-lobular unity (TDLU), indicated in the graph as “other.” Shown is the number (and percentage) of brachyury-positive tissues per total of cases analyzed for each tissue type. (*) Two cases of adenocarcinoma and two cases of fibroadenoma scored as focal, defined as ≤5% of cells positive for brachyury. B–D) Transmitted light photomicrographs of representative primary infiltrating ductal carcinoma tissue sections stained for brachyury protein (B: patient 21; C: patient 24; D: patient 27 from Table 1). Also shown are representative examples of benign breast tissues negative for brachyury expression, corresponding to mastopathy (ductal ectasia) (E), usual ductal hyperplasia (F), and mastopathy (ductal epitheliosis) (G). The brown signal corresponds to brachyury. Magnification ×20. Scale bars = 100 μm.
Table 1.
Expression of brachyury protein in primary infiltrating ductal carcinomas by immunohistochemistry using a murine monoclonal antibrachyury antibody*
| Pt | Age, y | G | Staging | ER | PR | HER2 | Tumor cells | Adjacent breast tissue | Distal breast tissue | |
|---|---|---|---|---|---|---|---|---|---|---|
| % Positive | Intensity | |||||||||
| 14 | 60 | 3 | pT2 N3a | 30 | Neg | Pos | 90 | +++ | Neg | Neg |
| 3 | 56 | 3 | pT1c N2a L1 | 100 | 30 | Pos | 90 | ++ | Pos | Neg |
| 4 | 82 | 3 | pT2 N0 | 100 | Neg | Neg | 90 | + | Neg | Neg |
| 5 | 53 | 3 | pT2 N1a L1 | Neg | Neg | Neg | 90 | + | Pos | Neg |
| 15 | 49 | 3 | pT1c N1a L1 | 100 | 80 | Neg | 90 | -/+ | Pos | Neg |
| 23 | 56 | 3 | pT2 N0(i+) | Neg | Neg | Pos | 85 | ++ | Pos | Neg |
| 24 | 60 | 3 | pT2 N2a | Neg | Neg | Pos | 80 | +++ | Pos | Neg |
| 1 | 81 | 3 | pT2 N0 | Neg | Neg | Neg | 80 | ++ | Pos | Neg |
| 2 | 77 | 1 | pT1c N1 | 100 | 100 | Neg | 80 | ++ | Pos | Neg |
| 10 | 72 | 3 | pT2 N0 | Neg | Neg | Neg | 70 | + | Neg | Neg |
| 27 | 49 | 3 | pT2 N0 | Neg | Neg | Pos | 65 | ++ | Pos | NA |
| 8 | 57 | 3 | pT2(m) N1a | Neg | Neg | Pos | 60 | + | Neg | Neg |
| 26 | 53 | 3 | pT1c N1mi | Neg | Neg | Pos | 50 | ++ | Pos | Neg |
| 18 | 51 | 1 | pT1c N0 | 100 | 100 | Neg | 50 | ++ | Neg | Neg |
| 28 | 47 | 3 | pT2 N0 | Neg | Neg | Pos | 40 | +++ | Pos | Neg |
| 21 | 66 | 3 | pT1c N0 | Neg | Neg | Pos | 40 | ++ | Pos | Neg |
| 11 | 32 | 3 | pT2(m)N3a V1 | Neg | Neg | Neg | 40 | + | Neg | Neg |
| 22 | 79 | 3 | pT1b N0 | Neg | Neg | Pos | 30 | ++ | Pos | Neg |
| 12 | 36 | 3 | pT2 N0 L1 | Neg | Neg | Neg | 30 | + | Neg | Neg |
| 6 | 63 | 3 | pT1c N1 | Neg | Neg | Neg | 30 | + | Neg | Neg |
| 16 | 59 | 3 | pT4 N2a L1 | Neg | Neg | Pos | 30 | + | Neg | Neg |
| 25 | 26 | 3 | pT2 N3a LVI | Neg | Neg | Pos | 30 | + | Pos | Neg |
| 29 | 68 | 3 | pT2 N0 | Neg | Neg | Pos | 25 | ++ | Pos | NA |
| 7 | 73 | 3 | pT3 N0 L1 | Neg | Neg | Neg | 15 | +++ | Neg | Neg |
| 30 | 60 | 3 | pT2 N1a LVI | Neg | Neg | Pos | 15 | + | Pos | NA |
| 9 | 74 | 3 | pT4 N2a L1 | Neg | Neg | Neg | Focal | + | Neg | Neg |
| 13 | 64 | 3 | pT2 N0 | Neg | Neg | Neg | Focal | + | Neg | Neg |
| 19 | 47 | 1 | pT1b N0 | 100 | 100 | Neg | Neg | Neg | Neg | Neg |
| 20 | 61 | 3 | pT1b N0 | 100 | 100 | Pos | Neg | Neg | Neg | Neg |
| 17 | 59 | 3 | pT4 N1a L1 | Neg | Neg | Neg | Neg | Neg | Neg | Neg |
* ER = estrogen receptor; G = tumor grade; HER2 = human epidermal growth factor receptor 2; NA = not available, Neg = negative; Pos = positive; PR = progesterone receptor; Pt = patient number.
Expression of brachyury was further evaluated in matched primary carcinoma and metastatic lymph nodes from two patients. As shown in Table 2, brachyury was expressed at higher levels in tumor-positive lymph nodes compared with the primary tumor, whereas the tumor-negative lymph node was negative for brachyury expression in both cases. Representative images are shown in Figure 3 for two matched tissue pairs of primary carcinoma and lymph node metastases (Figure 3, A–D). Additional metastatic lesions (pleura, bone, and brain) also exhibited high levels of brachyury expression (Table 2; Figure 3, E–G).
Table 2.
Expression of brachyury protein in primary and metastatic breast carcinoma lesions by immunohistochemistry using a murine monoclonal antibrachyury antibody*
| Pt | Tissue | Brachyury | |
|---|---|---|---|
| % Positivity | Intensity | ||
| 6 | Breast primary tumor | 30 | + |
| 6 | Met+ lymph node (a) | 90 | + |
| 6 | Met+ lymph node (b) | 90 | + |
| 6 | Nonmet lymph node (c) | Neg | Neg |
| 9 | Breast primary tumor | Focal | + |
| 9 | Met+ lymph node (a) | 60 | ++ |
| 9 | Met+ lymph node (b) | 60 | ++ |
| 9 | Nonmet lymph node (c) | Neg | Neg |
| 31 | Pleura | 90 | + |
| 32 | Bone | 90 | ++ |
| 33 | Bone | 90 | + |
| 34 | Brain | 70 | ++ |
* Matched breast primary tumor and metastatic lymph nodes from two patients and metastatic lesions from additional patients were analyzed for brachyury expression by immunohistochemistry with a murine monoclonal anti-brachyury antibody (Abcam). Two lymph nodes positive for metastasis from each patient (a, b) and one lymph node negative for metastasis from the same patient (c) were assayed. Neg = negative; Met = metastatic; Pt = patient number.
Figure 3.
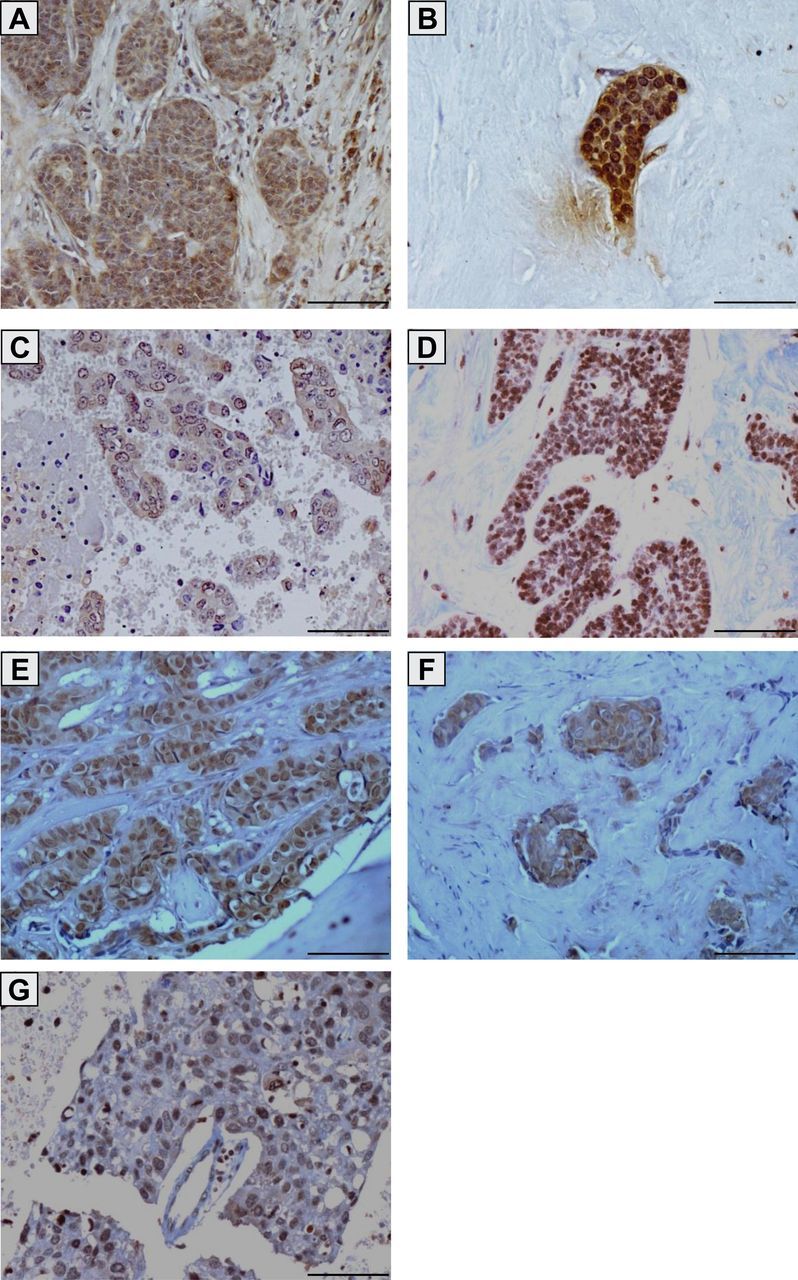
Brachyury protein expression in primary infiltrating ductal carcinomas and breast cancer metastases. Transmitted light photomicrographs of tissue sections stained for brachyury protein expression in a primary infiltrating ductal carcinoma (A) and a corresponding lymph node metastasis (B) from the same patient (patient 6 in Tables 1 and 2); a primary infiltrating ductal carcinoma (C) and a corresponding lymph node metastasis (D) from the same patient (patient 9 in Tables 1 and 2); bone metastatic lesions from two different breast cancer patients (E and F) (patients 32 and 33 in Table 2); and a brain metastatic lesion (G) (patient 34 in Table 2). The brown signal corresponds to brachyury. Magnification ×20. Scale bars = 100 μm.
Brachyury Expression and Prognosis
Breast tumor gene expression data (n = 4010) derived from 23 datasets from the Gene Expression Omnibus at the National Center for Biotechnology Information were compiled (17). Each of the 4010 breast tumor samples was first assigned into a low (lowest 25%), intermediate, or high (highest 25%) subgroup, according to the level of brachyury mRNA expression. Once the three subgroups were established, a Kaplan–Meier estimate of survival was performed in a particular subset of 357 breast cancer patients treated with tamoxifen monotherapy as adjuvant therapy for 5 years after diagnosis (30–32) to evaluate prognosis differences among the three subgroups. The analysis of all three subgroups demonstrated that high brachyury expression was statistically significantly associated with higher risk of recurrence (n = 357; P = .03, Mantel–Cox test) (Figure 4A) and distant metastasis (n = 332; P = .02, Mantel–Cox test) (Figure 4B). A comparison of only the high vs low brachyury expression subgroups showed similar results in terms of higher risk of recurrence (n = 357; hazard ratio [HR] = 2.5; 95% CI = 1.3 to 4.7; P = .007, Mantel–Cox test) and distant metastasis (n = 332; HR = 3.2; 95% CI = 1.5 to 6.9; P = .003, Mantel–Cox test). To minimize the effect of clinical confounding factors such as tumor size, grade, nodal status, age, HER2 status, ER status, and PR status that might cause false-positive association between gene expression and poor prognosis, a Cox proportional hazards regression survival analysis was conducted (n = 270). Supplementary Table 2 (available online) shows the age range and tumor grade of the patients included in each of the three subgroups. In the adjusted model, the analysis of all three subgroups showed that increased expression of brachyury mRNA was statistically significantly associated with higher risk of recurrence (n = 270; P = .003, COXPH) and distant metastasis (n = 270; P = .003, COXPH) (Supplementary Table 3, available online); a comparison of only the high vs low brachyury expression subgroups showed similar results (higher risk of recurrence: n = 270, HR = 7.5, 95% CI = 2.4 to 23.5, P = 5.14×10⁻⁴, COXPH; distant metastasis: n = 270, HR = 15.2, 95% CI = 3.5 to 66.3, P = 3.01×10⁻⁴, COXPH).
Figure 4.
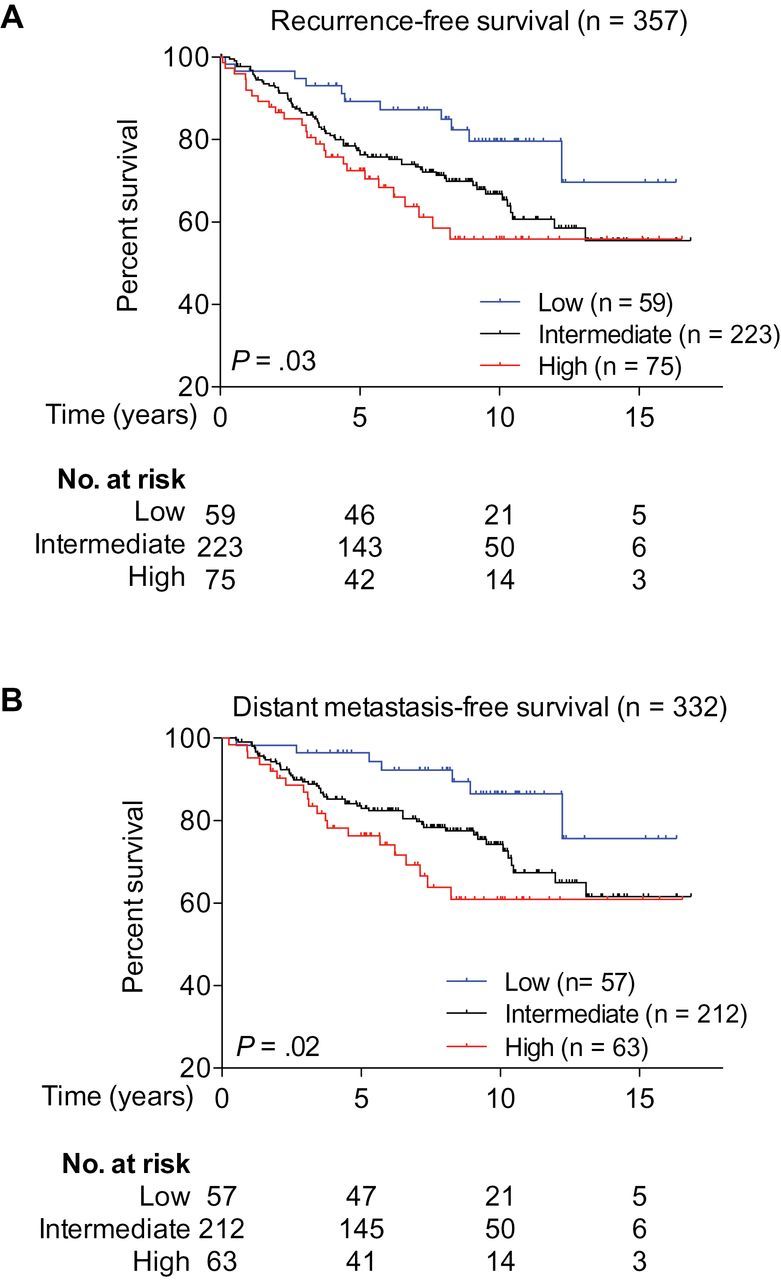
Brachyury expression and prognosis. Kaplan–Meier estimates of recurrence-free survival (A) and distant metastasis-free survival (B) according to brachyury mRNA levels among 357 patients who received adjuvant tamoxifen monotherapy. The low (lowest 25%), intermediate, and high (highest 25%) subgroups were defined based on the level of brachyury mRNA in a cohort of 4010 breast cancer samples that included the 357 patients analyzed here. All statistical tests were two-sided.
To further determine whether brachyury might play a role in modulating tamoxifen resistance instead of facilitating tumor progression, the association between brachyury mRNA expression and prognosis was measured among patients who were treated with conservative surgery/local therapy alone (31–34). Brachyury expression was not associated with higher risk of recurrence among breast cancer patients who did not receive systemic neoadjuvant or adjuvant treatment (n = 609; data not shown). These results thus suggested that brachyury expression might be associated with tamoxifen resistance.
Association of Brachyury Expression With Invasiveness and Mammosphere Formation
To investigate the potential role of brachyury in the biology of breast cancer cells, brachyury gain-of-function and loss-of-function experiments were conducted. These experiments were designed to specifically evaluate whether stable overexpression of brachyury in an epithelial, noninvasive tumor cell line (MCF7) could impart mesenchymal-like features and whether stable silencing of brachyury in a mesenchymal, invasive tumor cell line (MDA-MB-436) could convey epithelial features. As shown in Figure 5A, stable transfection of MCF7 cells with a brachyury-encoding vector (pBrachyury) resulted in a twofold increase in brachyury expression vs control (pcDNA). Functionally, brachyury overexpression in MCF7 cells markedly enhanced their ability to invade the extracellular matrix in vitro (means difference = 14.3; 95% CI = 10.6 to 18.1; P < .001, Student t test) (Figure 5B), upregulated the expression of SOX2 and NANOG, key transcriptional regulators of pluripotency (SOX2 difference = 0.012, 95% CI = 0.011 to 0.013, P < .001, Student t test; NANOG difference: 1.3×10⁻⁵, 95% CI = 8.5×10⁻⁷ to 2.5×10⁻⁵, P = .047, Student t test) (Figure 5C) (35,36), and enhanced the tumor cells’ ability to form mammospheres in culture. The number of mammospheres formed by MCF7-pBrachyury vs control cells was enhanced both in primary and secondary cultures (secondary culture difference = 83.5; 95% CI = 60.2 to 106.8; P = 0.004, Student t test) (Figure 5D), suggesting that MCF7-pBrachyury cells contained an increased number of cells with self-renewal capacity compared with control vector-transfected cells.
Figure 5.
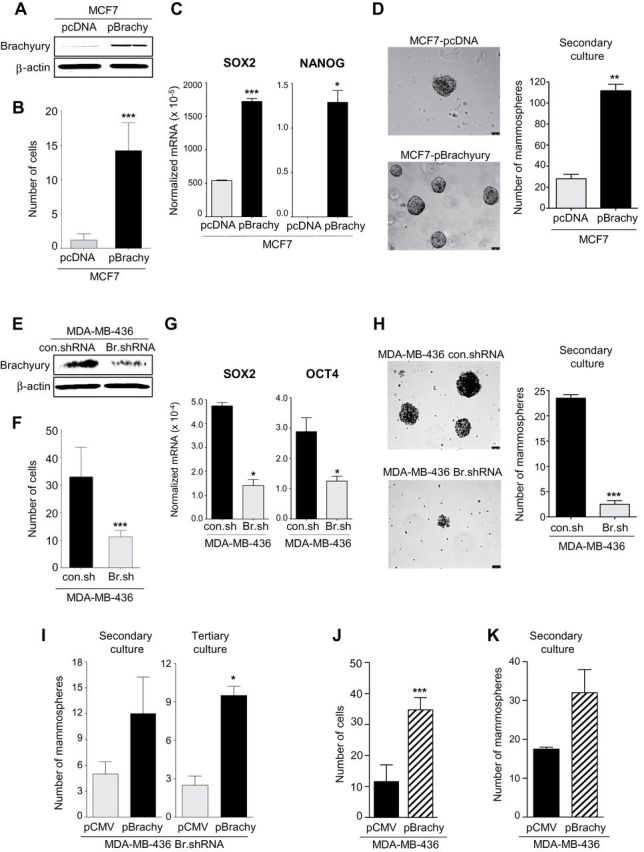
Brachyury promotes invasiveness and mammosphere growth of breast cancer cells. Western blot analysis of brachyury expression in MCF7 cells transfected with a control (pcDNA) vs a full-length human brachyury-encoding vector (A) or MDA-MB-436 cells transfected with a control nontargeting shRNA (con.shRNA) or a brachyury-specific shRNA (Br.shRNA) (E). B and F) In vitro invasion assay conducted with indicated tumor cell pairs. C and G) Real-time polymerase chain reaction analysis of indicated genes in the MCF7 or the MDA-MB-436 tumor cell pair, respectively. Values are expressed as a ratio to the endogenous control GAPDH. D and H) Mammospheres were grown from the MCF7 or the MDA-MB-436 tumor cell pair; bright field images of mammospheres at ×10 magnification (scale bars = 75 μm) and number of mammospheres are shown for secondary cultures in the left and right panels, respectively. I) Number of mammospheres for secondary and tertiary cultures with MDA-MB-436 Br.shRNA cells transfected with a control pCMV vs pBrachyury vector. Invasion assay (J) and number of mammospheres observed with MDA-MB-436 cells transfected with a control pCMV or a pBrachyury vector (K). For invasion assays, bars represent the mean ± standard deviation of at least two identical replicates of a representative dataset from two or more independent experiments. Real-time polymerase chain reaction results are shown as the mean value ± standard deviation of three identical replicates. For mammosphere assays, bars represent the mean ± standard deviation of at least two identical replicates. *P < .05, **P < .005, ***P ≤ .001 by Student t test analysis. All statistical tests were two-sided.
Brachyury loss-of-function experiments were conducted with MDA-MB-436 breast cancer cells; stable transfection with brachyury-specific shRNA (Br.shRNA) resulted in a twofold reduction of brachyury compared with control cells (Figure 5E). Brachyury silencing statistically significantly reduced the ability of MDA-MB-436 cells to invade the extracellular matrix (means difference = −21.8; 95% CI = −29.1 to −14.5; P < .001, Student t test) (Figure 5F), decreased the expression of SOX2 and OCT4 (SOX2 difference = −3.5×10⁻⁴, 95% CI = −4.7×10⁻⁴ to −2.3×10⁻⁴, P = .02, Student t test; OCT4 difference = −1.6×10⁻⁴, 95% CI = −3.1×10⁻⁴ to −1.0×10⁻⁵, P = .04, Student t test) (Figure 5G), and decreased the tumor cells’ ability to form mammospheres in primary and secondary cultures (secondary culture difference = −21.0; 95% CI = −24.0 to −17.9, P = .001, Student t test) (Figure 5H) relative to control-transfected (con.shRNA) cells. As a specificity control, MDA-MB-436 Br.shRNA cells were subsequently transfected with control pCMV or a vector encoding for brachyury and used in mammosphere culture assays. As shown in Figure 5I, brachyury overexpression was able to at least partially rescue the mammosphere-forming phenotype of brachyury-silenced cells as the number of spheroids formed by the MDA-MB-436 Br.shRNA cells transfected to re-express brachyury did not reach the levels observed with MDA-MB-436 control.shRNA cells, as seen in Figure 5H. Brachyury’s rescue effect was observed with secondary and tertiary mammosphere cultures (tertiary culture difference = 7.0; 95% CI = 4.0 to 10.0; P = .01, Student t test). In additional experiments, we also evaluated whether brachyury overexpression could further enhance the invasive and mammosphere-forming abilities of mesenchymal-like tumor cells. Overexpression of brachyury in MDA-MB-436 cells further increased their invasiveness (means difference = 23.2; 95% CI = 16.3 to 30.1; P < .001, Student t test) (Figure 5J) and formation of mammospheres in secondary cultures (Figure 5K), compared with control pCMV-transfected cells.
Brachyury-Mediated Tumor Resistance and T-Cell Cytotoxicity
The role of brachyury in resistance to docetaxel was evaluated with both tumor cell pairs. Silencing of brachyury in MDA-MB-436 cells statistically significantly enhanced the proliferation of the tumor cells in vitro (day 5 difference = 1.1; 95% CI = 0.6 to 1.6; P = .005, Student t test) (Figure 6A) and decreased their survival in response to docetaxel treatment in comparison with the brachyury-high, control shRNA counterparts (docetaxel 1000 difference = −24.5; 95% CI = −33.5 to −15.5; P = .002, Student t test) (Figure 6B). In line with these results, the overexpression of brachyury in MCF7 cells caused a marked reduction of tumor proliferation (day 5 difference = −13.8; 95% CI = −14.2 to −13.3; P < .001, Student t test) (Figure 6C) and statistically significantly enhanced the survival of the tumor cells in response to various doses of docetaxel (docetaxel 1000 difference = 55.7; 95% CI = 53.6 to 57.7; P < .001, Student t test) (Figure 6D). In addition, overexpression of brachyury in the mesenchymal MDA-MB-436 cell line was able to further enhance its survival in response to docetaxel treatment (docetaxel 100 difference = 86.0, 95% CI = 58.8 to 113.2, P = .002, Student t test; docetaxel 1000 difference = 42.0, 95% CI = 25.8 to 58.3, P = .004, Student t test) (Figure 6E).
Figure 6.
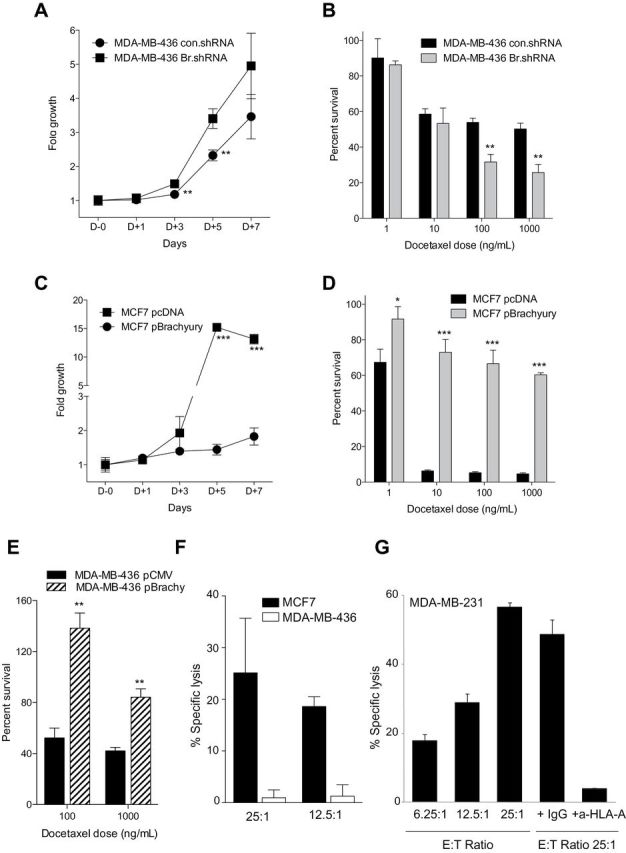
Brachyury-mediated tumor resistance and T-cell mediated cytotoxicity. MDA-MB-436 cells were transfected with a control nontargeting shRNA (con.shRNA) and a brachyury-specific shRNA (Br.shRNA). Tumor cells were evaluated for growth kinetics by the 3-(4,5-dimethylthiazolyl-2)-2,5-diphenyltetrazolium bromide (MTT) assay over a period of 7 days in culture (A) or 5-day survival in response to indicated doses of docetaxel (ng/mL) (B). C) MCF7 cells were transfected with an empty vector (pcDNA) or a Brachyury-encoding vector (pBrachyury) and evaluated by the MTT assay for growth kinetics over a period of 7 days in culture. D) The MCF7 tumor cell pair was treated with indicated doses of docetaxel (ng/mL) and assayed (day 5) for survival in comparison with untreated cells. E) Survival of MDA-MB-436 cells transfected with a control pCMV vs pBrachyury vector in response to indicated doses of docetaxel. F) Brachyury-specific cytotoxic CD8+ T cells expanded in vitro from the blood of a prostate cancer patient by using a human leukocyte antigen A2 (HLA-A2) binding 9-mer peptide of brachyury were able to lyse MCF7 cells that are brachyury positive and HLA-A2 positive, but not the MDA-MB-436 cells that are brachyury positive but HLA-A2 negative. G) An additional breast carcinoma cell line, MDA-MB-231, which is brachyury positive and HLA-A2 positive was also used; brachyury-specific T cells were able to efficiently lyse MDA-MB-231 cells at different effector-to-target cell (E:T) ratios. Tumor lysis was almost completely abrogated by the addition of an anti-HLA-A antibody but not a control immunoglobulin G (IgG). In all panels, bars represent the mean ± standard deviation of at least three identical replicates. Results in panels C, D, E and G are representative of at least two independent experiments. *P < .05, **P ≤ .005, ***P < .001 by Student t test analysis.
To evaluate the potential of an immunotherapeutic approach against brachyury-positive tumors, brachyury-specific cytotoxic T cells were expanded in vitro from the blood of a prostate cancer patient after vaccination with a PSA-TRICOM–based vaccine, using a 9-mer peptide of brachyury that binds to the human leukocyte antigen A2 (HLA-A2) molecule, as previously described (13,14,37). The expanded brachyury-specific cytotoxic T cells were then used as effector cells against breast carcinoma cells. Brachyury-specific cytotoxic T cells were able to lyse MCF7 (Figure 6F) and MDA-MB-231 (Figure 6G) breast carcinoma cell lines, which are both brachyury and HLA-A2 positive, but not MDA-MB-436 cells (Figure 6F), which are brachyury positive but HLA-A2 negative. In addition, the HLA-restricted lytic ability of the brachyury-specific cytotoxic T cells was demonstrated by effective blockade of the lysis in the presence of an HLA-A blocking antibody (Figure 6G). These studies demonstrated that brachyury-specific T cells can efficiently lyse breast carcinoma cells in an HLA-restricted manner.
Discussion
Previous studies have described the selective expression of brachyury mRNA in human cancer cells vs normal adult tissues (13,14). We describe the selective expression of brachyury protein in primary human breast carcinomas, metastatic lymph nodes, and distal metastases of breast cancer, whereas biopsies of histologically normal lymph nodes from breast cancer patients and a variety of benign breast diseases were shown to be negative. Of interest is the finding that histologically “normal” tissue immediately adjacent to breast carcinoma scored positive for some patients, whereas distal breast tissue from those same patients scored negative. Although the reason(s) for this phenomenon remains uncertain at this time, the fibroblastoid nature of these brachyury-positive cells could be the result of EMT of breast carcinoma cells influenced by brachyury. Alternatively, this could be the result of a paracrine effect due to soluble factors (such as interleukin 8 or transforming growth factor β) released by adjacent tumor cells in the tumor microenvironment that could enhance the expression of brachyury (12).
Brachyury is not the only member of the T-box transcription factor family that is upregulated in breast cancer. The human TBX2 and TBX3 gene products have been shown overexpressed in breast cancer cell lines and breast tumors (38–40), and TBX2 has been reported as an EMT driver in normal and malignant breast epithelial cells (41). The studies reported here also show that brachyury protein is detected in up to 90% of breast carcinomas and that the percentage of cells positive (focal–90%) and intensity can greatly vary among tumors. This is not surprising because EMT is a dynamic and reversible process that can be influenced by numerous endogenous and exogenous factors in the tumor microenvironment; immunohistochemistry analyses of tumor biopsy specimens would measure the level of brachyury only at that one point in time.
It is important to point out that extensive work by others has demonstrated the expression of brachyury in chordomas and hemangioblastomas but not in a large variety of carcinomas or normal tissues (42,43). Those studies, based on the use of a polyclonal antibrachyury antibody, have led to the use of brachyury as a diagnostic tool for the diagnosis of chordoma (44). In this study we used a murine monoclonal antibody to detect the expression of brachyury in breast tumor biopsies and cell lines. This monoclonal antibody has been previously shown to react with purified brachyury protein and to detect brachyury in lung tumors but not in the majority of normal tissues evaluated (14). By utilizing brachyury-specific polymerase chain reaction probes, expression of brachyury mRNA has also been observed in a variety of human carcinomas (13). We have also generated T-cell lines specific for a brachyury peptide and have shown that those T cells can lyse a variety of brachyury-positive carcinoma cells (13,14). We therefore believe that the differences observed between our results, including those in this article, and those previously published may be because of the different antibodies used. Different antibodies could differ in their avidity and/or epitope specificity and could also distinctly recognize different brachyury isoforms. It is also possible that various types of tumors (ie, chordoma vs carcinomas) might differentially express different isoforms of brachyury.
The relationship of EMT with tumor cell “stemness” is one that is actively being investigated (4). Induction of EMT in human mammary epithelial cells, for example, has been shown to increase a population of CD44high/CD24low cells with stem-like characteristics (45). The data reported here support this hypothesis. Overexpression of brachyury in breast cancer cells drives tumor invasiveness, upregulates markers of stemness, including the pluripotency regulators SOX2, NANOG, and OCT4, and enhances the ability of the tumor cells to form mammospheres in vitro, a property associated with stem cells. Studies previously conducted with human lung cancer cells showed that tumor cells silenced for the expression of brachyury (H460 Br.shRNA) grew faster than H460 control.shRNA cells when implanted subcutaneously in nude mice but were unable to spontaneously metastasize to the lungs, compared with H460 control.shRNA cells (11,46). These results suggested that brachyury might not be required for primary tumor growth but instead may be critical for tumor dissemination toward the sites of metastases. Brachyury-high breast tumor cells also manifested lower cell proliferation rates in vitro and were more resistant to the cytotoxic effects of docetaxel. The results of the RNA expression data sets shown in Figure 4, in which high expression of brachyury is associated with poor prognosis in patients treated with tamoxifen, further support the involvement of brachyury in resistance to drug therapy.
The phenomenon of EMT has been previously associated with highly aggressive tumors of the basal-like subtype (7). One limitation of this study concerns the relatively low number of samples (n = 30) evaluated for expression of the brachyury protein by immunohistochemistry, including primary and metastatic breast cancer tissues. Immunohistochemical analysis of brachyury expression in a larger sample cohort will be important to define whether the level of brachyury protein in the primary tumor is an independent variable with various clinical characteristics, including tumor stage, grade, lymph node status, and/or distal metastases, and whether brachyury is expressed in a defined breast cancer subtype(s) (47).
Numerous studies have shown that the EMT process is important in tumor cell migration, invasion, and drug resistance, and that several different transcription factors can drive the EMT process. We have shown here that brachyury is distinct from many of these other factors in its selective expression in human carcinomas vs normal breast tissue. Transcription factors are difficult to target because of their location in the nucleus and the lack of a hydrophobic pocket for conventional small molecule binding. We have shown, however, that one can generate brachyury human T cells (13), which in turn can lyse human breast carcinoma cells. This has led to the generation of a vector-based vaccine expressing brachyury that is currently being evaluated in a phase I clinical trial (15). The studies reported here thus provide the rationale for the use of this and other brachyury targeting vaccines as monotherapy or in combination therapies for the treatment of various stages of human breast carcinoma.
Funding
This research was supported in part by the Intramural Research Program of the Center for Cancer Research, National Cancer Institute, National Institutes of Health; the Italian Ministry of Instruction, University and Research (MERIT, grant code RBNE08NKH7); and Department of Defense Breast Cancer Research Program–Clinical Translational Research Award (Proposal Title, “Developing a HER3 Vaccine to Prevent Resistance to Endocrine Therapy”/Principal Investigator: Dr. Herbert K. Lyerly/Period of Performance: 30 September 2012–29 September 2017/Contract No. -W81XWH-12-1-0574).
Supplementary Material
The authors declare that they have no competing interests.
We thank Margie Duberstein for technical assistance and Debra Weingarten for her editorial assistance.
References
- 1. Thiery JP, Sleeman JP. Complex networks orchestrate epithelial-mesenchymal transitions. Nat Rev Mol Cell Biol. 2006;7(2):131–142. [DOI] [PubMed] [Google Scholar]
- 2. Kalluri R, Weinberg RA. The basics of epithelial-mesenchymal transition. J Clin Invest. 2009;119(6):1420–1428. [DOI] [PMC free article] [PubMed] [Google Scholar]
- 3. Thiery JP. Epithelial–mesenchymal transitions in tumour progression. Nat Rev Cancer. 2002;2(6):442–454. [DOI] [PubMed] [Google Scholar]
- 4. Polyak K, Weinberg RA. Transitions between epithelial and mesenchymal states: acquisition of malignant and stem cell traits. Nat Rev Cancer. 2009;9(4):265–273. [DOI] [PubMed] [Google Scholar]
- 5. Hanahan D, Weinberg RA. Hallmarks of cancer: the next generation. Cell. 2011;144(5):646–674. [DOI] [PubMed] [Google Scholar]
- 6. Blick T, Widodo E, Hugo H, et al. Epithelial mesenchymal transition traits in human breast cancer cell lines. Clin Exp Metastasis. 2008;25(6):629–642. [DOI] [PubMed] [Google Scholar]
- 7. Sarrio D, Rodriguez-Pinilla SM, Hardisson D, et al. Epithelial–mesenchymal transition in breast cancer relates to the basal-like phenotype. Cancer Res. 2008;68(4):989–997. [DOI] [PubMed] [Google Scholar]
- 8. Creighton CJ, Li X, Landis M, et al. Residual breast cancers after conventional therapy display mesenchymal as well as tumor-initiating features. Proc Natl Acad Sci U S A. 2009;106(33):13820–13825. [DOI] [PMC free article] [PubMed] [Google Scholar]
- 9. Kispert A, Koschorz B, Herrmann BG. The T protein encoded by Brachyury is a tissue-specific transcription factor. EMBO J. 1995;14(19):4763–4772. [DOI] [PMC free article] [PubMed] [Google Scholar]
- 10. Edwards YH, Putt W, Lekoape KM, et al. The human homolog T of the mouse T(Brachyury) gene; gene structure, cDNA sequence, and assignment to chromosome 6q27. Genome Res. 1996;6(3):226–233. [DOI] [PubMed] [Google Scholar]
- 11. Fernando RI, Litzinger M, Trono P, et al. The T-box transcription factor Brachyury promotes epithelial-mesenchymal transition in human tumor cells. J Clin Invest. 2010;120(2):533–544. [DOI] [PMC free article] [PubMed] [Google Scholar]
- 12. Fernando RI, Castillo MD, Litzinger M, et al. IL-8 signaling plays a critical role in the epithelial–mesenchymal transition of human carcinoma cells. Cancer Res. 2011;71(15):5296–5306. [DOI] [PMC free article] [PubMed] [Google Scholar]
- 13. Palena C, Polev DE, Tsang KY, et al. The human T-box mesodermal transcription factor Brachyury is a candidate target for T-cell-mediated cancer immunotherapy. Clin Cancer Res. 2007;13(8):2471–2478. [DOI] [PubMed] [Google Scholar]
- 14. Roselli M, Fernando RI, Guadagni F, et al. Brachyury, a driver of the epithelial-mesenchymal transition, is overexpressed in human lung tumors: an opportunity for novel interventions against lung cancer. Clin Cancer Res. 2012;18(14):3868–3879. [DOI] [PMC free article] [PubMed] [Google Scholar]
- 15. ClinicalTrials.gov. Open label study to evaluate the safety and tolerability of GI-6301 a vaccine consisting of whole heat-killed recombitant yeast genetically modified to express brachyury protein in adults with solid tumors. http://www.clinicaltrials.gov/ct2/show/NCT01519817 Accessed February 25, 2014.
- 16. College of American Pathologists. HER2 testing guidelines and resources. http://www.cap.org/apps/cap.portal Accessed February 25, 2014.
- 17. Cheng Q, Chang JT, Geradts J, et al. Amplification and high-level expression of heat shock protein 90 marks aggressive phenotypes of human epidermal growth factor receptor 2 negative breast cancer. Breast Cancer Res. 2012;14(2):R62 [DOI] [PMC free article] [PubMed] [Google Scholar]
- 18. Anderson WF, Chu KC, Chatterjee N, et al. Tumor variants by hormone receptor expression in white patients with node-negative breast cancer from the surveillance, epidemiology, and end results database. J Clin Oncol. 2001;19(1):18–27. [DOI] [PubMed] [Google Scholar]
- 19. Bardou VJ, Arpino G, Elledge RM, et al. Progesterone receptor status significantly improves outcome prediction over estrogen receptor status alone for adjuvant endocrine therapy in two large breast cancer databases. J Clin Oncol. 2003;21(10):1973–1979. [DOI] [PubMed] [Google Scholar]
- 20. Carey LA, Perou CM, Livasy CA, et al. Race, breast cancer subtypes, and survival in the Carolina Breast Cancer Study. JAMA. 2006;295(21):2492–2502. [DOI] [PubMed] [Google Scholar]
- 21. Darb-Esfahani S, Loibl S, Muller BM, et al. Identification of biology-based breast cancer types with distinct predictive and prognostic features: role of steroid hormone and HER2 receptor expression in patients treated with neoadjuvant anthracycline/taxane-based chemotherapy. Breast Cancer Res. 2009;11(5):R69. [DOI] [PMC free article] [PubMed] [Google Scholar]
- 22. Guarneri V, Broglio K, Kau SW, et al. Prognostic value of pathologic complete response after primary chemotherapy in relation to hormone receptor status and other factors. J Clin Oncol. 2006;24(7):1037–1044. [DOI] [PubMed] [Google Scholar]
- 23. Blanco MJ, Moreno-Bueno G, Sarrio D, et al. Correlation of Snail expression with histological grade and lymph node status in breast carcinomas. Oncogene. 2002;21(20):3241–3246. [DOI] [PubMed] [Google Scholar]
- 24. Elloul S, Elstrand MB, Nesland JM, et al. Snail, Slug, and Smad-interacting protein 1 as novel parameters of disease aggressiveness in metastatic ovarian and breast carcinoma. Cancer. 2005;103(8):1631–1643. [DOI] [PubMed] [Google Scholar]
- 25. Come C, Magnino F, Bibeau F, et al. Snail and slug play distinct roles during breast carcinoma progression. Clin Cancer Res. 2006;12(18):5395–5402. [DOI] [PubMed] [Google Scholar]
- 26. Martin TA, Goyal A, Watkins G, et al. Expression of the transcription factors snail, slug, and twist and their clinical significance in human breast cancer. Ann Surg Oncol. 2005;12(6):488–496. [DOI] [PubMed] [Google Scholar]
- 27. Mironchik Y, Winnard PT, Jr., Vesuna F, et al. Twist overexpression induces in vivo angiogenesis and correlates with chromosomal instability in breast cancer. Cancer Res. 2005;65(23):10801–10809. [DOI] [PMC free article] [PubMed] [Google Scholar]
- 28. Wang SM, Coljee VW, Pignolo RJ, et al. Cloning of the human twist gene: its expression is retained in adult mesodermally-derived tissues. Gene. 1997;187(1):83–92. [PubMed] [Google Scholar]
- 29. Paznekas WA, Okajima K, Schertzer M, et al. Genomic organization, expression, and chromosome location of the human SNAIL gene (SNAI1) and a related processed pseudogene (SNAI1P). Genomics. 1999;62(1):42–49. [DOI] [PubMed] [Google Scholar]
- 30. Desmedt C, Giobbie-Hurder A, Neven P, et al. The Gene expression Grade Index: a potential predictor of relapse for endocrine-treated breast cancer patients in the BIG 1–98 trial. BMC Med Genomics. 2009;2:40. [DOI] [PMC free article] [PubMed] [Google Scholar]
- 31. Loi S, Haibe-Kains B, Desmedt C, et al. Definition of clinically distinct molecular subtypes in estrogen receptor-positive breast carcinomas through genomic grade. J Clin Oncol. 2007;25(10):1239–1246. [DOI] [PubMed] [Google Scholar]
- 32. Loi S, Haibe-Kains B, Majjaj S, et al. PIK3CA mutations associated with gene signature of low mTORC1 signaling and better outcomes in estrogen receptor-positive breast cancer. Proc Natl Acad Sci U S A. 2010;107(22):10208–10213. [DOI] [PMC free article] [PubMed] [Google Scholar]
- 33. Desmedt C, Piette F, Loi S, et al. Strong time dependence of the 76-gene prognostic signature for node-negative breast cancer patients in the TRANSBIG multicenter independent validation series. Clin Cancer Res. 2007;13(11):3207–3214. [DOI] [PubMed] [Google Scholar]
- 34. Wang Y, Klijn JG, Zhang Y, et al. Gene-expression profiles to predict distant metastasis of lymph-node-negative primary breast cancer. Lancet. 2005;365(9460):671–679. [DOI] [PubMed] [Google Scholar]
- 35. Rodriguez-Pinilla SM, Sarrio D, Moreno-Bueno G, et al. Sox2: a possible driver of the basal-like phenotype in sporadic breast cancer. Mod Pathol. 2007;20(4):474–481. [DOI] [PubMed] [Google Scholar]
- 36. Lengerke C, Fehm T, Kurth R, et al. Expression of the embryonic stem cell marker SOX2 in early-stage breast carcinoma. BMC Cancer. 2011;11:42. [DOI] [PMC free article] [PubMed] [Google Scholar]
- 37. Madan RA, Mohebtash M, Arlen PM, et al. Ipilimumab and a poxviral vaccine targeting prostate-specific antigen in metastatic castration-resistant prostate cancer: a phase 1 dose-escalation trial. Lancet Oncol. 2012;13(5):501–508. [DOI] [PMC free article] [PubMed] [Google Scholar]
- 38. Jacobs JJ, Keblusek P, Robanus-Maandag E, et al. Senescence bypass screen identifies TBX2, which represses Cdkn2a (p19(ARF)) and is amplified in a subset of human breast cancers. Nat Genet. 2000;26(3):291–299. [DOI] [PubMed] [Google Scholar]
- 39. Fan W, Huang X, Chen C, et al. TBX3 and its isoform TBX3+2a are functionally distinctive in inhibition of senescence and are overexpressed in a subset of breast cancer cell lines. Cancer Res. 2004;64(15):5132–5139. [DOI] [PubMed] [Google Scholar]
- 40. Yarosh W, Barrientos T, Esmailpour T, et al. TBX3 is overexpressed in breast cancer and represses p14 ARF by interacting with histone deacetylases. Cancer Res. 2008;68(3):693–699. [DOI] [PubMed] [Google Scholar]
- 41. Wang B, Lindley LE, Fernandez-Vega V, et al. The T box transcription factor TBX2 promotes epithelial-mesenchymal transition and invasion of normal and malignant breast epithelial cells. PLoS One. 2012;7(7):e41355. [DOI] [PMC free article] [PubMed] [Google Scholar]
- 42. Vujovic S, Henderson S, Presneau N, et al. Brachyury, a crucial regulator of notochordal development, is a novel biomarker for chordomas. J Pathol. 2006;209(2):157–165. [DOI] [PubMed] [Google Scholar]
- 43. Tirabosco R, Mangham DC, Rosenberg AE, et al. Brachyury expression in extra-axial skeletal and soft tissue chordomas: a marker that distinguishes chordoma from mixed tumor/myoepithelioma/parachordoma in soft tissue. Am J Surg Pathol. 2008;32(4):572–580. [DOI] [PubMed] [Google Scholar]
- 44. O’Donnell P, Tirabosco R, Vujovic S, et al. Diagnosing an extra-axial chordoma of the proximal tibia with the help of brachyury, a molecule required for notochordal differentiation. Skeletal Radiol. 2007;36(1):59–65. [DOI] [PubMed] [Google Scholar]
- 45. Mani SA, Guo W, Liao MJ, et al. The epithelial-mesenchymal transition generates cells with properties of stem cells. Cell. 2008;133(4):704–715. [DOI] [PMC free article] [PubMed] [Google Scholar]
- 46. Huang B, Cohen JR, Fernando RI, et al. The embryonic transcription factor Brachyury blocks cell cycle progression and mediates tumor resistance to conventional antitumor therapies. Cell Death Dis. 2013;4:e682. [DOI] [PMC free article] [PubMed] [Google Scholar]
- 47. Sims AH, Howell A, Howell SJ, et al. Origins of breast cancer subtypes and therapeutic implications. Nat Clin Pract Oncol. 2007;4(9):516–525. [DOI] [PubMed] [Google Scholar]
Associated Data
This section collects any data citations, data availability statements, or supplementary materials included in this article.