Abstract
Photoacoustic tomography (PAT) can offer structural, functional and molecular contrasts at scalable observation level. By ultrasonically overcoming the strong optical scattering, this imaging technology can reach centimeters penetration depth while retaining high spatial resolution in biological tissue. Recent extensive research has been focused on developing new contrast agents to improve the imaging sensitivity, specificity and efficiency. These emerging materials have substantially accelerated PAT applications in signal sensing, functional imaging, biomarker labeling and therapy monitoring etc. Here, the potentials of different optical probes as PAT contrast agents were elucidated. We first describe the instrumental embodiments and the measured functional parameters, then focus on emerging contrast agent-based PAT applications, and finally discuss the challenges and prospects.
1 Introduction
Optical imaging provides rich contrast in biological tissues based on their distinct chemical components. In principle, pure optical imaging modalities can be categorized into ballistic and diffusive imaging systems. Ballistic optical imaging methods such as optical coherence tomography (OCT),1 fluorescence microscopy (FM),2 confocal microscopy (CM),3 and two-photon microscopy (TPM)4 have profoundly advanced biophotonics. However, the incident photons in tissue, after optical transport mean free path (~1 mm), severely suffer from strong diffusion and thus lose optical coherence and focusing properties. Consequently, the shallow penetration depth of ballistic optical imaging in scattering medium fundamentally hampers their application in biomedicine.
Diffuse optical tomography (DOT) utilizes near-infrared (NIR) lasers to detect absorption properties and scattering coefficients of biological tissues. In contrast to ballistic imaging, DOT can reach centimeters beyond the optical scattering limit into tissue but lacks adequate spatial resolution.5,6 It still remains a great challenge for pure optical imaging to maintain both superb spatial resolution and deep penetration depth. Since ultrasonic scattering in biological tissues is at least two orders of magnitude weaker than optical scattering, deep penetration can be achieved by pulse-echo ultrasound (US). Despite the high spatial resolution, pure ultrasonic imaging that relies on differences in acoustic impedance often leads to weak contrast and speckle artifacts in soft tissues.7,8 Luckily, by converting the incident photons into US emission, photoacoustic (also termed optoacoustic) tomography (PAT) can ultrasonically breakthrough the optical diffusion limit in biological tissue. PAT hybridizes both the merits of rich optical contrast and high ultrasonic resolution, but alleviates their shortcomings in a single modality, permitting anatomical, functional, molecular and genetic imaging.
Photoacoustic (PA) phenomenon was first discovered by Alexander G. Bell in 1880.9 In his experiment, Bell observed that a thin sheet of material exposed to a sunlight beam, rapidly interrupted by a rotating slotted disk, emitted an audible sound signal and different materials produced different tones. However, the real application of this technique had to wait almost a century until the development of sensitive sensors and intense light sources for spectroscopy analysis. In 1971, PA spectroscopy was reported to be sensitive enough to detect a concentration of 0.01 part per million (ppm) of nitrogen oxide (NOx) pollution in air samples.10 By virtue of laser technology and biomedical nanotechnology, the interest in this topic has increased exponentially in the early 21st century, and is probably the fastest-growing imaging field recently.11,12
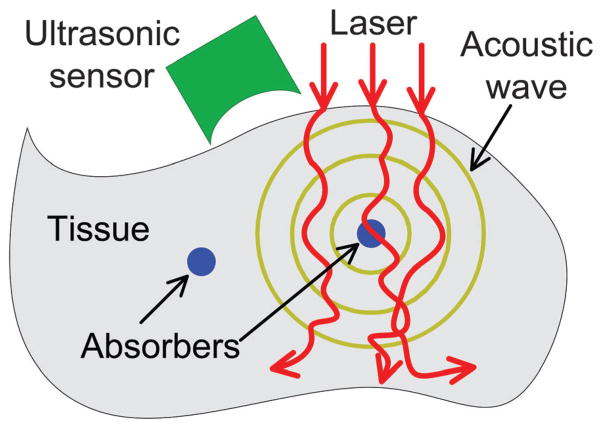
The PA effect is based on acoustic wave generation induced by optical excitation, the principle of which is illustrated in Fig. 1. When a pulsed (or intensity-modulated) laser beam irradiates a biological tissue, a small temperature rise in the tissue leads to thermo-elastic expansion that will produce ultrasonic waves. Theoretically, only 1 mK temperature leap can generate about 800 Pa pressure rise that is far beyond the noise level of a typical ultrasonic transducer.13 The acoustic pressure, after propagating in the tissue and coupling medium, can be received by an ultrasonic transducer to reconstruct a PA image of optical absorption. When the excitation source is replaced by radio-frequency or microwave, the technique is termed thermoacoustic tomography, which reflects the dielectric properties of the tissue.14
Fig. 1.
Schematic illustration of laser-induced PA effect in biological tissue.
The inherent contrast of PAT depends on the chemical compositions of endogenous contrast agents such as hemoglobin,15 melanin,16 lipid,17 and myoglobin.18 Nevertheless, many diseases and physiological processes usually manifest little or insufficient intrinsic PAT contrast. Therefore, it is highly essential and required to develop functional contrast agents for fully utilizing PAT potentials. Emerging exogenous contrast agents include synthesized nanostructures, pigments, chromophores, reporter genes, and even their derivatives. Versatile and effective nano-platforms could contribute in exquisite sensitivity and diagnostic specificity enhancement, functional parameter quantification and physiological activity etc. The technical advancements of PAT and translation of research applications to clinical diagnosis are also discussed. It is anticipated that PAT aided by nanotechnology will elicit broad interest and provide guidance in material chemistry, medical instrument engineering, disease diagnosis, vascular biology and oncology therapeutics, etc.
2 Photoacoustic tomography instrumental embodiments
2.1 Photoacoustic tomography (PAT)
2.1.1 Circular scanning configuration-based PAT
In circular scanning configuration, the laser beam usually irradiates the entire imaged sample from the top, and the ultrasonic transducer circularly scans around the sample to collect PA signals at different angles (Fig. 2a). Various types of acoustic detectors can be employed due to their flexibility: single transducer, curved acoustic array, virtual point transducer, ring-based or high numerical aperture (NA) transducer and integrated transducer (line or plane) etc. Single flat transducers have been widely used in PAT owing to low cost, wide availability and high sensitivity. However, most flat transducers have relatively small acceptance angles which limit the imaging field-of-view (FOV).19 Correspondingly, a negative lens added to the transducer surface or virtual point concept transducer was proposed to achieve a much larger signal acceptance angle.20,21
Fig. 2.
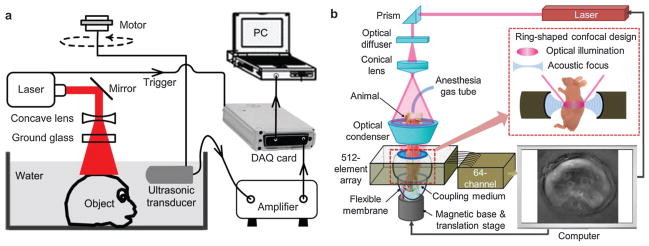
(a) Circular scanning PAT using single ultrasonic transducer.21 (b) 512-element full-ring PAT system.30
Universal back-projection (also referred to as sum-and-delay) algorithm offers exact reconstruction solution and is the most widely used reconstruction method for PAT.22,23 However, back-projection algorithm ignores the acoustic heterogeneity and assumes that the transmission medium is homogeneous. On the contrary, time-reversal method is a popular imaging reconstruction algorithm to compensate for acoustic heterogeneities.24,25 A k-space time-reversal model was established to incorporate speed-of-sound mapping and attenuation distribution in a freely available toolbox of Matlab.26,27 Forward and back-projection operators were also implemented for computing numerical solutions to the PA wave equation, which can mitigate the effects of incomplete data and disturbing noises.28
Mechanical scanning of a single transducer at hundreds of different angles can be time-consuming, thus a set of transducers or an acoustic array has been proposed to shorten the data acquisition (DAQ) time. A 128-element ultrasonic transducer arc array was presented for a rapid and high-resolution PAT system.29 Meanwhile, a 16-channel parallel data-acquisition module allowed capture of a complete 360° scan via sample rotation within 15 s.29 Furthermore, an upgraded 512-element full-ring ultrasonic array with 64 parallel acquisition channels was designed for whole-body animal imaging as shown in Fig. 2b.30 The full-ring signal receiving configuration eliminated mechanical scanning and guaranteed a full two dimensional (2D) view aperture with acquisition time of 1.6 s per frame.31,32 This high-speed PAT system enabled dynamic metabolism and functional connectivity mapping of the mouse brain.33,34
In a similar way, a multispectral optoacoustic tomography (MSOT) scanner was developed for biochemical marker imaging in preclinical studies.35,36 A piece of 64-element piezocomposite with a central frequency of 5 MHz was arranged in a spherical concave curve array spanning 172°. Multi-wavelength irradiation is capable of imaging endogenous chromophores, exogenous fluorescent proteins and biomarkers.37 Alternatively, a concave arc-shaped array of 64-element transducers was designed to acquire PAT images.38 The phantom or mouse is excited orthogonally by two beams of light from a bifurcated fiber bundle. The system can image the entire mouse body including individual organs and blood vessels with a sub-millimeter resolution.38,39
2.1.2 Linear ultrasound array-based PAT
Adaptation of commercially available US scanner is a low-cost and time-saving way to implement PAT. By adding light delivery, a commercial linear or 2D matrix US array was modified to collect PA signals, which greatly reduced the scanning time.40–42 As shown in Fig. 3a, a clinical US system (iU22; Philips Healthcare, MA) was modified to evaluate in vivo sentinel lymph node (SLN) mapping for PAT.43 Light from a tunable laser was delivered through a fiber bundle to illuminate the target. Raw PA and US signals were collected by a parallel DAQ system for post processing and image display. The handheld probe simplified the experimental procedure and subject handling, making it highly translatable to bedside clinic.
Fig. 3.
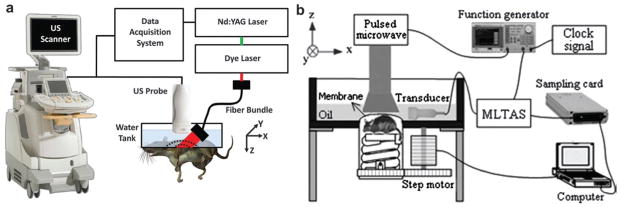
(a) Modified B-mode US scanner for dual PAT/US imaging of SLN.43 (b) Experimental setup of TAT system adapted from a commercial US imaging system.45
Since each element in the transducer array has limited receiving angle, a limited-field-filtered back-projection algorithm with a weight factor was proposed to confine the signal contribution, improving the lateral resolution from 1.5 mm to 0.24 mm.44 In the same way, a modified B-mode US system with linear array transducer was applied for TAT shown in Fig. 3b. In this geometry, mechanical scanning is no longer mandatory. The DAQ time for primary monitoring at one observing stop is determined by the laser repetition rate (usually 0.1 or 0.05 s). For full-view imaging, a 10-stop rotation around the sample is sufficient to obtain a clear and accurate image.45 This system has been used for foreign body detection,46 breast cancer imaging,47 and targeted molecular imaging.48
A small-animal PAT scanner (Vevo LAZR) was also modified from US equipment by Visualsonics Inc. to provide a dual-mode PA-US imaging capability that is now commercially available. The system equipped with a 21 MHz linear array provides three dimensional (3D) visualization, tumor imaging and oxygen saturation measurement.49 A 590-element PVDF plane array transducer has been used in the Twente PA mammoscope for clinical trials of human breast imaging.50,51 The downside is that the scan time is relatively long (~30 min per frame) and the spatial resolution (2–4 mm) demands further improvement. Although an ultrasonic transducer is ubiquitous with ultrasonography in Department of Radiology, the PAT image quality acquired from linear array systems tends to be suboptimal, particularly for shallow tissue imaging. This weakness is partially due to limited detection aperture and low sensitivity (small detection area in each element) of the linear array transducer. Further improvements, for example, sensing sensitivity enhancement and sophisticated reconstruction algorithm are still expected to match the image quality of dedicated PAT systems.
2.1.3 Hemisphere array-based PAT
Although circular scanning mode is the most widespread PAT modality, the incomplete DAQ configuration neglects the PA pressures that propagate along the cylindrical axis. Thus the spatial resolution is inhomogeneous in the FOV and becomes worse when away from the scanning center.21 In addition, the elevational resolution (along the cylindrical axis) of 3D PAT is about ten times worse than the in-plane resolution. Receiving signal from every solid angle is highly desirable because PA pressures are produced omnidirectionally to the whole space. To this end, a NIR pulse laser serves as the light source and 128 flat ultrasonic transducers are spirally located on a hemispherical surface to collect PA signals for 3D image reconstruction (Fig. 4a).52 The bowl structure facilitates the PA signal receiving from as many solid angles as possible, resulting in a homogeneous resolution distribution in the PA images. Owing to the unique configuration, the PAT system can provide an isotropic and homogeneous spatial resolution of ~200 μm in a large FOV with a diameter of ~30 mm. The NIR laser used as the excitation source can deeply penetrate biological tissue (up to centimeters). This imaging modality has been explored for angiogenesis imaging, therapy monitoring,52 and human breast angiography.53,54 Lateral and anterior–posterior maximum intensity projection (MIP) images of the left breast of a patient are shown in Fig. 4b and c, respectively. Breast vasculature was successfully visualized to a depth of 40 mm with a surprisingly high contrast.
Fig. 4.

(a) Schematic of 128-element hemisphere array-based PAT.52 The pulsed laser beam was expanded by a concave lens at the bottom of the imaging bowl, and then irradiated on the object. 128 single transducers were spirally located on the hemispherical surface to collect PA signals. (b) Lateral MIP image of a human breast using hemisphere array PAT.53 (c) Anterior–posterior MIP image of the human breast using hemisphere array PAT.53 Image area: ~9 × 9 cm2.
2.2 Photoacoustic microscopy (PAM)
2.2.1 Acoustic-resolution photoacoustic microscopy (AR–PAM)
PA microscopy (PAM) refers to the imaging modality where a PA image is captured by collecting signal pixel-by-pixel in an imaging grid. A focused ultrasonic transducer is employed to detect PA signals primarily from the focal zone of the transducer. The detection at each pixel contributes to an A-line signal and a B-scan image is completed after scanning along a line. A set of B-scan images are then assembled to form a 3D image without reconstruction algorithm as in PAT. There are two types of PAM technique depending on the resolution scale: acoustic-resolution PAM (AR–PAM) and optical-resolution PAM (OR–PAM). When a focused US detector is used, it is named AR–PAM because the imaging resolution is determined by the US propagation and detection. When a focused laser beam is used, it is called OR–PAM since the resolution is dependent on the focused laser beam size in the tissue.
In AR–PAM embodiment, dark-field laser illumination is usually adopted to minimize unwanted skin signals as depicted in Fig. 5. A collimated laser beam is first expanded by a conical lens, and then irradiates a condenser which converges the ring beam in the focusing zone of an ultrasonic transducer.55 In this geometry, the focus point of the laser beam is coincident with that of the ultrasonic transducer for maximum signal detection. The PAM system permits multiwavelength imaging of various contrasts and allows high resolution with a ratio of maximum imaging depth to resolution larger than ~100.55,56 In vivo tumor angiogenesis imaging and hemoglobin oxygen saturation (sO2) mapping have been conducted on living subjects with such system.
Fig. 5.
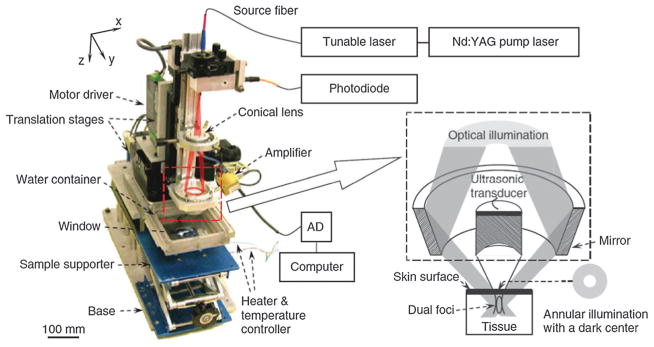
Schematic illustration of an AR–PAM system.55 The optical illumination and ultrasonic detection are in a coaxial confocal configuration for high sensitivity imaging.
2.2.2 Optical-resolution photoacoustic microscopy (OR–PAM)
A second embodiment of PAM with finer resolution but shallower depth is optical-resolution (OR) mode where optical instead of acoustic focusing is the key factor.57,58 An OR–PAM system was developed for high-sensitivity imaging of small capillaries shown in Fig. 6.59 A high NA microscope objective was used to focus the laser beam onto the tissue surface through an optically transparent acoustic reflector. Meanwhile, the acoustic reflector guides the PA signals to a US transducer that was placed next to the laser path. Analogous to AR–PAM, the 3D OR–PAM image can be acquired by raster scanning the focused excitation beam and the transducer together.
Fig. 6.
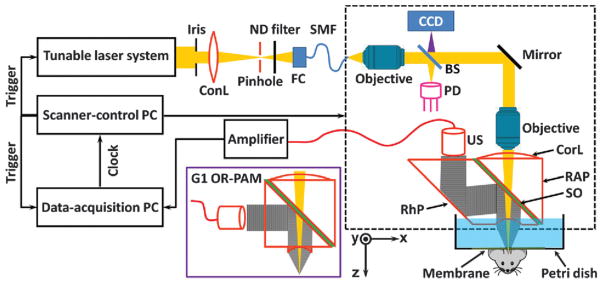
Schematic illustration of OR–PAM for small capillary imaging.59
By approaching the optical diffraction limit, the beam size of focused laser can be adjustable to submicron or even hundreds of nanometers to image deliberate anatomy.60,61 The functional imaging capabilities permit OR–PAM preclinical biological studies, for instance, oxygen delivery and metabolism at capillary level. Blood vessels and capillaries in a mouse ear showing a packed capillary bed were clearly imaged as displayed in Fig. 7.59 The zoomed region from the dashed blue square in the left image revealed the detailed structure and red blood cells (RBCs) in a capillary on the right image. Despite the high in-plane resolution, the disadvantage is that the vertical resolution (in depth) is order of magnitude worse than lateral resolution since it depends on acoustic detection and thus is limited by detector bandwidth.
Fig. 7.
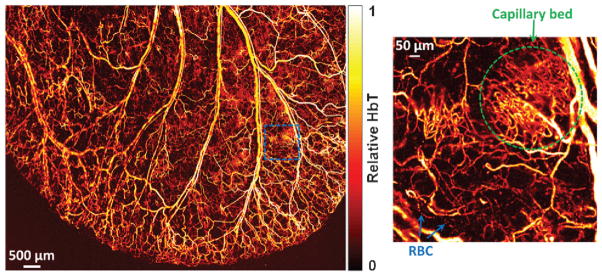
OR–PAM of blood vessels in a living mouse ear with a zoomed region showing capillary structure and individual RBCs moving in a single capillary.59
Single-cell detection is critical in assessing circulating tumor cells (CTCs) in blood vessels as indicators of cancer metastasis. Flow cytometry by transferring cells into a single file flow was conducted with a laser after hydrodynamic focusing.62 However, the extraction of cells from a living system may change cell properties, which also lead to potential unnecessary complications. Similar to OR–PAM, PA flow cytometry (PAFC) with optical focusing to generate PA signals was used to probe isolated live melanoma cells suspended in saline solution flowing through a tube.63 Functionalized magnetic nanoparticles (NPs) targeted receptors in breast cancer cells, then bound and captured CTCs by a magnet near the blood vessel.64 The PA pressure was generated when the targeted CTCs passed through the optical focused zone. The benefits of PAFC include high sensitivity and high specificity by binding interested cells with different contrast agents and using spectroscopy detection. The application examples included real-time detection of circulating red and white blood cells in different functional states (e.g., normal and apoptotic),65 and exogenous nanoparticles.66
For ophthalmological study, an anterior segment and ciliary body region were imaged in ex vivo pig eyes.67 Because the laser spot size was much less than the US focal zone width, OR–PAM demands much higher repetition rate of the excitation laser.68 At the same time, OR–PAM images provide much better resolution than those obtained using conventional US or AR–PAM system. An OR–PAM system compatible with OCT and auto-fluorescence imaging was also developed for ophthalmoscopy, allowing anatomic and functional retinal characterizations.69,70 However, clinical applications (except for ophthalmic application) of OR–PAM are unavoidably limited owing to the relatively short penetration depth (~1 mm).
2.2.3 Fabry–Perot sensor-based PAM
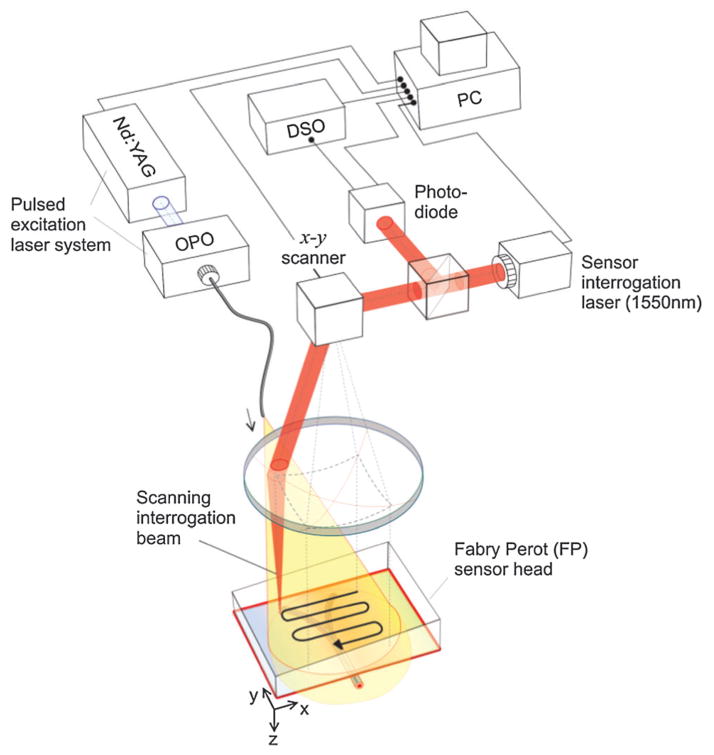
Piezoelectric ceramic is the most popularly used material in photoacoustics, its detection sensitivity, however, declines with decreasing aperture size. A higher frequency transducer offers higher spatial resolution at the expense of signal-to-noise ratio (SNR). To mitigate this issue, optical sensing, such as a Fabry–Pérot interferometer (FBI) that consists of a polymer film spacer sandwiched between a pair of reflective surfaces was used to detect weaker acoustic signals at high frequencies.71,72 Briefly, a tunable optical parametric oscillator (OPO) laser system supplied optical pulses to generate PA signals from the entire tissue, which was in acoustic coupling with the FP sensor. The arriving PA wave modulated the optical thickness of the film, thus changing the reflectivity of the reflective surfaces as shown in Fig. 8.73 A second focused continuous wave (CW) laser, as an interrogation beam, irradiated the FBI film that is transparent to the excitation laser beam. The variations of the reflected CW light intensity can be converted to pressure at the detection spot for imaging forming.
Fig. 8.
Schematic of Fabry–Pérot interferometer used for PAM imaging.73
Raster scanning the interrogation beam over the film is equivalent to scanning a single-element sensor with laser spot for AR–PAM and OR–PAM. The high-sensitivity FPI and wideband acoustic performance enable this unique detector to image superficial blood vessels underneath the skin. Besides subcutaneous vasculature, the system has been applied as an imaging tool for tumor angiogenesis and mouse brain cortex.74,75 By use of higher repetition rate laser or parallelizing the sensor read-out system, there is space to speed up the DAQ for real-time imaging.
3 Functional parameters measured by photoacoustic tomography
3.1 Hemodynamic physiology
The primary physiological function of blood is to supply oxygen, nutrients and ingredients to all tissues and to purge waste products, which in return reflects cardiovascular health and life quality. A significant portion of cardiovascular diseases is related to hemo-dynamic physiology disorders and dysfunction. Functional measurement of hemodynamic patterns is regarded as a key criterion of physiology status.76 Hemoglobin, the core element of blood, is the dominant absorbing target among various intrinsic optical contrasts in biological tissue. The absorption coefficient of hemoglobin is approximately six orders of magnitude higher than the surrounding tissues. As a result, PAT can clearly image RBC-perfused blood vessels without background signal. As a workhorse, hemoglobin has been explored for functional PAT in hemodynamic change,77 oxygen saturation mapping, tumor angiogenesis and hypoxia,78 as well as metabolic rate of oxygen.79,80 Hemodynamic-based PAT holds great potential in both fundamental life science and clinical practice for promising applications such as ischemia,81 vascular disorders,82 strokes,83 diabetes,84 and epileptic seizures.85
3.2 Oxygen partial pressure (pO2) and oxygen saturation (sO2)
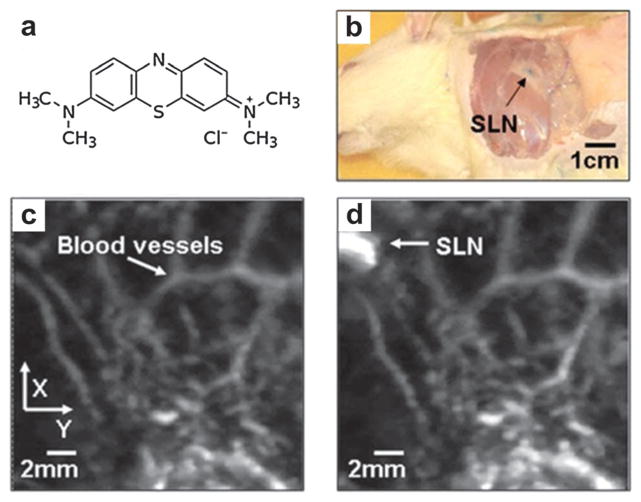
Oxygen partial pressure (pO2) that is proportional to the dissolved oxygen concentration directly measures the oxygen available to RBCs. Measuring pO2 in vasculature using phosphorescence lifetime quenching has been well developed.86 However, fluorescent signal measurement cannot resolve spatial position because of light scattering, which limits the clinical application. Instead of fluorescent measurement, the PA technique was proposed for accurately localizing and measuring the excited state lifetime of oxygen sensitive dyes, such as Pt(II) octaethylporphyrin (PtOEP) and methylene blue (MB).87–89
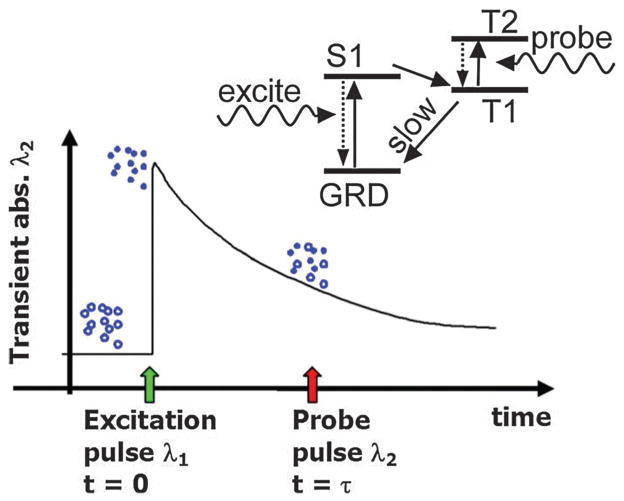
A schematic illustration of the pO2 measurement is depicted in Fig. 9. A first laser pulse was used to excite the dye from ground state to its first singlet state (S1), then to a triplet state (T1) within several picoseconds. The population on the excited state (T1) decayed back to the ground state by phosphorescence and quenching via collisions with oxygen molecules. The decay process was relatively slow (~50 μs for PtOEP) and relied on surrounding oxygen concentration. A probe pulse at different wavelength was irradiated at time τ to generate a PA response leading to the T1 to T2 transition. By changing the time delay (τ) between the pulses, the decay of the excited state population could be recorded. Since the optical absorption at the excited state (T1) is distinct from that at the ground state, PA signal intensities can reflect the different populations of the excited and ground states and hence deduce the oxygen pressure.
Fig. 9.
Oxygen partial pressure measurement by PA lifetime detection with phosphorescent oxygen sensitive dye.87
In general, hemoglobin exists in two modes: HbO2 (saturated with oxygen) and Hb (desaturated with oxygen). The amount of oxygen bound to the hemoglobin is largely related to pO2 which the hemoglobin is exposed to. Typically, sO2 is high at the presence of high pO2, e.g. in the lung, whereas sO2 is relatively low when pO2 drops, e.g. in the end tissue. PA signal amplitudes of blood vessels depend on the concentrations of HbO2 and Hb. Therefore, spectroscopic measurements at two (or more) wavelengths can be performed to quantify the proportion and thus sO2 by solving linear equations.90 However, direct use of the PA temporal signals could be unreliable because the received acoustic waves are distorted by the limited bandwidth of the ultrasonic transducer. Alternatively, the distortion effect of PA signals can be eliminated by analyzing the acoustic spectra at two wavelengths.91 The caveat of this analytic method is that acoustic spectra analysis is self-calibrating and insensitive to absolute optical fluence.
3.3 Tumor angiogenesis and hypoxia
Angiogenesis supplies oxygen and nutrients to cancer and benefits tumor proliferation and spread (metastasis). As a tumor outgrows the blood supply, a portion (usually the center) of the tumor over-consumes oxygen and this results in a hypoxic microenvironment. The neovascularization level and sO2 value in tumor would be superb indicators to evaluate its pathological status and spread potential. PAT is capable of imaging neovascularization and segment microvessel architecture responses to angiogenesis inhibitors, establishing a method to the study of ischemic and tumor angiogenesis.92,93 PAT images of neovessels and sO2 were demonstrated on a tumor model bearing U87MG glioblastoma.94 The tumor area showed much higher PA signals than normal area, which suggested probable angiogenesis. The tumor center manifested much lower sO2 than the surrounding normal tissue, indicating hypoxic tumor vasculature. Moreover, the normal vessels tended to have lower total hemoglobin in addition to a higher sO2 and a lower sO2 fluctuation than the tumor vessels.
3.4 Metabolic rate of oxygen (MRO2)
pO2 and sO2 are static oxygenation parameters in living subjects. In comparison, metabolic rate of oxygen (MRO2) or oxygen release rate can reflect the dynamic rate of oxygen consumption, which can be considered as a gradient of sO2 with certain speed. Accurately measuring MRO2 can be helpful for fundamental pathophysiological studies and even prognosis and disease therapy. If the region of interest (ROI) has well-defined feeding and draining vessels, MRO2 can be measured by the following equation:79,80
where ε is the oxygen binding ability of hemoglobin and is considered as a constant, CHb is the total concentration of hemoglobin, sO2 is the average oxygen saturation, A is the cross-sectional area of the blood vessel, v is the average velocity of blood flow, and W is the weight of the ROI. Subscripts ‘in’ and ‘out’ denote feeding and draining blood vessels, respectively. All the above parameters can be locally quantified in real-time PAT systems.
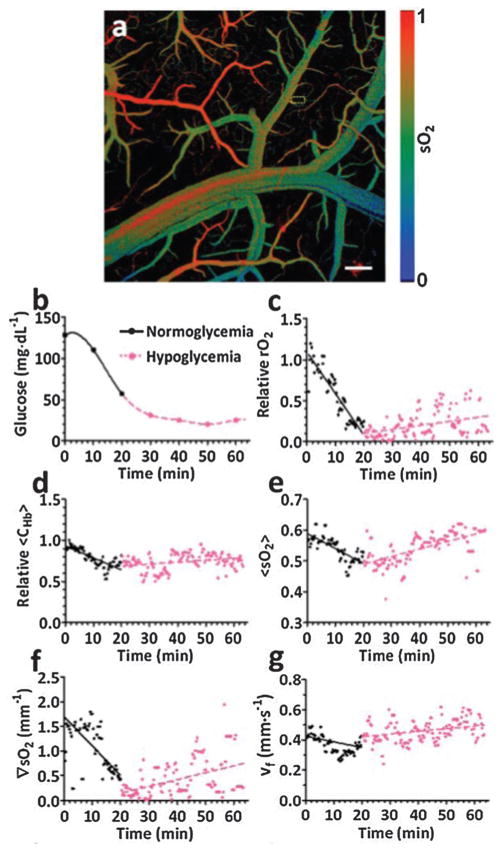
In cellular aerobic respiration, the oxygen release rate is in linear relationship with metabolic rate of glucose. Therefore, measuring metabolic rate of oxygen is critical to study the metabolism of cells and their relevant functionalities. At single RBC level, MRO2 was imaged by PA flowoxigraphy in the living brain as shown in Fig. 10.80 To induce an acute hypoglycemia condition, insulin (30 IU kg−1) was injected subcutaneously to the mouse. Functional PAT images over a large FOV of a mouse brain, with a typical sO2 image shown in Fig. 10a, were collected at 100 Hz for over 1 h immediately after the injection. The blood glucose concentration was continuously monitored by a glucose meter by drawing blood through a tail vein every 10 min. The decrease of the blood glucose level with time from the glucose meter readout was shown in Fig. 10b.
Fig. 10.
(a) A typical sO2 mapping of a mouse brain cortex through a small craniotomy.80 Scale bar = 200 μm. (b) Blood glucose levels by glucose meter acquired every 10 min after insulin injection.80 (c–g) MRO2, CHb, sO2, ∇sO2 and v calculated from single-RBC PA images. 80
The physiological phase was defined as hypoglycemia when the glucose concentration was less than 58.5 mg dL−1 or normoglycemia when the glucose concentration was larger than (or equivalent to) 58.5 mg dL−1. Fig. 10c–g show various functional parameters including MRO2, CHb, sO2, ∇sO2 (gradient of sO2), and v deduced from the PA images and averaged over every second. It can be seen that MRO2 decreased with decreasing glucose concentration (Fig. 10c), which was consistent with the measurements by a glucose meter. The other functional parameters, including CHb, sO2, ∇sO2 and v, decreased as well. The experimental results, especially the MRO2, show clear and prompt responses due to glucose level change. The strong correlation between external stimulus and single-RBC oxygen delivery indicates a potential oximetry approach to studying brain functions at the single cellular level.
4 Metallic nanoparticles as photoacoustic tomography contrast agents
4.1 Gold-based nanostructures
Metallic NPs have been highly attractive as research topics and are now extensively utilized in diagnostic imaging because of their unique physicochemical and optical properties. The optical absorption mechanism of different gold nanoconstructs such as gold nanorods (GNRs), nanoshells, nanocages, nanostars, nanotripods and nanovesicles is based on localized surface plasmon resonance (LSPR). Plasmonic NPs in different architectures and dimensions can be fabricated for unique optical signatures. The synthesis methods vary greatly for different types of particles, seed-mediated growth is one typical and versatile approach. In the growth protocol, small (2–5 nm) spherical particles, serving as ‘seeds’ are added to a solution of bulk metallic ions. The ions are gradually reduced and absorbed on the surfaces of the seeds. Seeds are then added to growth solution to control the deposition rate and thus the product growth rate. By changing some crucial growth parameters, NPs in myriad shapes other than spheres can be obtained. More details about the synthesis procedures have been introduced in the literature.95,96
Plasmonic Au nanostructures have opened a wide range of applications: photothermal therapy (PTT),97 imaging contrast agents and drug delivery vehicles, etc.98,99 Furthermore, colloidal gold NPs have been used in clinic particularly to treat rheumatoid arthritis for decades,100 which are unlikely to bring toxicity concerns that have limited other PA imaging agent.101 The favorable surface chemistry of gold NP with their relative inertness allows affinity conjugating to various functional biomolecules including antibodies, ligands and drugs of interest.102,103
4.1.1 Gold nanorods
Among various gold nanostructures, GNR exhibits tunable, intense and narrow absorption peaks in the near infrared (NIR) region. This rod-shaped NPs, with transmission electron microscopy (TEM) image shown in Fig. 11a, have attracted considerable attention as molecular probes for PAT of inflammatory response and tumor imaging.104,105 A seed-mediated GNR synthesis method involves addition of citrate-capped gold spheres as seeds to the gold salt (HAuCl4) growth solution.106 The monodisperse reaction product can be obtained by the reduction of HAuCl4 with ascorbic acid (vitamin C) in the presence of cetyltrimethylammonium bromide (CTAB) surfactant and silver ions. A dose of 200 μL of 5.4 nM GNRs with 756 nm absorption peak was injected through the tail vein to a tumor-bearing mouse. As shown in Fig. 11b, subcutaneous xenografts of the ovarian cancer were clearly imaged due to passive targeting of GNRs.105 The PA signal increase was obviously observed on a wide variety of ovarian tumor types including 2008, HEY and SKOV3 cell lines.105 The boundary between tumor and normal tissue could be visualized via surface-enhanced Raman spectroscopy (SERS) imaging with GNRs.
Fig. 11.

GNRs as optical contrast agents for PAT. (a) TEM of GNR with aspect ratio of 3 : 1.107 (b) PA images of GNR on A, MDA-435S tumor (positive control) B, 2008 C, HEY, and D, SKOV3 ovarian tumor models before (upper panel) and after (lower panel) tail-vein injection of 200 μL of 5.4 nM GNR.105
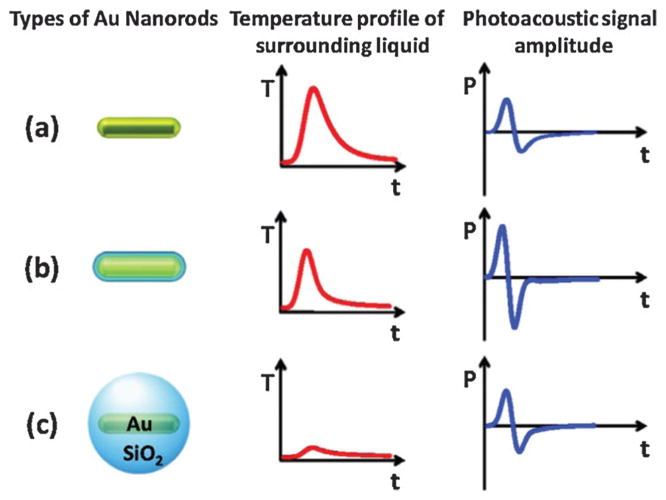
Silica coating of gold NPs provides a simple method to enhance their performance as contrast agents. Silica-coated GNR were reported to produce about 3-fold higher PA signals and 5-fold more cell uptake than GNR without silica coating.108,109 The extra PA signal boost is attributable to the reduction of the gold interfacial thermal resistance with the solvent by silica.108 As shown in Fig. 12a, GNR without shell has broader a heat peak and weak PA signal amplitude owing to their interfacial properties. After coating with a silica shell, GNR has reduced interfacial resistance and a sharper profile peak while the amplitude decreased due to the heat capacity of silica. Thus the PA signal amplitude increases correspondingly as shown in Fig. 12b. At a very large thickness, the influence of the silica coating is stronger leading to a further reduced and broader temperature peak, however, and a decrease in the PA signal as shown in Fig. 12c.
Fig. 12.
Mechanism schematic of the silica coating to the PA signal effect of (a) a bare GNR, (b) a thin silica shell coating GNR, and (c) a very thick silica shell coating GNR.108
4.1.2 Gold nanocages
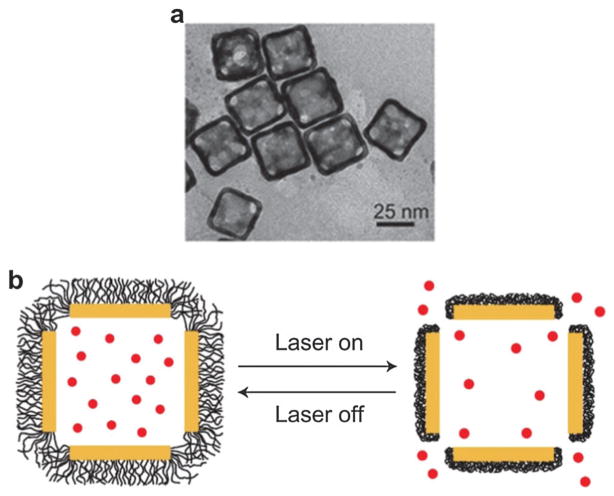
Gold nanocages (GNCs) are cubic, hollow and porous NPs with size range from 30–100 nm (TEM shown in Fig. 13a). They can be synthesized by simple galvanic replacement reaction between silver nanocubes and metal precursor (HAuCl4) in solution.110 Ag nanocubes can be obtained by a facile method based on polyol reduction.111 Because of the hollow interior and porous wall, GNC can also be used as delivery vehicles by encapsulating drugs. Thermally responsive polymers such as poly(N-isopropylacrylamide) (pNIPAAm) were used to cover the nanocage surface with effector loaded in the cavity.112 Under NIR laser, the polymer chains will collapse in response to temperature variation and thus the pre-loaded drug will be released to the disease site as shown in Fig. 13b. When the stimulation is turned off, the temperature will decrease and the polymer chains will cover the pores again, terminating the release. The encapsulated effector could be a disease-specific drug or functional molecule. The stimulation source could be replaced by high-intensity focused ultrasound (HIFU) or a specific enzyme.113 However, the GNC concentration, drug loading and laser irradiation parameters need to be optimized to further improve the therapeutic efficacy.
Fig. 13.
(a) TEM of gold GNCs at size of ~35 nm.114 (b) Schematic illustrating GNC covered by smart polymers activatable by laser irradiation.112 Upon exposure to laser, the light is absorbed by GNC and converted into heat, stimulating smart polymer collapse and release of the preloaded drug.
Due to the large scattering and absorption cross sections, GNCs are excellent optical contrast agents for OCT,115 photo-thermal cancer treatment,116 and PAT.117 PAT of cerebral cortex in a rat brain was demonstrated by using GNCs as intravascular contrast agents.118 A maximum 80% PA signal enhancement in the brain cortex was observed ~4 h after injection of GNC solution.118 In an animal model, SLN perfused with GNCs as deep as 3.3 cm underneath the skin surface were identified with good contrast.119 PAT with GNCs may potentially eliminate the invasive axillary staging procedures for SLN identification and imaging.
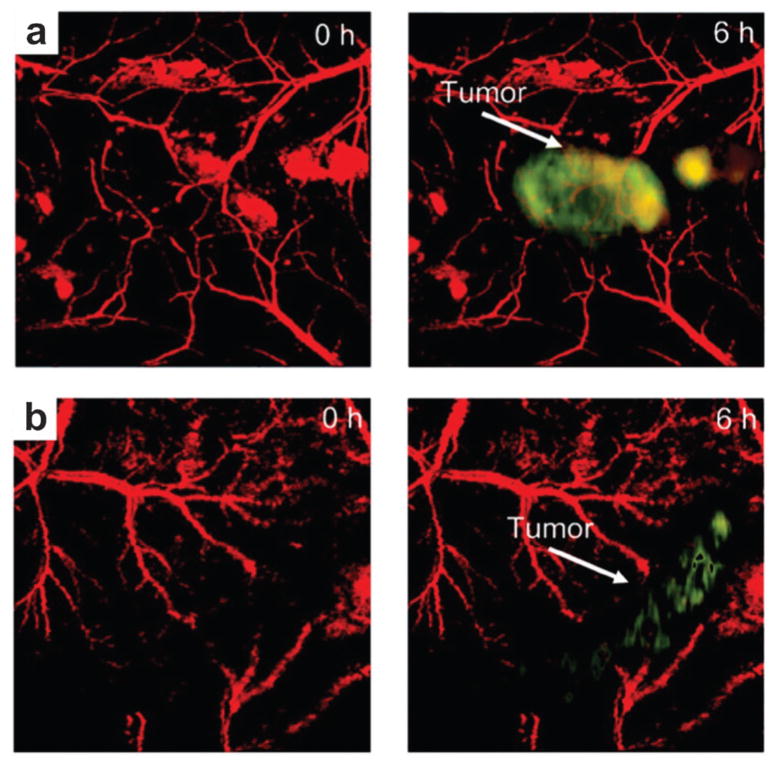
In another study, GNC conjugated with [Nle4, D-Phe7]-α-melanocyte-stimulating hormone was used for PAT of melanomas with both high sensitivity and specificity.120 Blood vessels and melanoma were imaged at 570 and 778 nm, respectively, and then overlapped in one image by different pseudo-colors (Fig. 14).120 GNC conjugated with [Nle4, D-Phe7]-α-MSH as active targeting (Fig. 14a) provided 3-fold higher PA signal enhancement than that of PEG–GNC as passive targeting (Fig. 14b) to melanoma. On the other hand, GNCs are not appropriate as contrast agents for long-time optical imaging monitoring due to photothermal instability.
Fig. 14.
PA imaging of B16 melanoma after tail-vein injection of 100 μL GNC solution with a concentration of 10 nM.120 Pseudo-red denotes blood vessels while pseudo-yellow denotes the melanoma in PA amplitude. (a) MIP PA images of B16 melanomas using [Nle4, D-Phe7]-α-melanocyte-stimulating hormone conjugated GNCs. (b) MIP PA images of B16 melanomas using only PEG–GNC.
4.1.3 Gold nanostars
Gold nanostar (GNS) is plasmon-tunable in the NIR region with great absorption-to-scattering ratio. The absorption cross section of GNS can be orders of magnitude higher than dye molecules because of high surface-to-volume ratio. The large particle surface of GNS (TEM shown in Fig. 15a) can be linked to many functional molecules such as antibodies or ligands. Cyclic arginine–glycine–aspartic acid (RGD) peptides were reported to possess high affinity to vasodilatation related integrin αvβ3 overexpressed by neovessels in tumors.121,122 By conjugating RGD with GNS, tumor angiogenesis mapping, PTT of tumor vascularization, and monitoring of the treatment response were designed in one single theranostic platform.52 A schematic diagram of the RGD–GNS targeting integrin αvβ3 on endothelial cells in the blood vessel of tumor is shown in Fig. 15b.
Fig. 15.
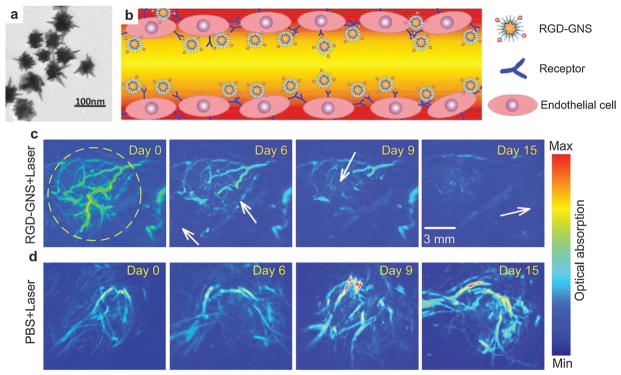
GNSs as contrast agents for PA angiography and PTT.52 (a) TEM of GNSs. (b) Schematic illustration of the RGD–GNS targeting integrin αvβ3 on endothelial cells of neovessels in the tumor. (c) PA angiography monitoring of therapy response of PTT by RGD–GNS and laser irradiation. (d) PA angiography monitoring of tumor therapy response by only laser irradiation.
The theranostic ability of RGD–GNS was validated on U87MG glioma bearing mice by CW laser irradiation.52 The MIP images of the tumor revealed significantly enhanced signals and better image contrast in the RGD–GNS group, while no remarkable change was observed in PBS injected control group. Six hours after injection, PTT was carried out with a laser power density of 1 W cm−2 at 790 nm for 10 min. PA scanning was implemented at different days (day 0, 6, 9, 15) post-injection to evaluate the tumor response to PTT treatment. Inhibition of blood vessels and decrease of contrast can be found in RGD–GNS treated group after PTT treatment (Fig. 15c), suggesting the disruption of neovasculature from laser irradiation. In the control group, no noticeable reduction indicates that the blood vessels cannot be destroyed by laser irradiation only (Fig. 15d). Chlorin E6 (Ce6) conjugated GNS were used to perform simultaneous photodynamic therapy (PDT)/PTT for synergistic anticancer efficiency.123 In another study, in vivo PA detection of rat SLN by GNS was demonstrated toward lymphangiography.124
4.1.4 Gold nanoshells
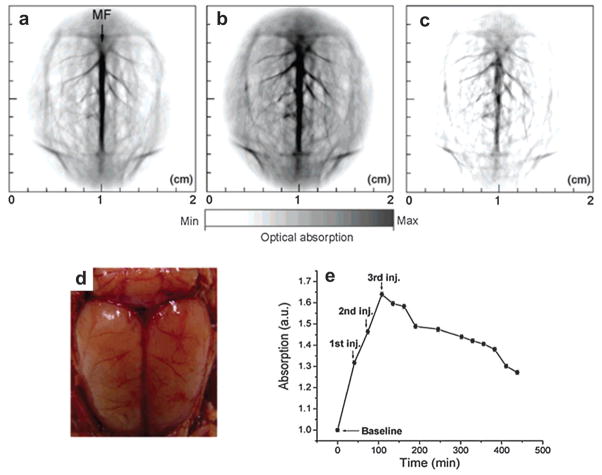
Gold nanoshell (GNSh) consists of a dielectric silicon dioxide core coated with a gold shell. The LSPR effect arises from the collective oscillation of conduction electrons in the shell structure where the electrons oscillate with all the ions and efficiently couple the light into heat.125,126 The absorption peak of the nanoshell in the NIR region is tunable by varying the silica core size relative to the thickness of the gold shell. Poly(ethylene glycol)-coated nanoshells circulating in rat brain vessels were continuously mapped in vivo.127 Three successive injections of the GNSh as indicated by the arrows in Fig. 16e, each with a dose of ~0.8 × 10⁹ nanoshells g−1 body weight, were administered to the rat through intravenously (iv) injection. PA image acquisition of the rat brain cortex was performed ~5 min after each injection. Circular scanning with a step size of 1.5° was adopted to acquire data at different angles around the rat brain. A flat ultrasonic transducer with a central frequency of 10.4 MHz was used to detect the PA signals. The DAQ time to obtain a 2D image slice was ~24 min.
Fig. 16.
PAT of a rat brain aided by GNSh.127 MF: median fissure. PAT of rat brain acquired, (a) before, (b) 20 min after the administrations of nanoshells. (c) Differential image that was obtained by subtracting the pre-injection image from the post-injection image. (d) Open skull photograph of the rat brain cortex obtained after the data acquisition for PAT. (e) The averaged PA signals at different time points.
PAT image of the rat brain cortex before injection of GNSh is presented in Fig. 16a.127 The PAT image acquired 20 min after the third administration of the nanoshell contrast agent (Fig. 16b) shows the brain vasculature with enhanced contrast. With the exogenous contrast agent, the optical absorption of the blood was increased and the contrast between the vessels and the background tissues was also enhanced. The differential PAT image (Fig. 16c), subtraction of Fig. 16a from Fig. 16b, mapped the exogenous GNSh distribution in the rat brain. The photograph of the rat brain after removing both scalp and skull is shown in Fig. 16d. The quantified PA signal curve in Fig. 16e depicts the signal enhancement and clearance in the blood circulation system.
A dark-field confocal PAM with a 50 MHz focused transducer was used to image progressive extravasation and accumulation of nanoshells within a solid tumor.128 PEGylated GNSh with a peak optical absorption of ~800 nm was administered through a tail vein. The PA results show that nanoshell accumulation was more concentrated within the tumor boundary and largely absent from the tumor core. Similar to GNC, doxorubicin instead of silica was loaded onto hollow GNSh for both local drug release and PTT of tumor, which was simultaneously monitored by fluorescence imaging and PAT.129 The disadvantage is that large GNSh NPs tend to show slow clearance from the body, hindering the clinical application.130 It is also interesting to note that nanoshells exhibit more scattering properties than absorption.131
4.1.5 Gold nanovesicles (GNVs)
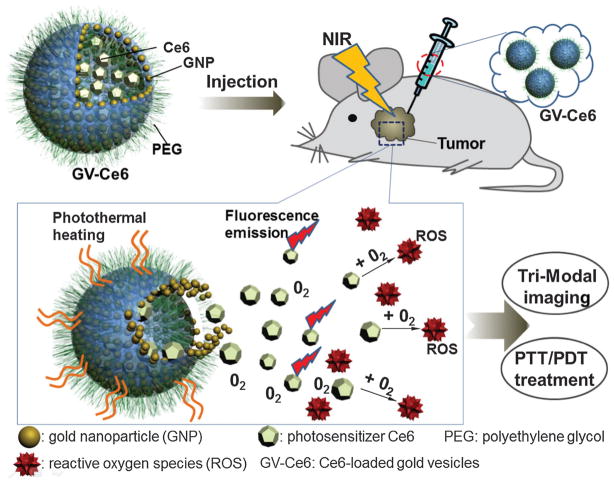
A biodegradable gold nanovesicle (GNV) composed of poly(ethylene glycol)-b-poly-(ε-caprolactone) (PEG-b-PCL)-tethered Au NPs was reported for both PAT and PTT.132–134 The scanning electron microscopy (SEM) and TEM images are shown in Fig. 17a and b, respectively. The vesicular assemblies by monolayer shell of densely packed nanoconstruct are illustrated in the TEM images (Fig. 17c and d). A photosensitizer, Ce6, was encapsulated in GNV for trimodality imaging by local injection: PAT, fluorescence and thermal imaging with the scheme shown in Fig. 17e. Laser irradiation at 671 nm was used to simultaneously excite both GNV and Ce6 to generate heat and singlet oxygen, thus killing cancer cells. The heating effect upon laser irradiation allowed the Ce6-loaded GNVs to dissociate Ce6 molecules. Meanwhile the efficient loading of Ce6 on GNVs greatly increased the accumulation of Ce6 to cancer cells.
Fig. 17.
Photosensitizer (Ce6)-loaded plasmonic gold vesicles (GVs) for trimodality fluorescence/thermal/photoacoustic imaging guided synergistic photo-thermal/photodynamic cancer therapy.133
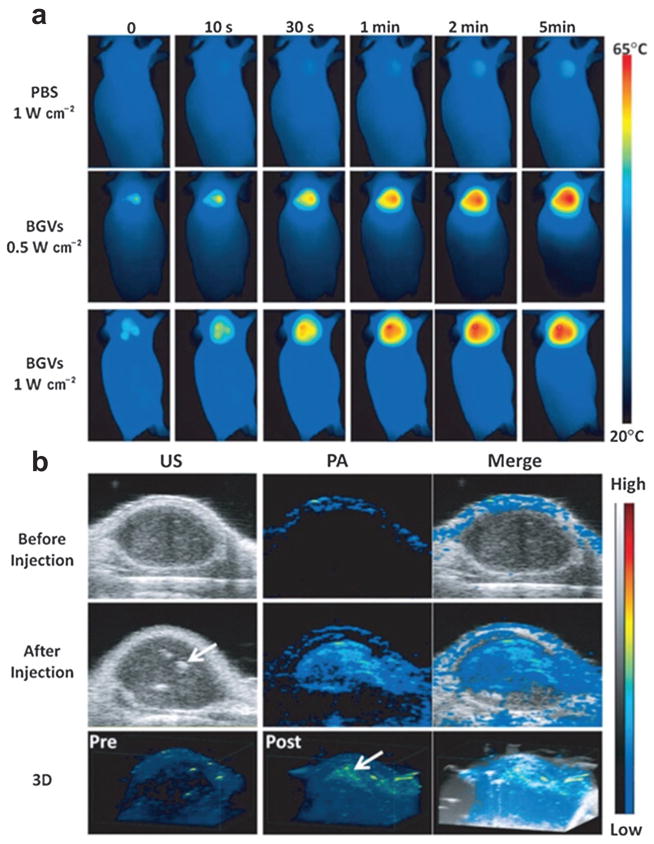
The feasibility of GNV for in vivo photothermal/PA imaging and PTT was demonstrated in a MDA-MB-435 tumor xenograft model.132 50 μL GNV at a concentration of 0.4 mg mL−1 was intratumorally injected to the tumor after its size reached ~60 mm3. In vivo thermal imaging (Fig. 18a) with an infrared thermal camera was used to monitor the treatment efficacy of the tumors under 808 nm laser irradiation with a power of 0.5 W cm−2. The local tumor temperature rapidly rose by over 18 °C within 5 min, which was high enough to kill tumor cells in vivo. However, no significant temperature increase was observed in other normal body parts of the mice. Compared with GNRs, GNVs showed a much stronger PA signal at the same optical density (OD) at 808 nm. PAT images of the tumor before and after intratumoral injection of GNVs are displayed in Fig. 18b. As can be seen, the PA signal in the tumor was significantly amplified after GNV administration. However, there are still some technical barriers to overcome before further application. For example, the large dimension of GNV poses a great challenge for longer blood circulation because they will easily be uptaken by reticuloendothelial system (RES). Systemic study of toxicity assessment and in vivo pharmacokinetics is also needed.
Fig. 18.
(a) In vivo thermal images of MDA-MB-435 tumor-bearing mice receiving 808 nm laser irradiation for 5 min after the injection of PBS or GNVs.132 (b) In vivo 2D and 3D PA/US images of tumor before and after the injection of GNV.132 Obvious PA signal enhancement was observed in the tumor. Arrows indicate the location of GNV accumulation.
4.1.6 Gold nanotripods
An anisotropic, branched, gold nanostructure (Au tripod) with size less than 20 nm was developed for PA imaging.135 The Au tripod structure is illustrated in the schematic (Fig. 19a) with the TEM image shown in Fig. 19b. To test the tripod’s in vivo application, U87MG tumor-bearing mice were iv injected with 100–200 μL of RGD conjugated Au-tripods (200 pmol kg−1 mouse body weight) in PBS. As shown in Fig. 19c, the coronal, sagittal and transverse views of PA and US images of the tumors were obtained before and 1, 2 and 4 h after injection. The pseudo-green represents PA signals while the gray colormap represents ultrasound signals. Quantitative analysis indicated that RGD conjugated Au nanotripods gradually accumulated in the tumor between 1 and 4 h, reaching a plateau 2 h post-injection due to the positive targeting. The mice injected with RGD–Au-tripods 2 h post-injection showed more than three times greater PA signal in the tumor than the blocking group (injected with both RGD and RGD–Au-tripods).
Fig. 19.
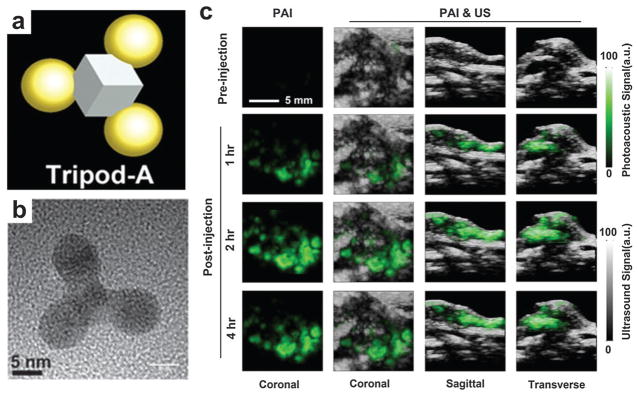
Gold nanotripods as contrast agents for PAT.135 (a) Schematic illustrating the structure of Au nanotripods. (b) TEM image of Au nanotripods. (c) The coronal, sagittal and transverse views of PA and US images of nude mice bearing U87MG tumors were obtained before and 1, 2 and 4 h after iv injection of RGD–Au-tripod (2 mg kg−1 of mouse body weight).
The in vivo biodistribution of Au tripods in mice was also confirmed by 64Cu radiolabeling and imaging their localization over time using positron emission tomography (PET), which revealed that 7.9% ID g−1 of RGD–Au-tripods had accumulated in the U87MG tumor after 24 h post-injection. The study suggested that Au-tripods can be reliably synthesized through stringently controlled chemical synthesis. The tripod material could serve as a PAT contrast agent with high selectivity and sensitivity for molecular imaging.
4.1.7 Gold copper pentacles
A pentacle Au–Cu alloy nano-crystal with fivefold twinning was reported for PTT with the TEM image shown in Fig. 20a.136 The particle size could be adjustable from 45 to 200 nm by controlling the reaction time and the addition of capping agent. The particle photothermal effect was investigated through measuring the temperature of 250 μL aqueous solutions of different types of nanocrystals (nanorod network, polyhedrons, 70 nm pentacles and 200 nm pentacles). The four test samples with the same concentration of 10 μg mL−1 experienced NIR laser irradiation of 808 nm at 1 W cm−2. The experimental results (Fig. 20b) showed that the temperature of the solutions containing 70 and 200 nm pentacle NPs increased from 28 to 55 and 67 °C, respectively, within 10 min. Moreover, 70 nm pentacle nanocrystals under laser irradiation exhibited a notable therapeutic effect to kill 4T1 murine breast tumors on BALB/c mice. Although the pentacle NPs possess high photothermal capability, the PAT applications have not been reported yet. Once such agent is available for in vivo animal imaging, PAT is expected to offer high-sensitivity and deep-penetrating molecular images.
Fig. 20.
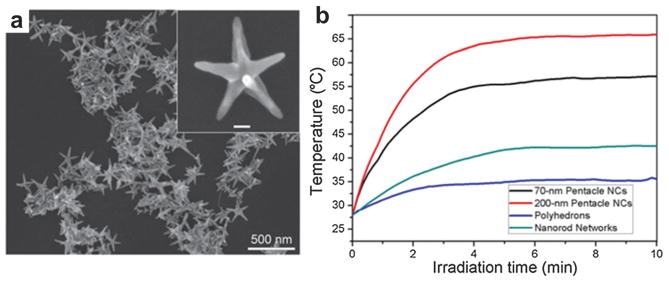
(a) TEM image of plasmonic pentacle Au–Cu alloy NPs.136 (b) Photothermal effect of the Au–Cu alloy pentacles.136 The temperature plot over time was recorded upon irradiation by a 808 nm CW laser (1 W cm−2).
4.2 Silver nanoparticles
Silver, as an alternative candidate to the well-characterized gold, has been studied for bioimaging applications. For example, silver nanoshells have stronger and sharper optical absorption peak than GNShs of the same size.137 Under certain concentrations, silver NPs were reported to be biocompatible in biological systems.138 As shown in Fig. 21a, a silver nanosystem with a diameter from 180 to 520 nm was composed of a porous silver cage coated on a spherical silica core.139 The PEGylated silver nanosystem at a concentration of up to 2 mg mL−1 was tested to be nontoxic by in vitro cell viability. The porous property of the silver layer allows drug release encapsulated in the core for future applications. In another study, sliver nanoplates were introduced as contrast agents that can be easily functionalized for molecular PAT in vivo.140 A ‘green’ seed-mediated synthesis method was adopted for the nanoplate morphology where only biocompatible chemicals were employed with TEM shown in Fig. 21b. For example, ascorbic acid instead of hydrazine and sodium citrate was used as the reducing and stabilizing agents, respectively. In vitro Cell viability tests show the functionalized silver nanoplates were nontoxic at concentrations up to 1 mg mL−1.
Fig. 21.
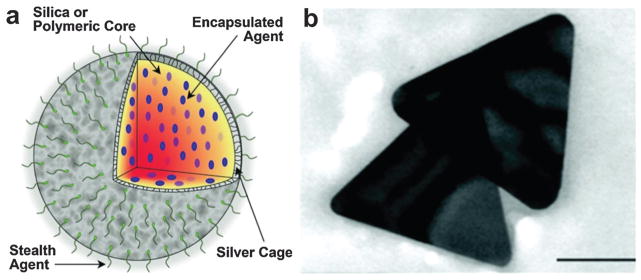
(a) Silver nanosystem platform for imaging contrast, drug release and image-guided therapy.139 (b) TEM of synthesized silver nanoplates for PAT.140 Scar bar = 100 nm.
Furthermore, in vivo PAT of silver nanoplate as molecularly sensitive contrast agent was demonstrated on a dual US-PA imaging system with a linear US transducer. A pulse laser with wavelength range from 740 to 940 nm generated by an OPO was used as excitation source. The raw data was collected by a 128-element linear array transducer (9 MHz center frequency, 14 mm wide), and then beamformed by a delay-and-sum algorithm to form images. An orthotropic pancreatic tumor on mouse was chosen as the study model. The US image (Fig. 22a) shows the anatomical features, while the fluence-compensated spectroscopic PA image (Fig. 22b) maps obvious molecular accumulation of silver NPs to the tumor. However, the main obstacle of biomedical applications of Ag is that silver NPs are generally considered more toxic than gold NPs.141,142 Further quantitative toxicity studies are still in demand for improved biocompatibility and biosafety.
Fig. 22.
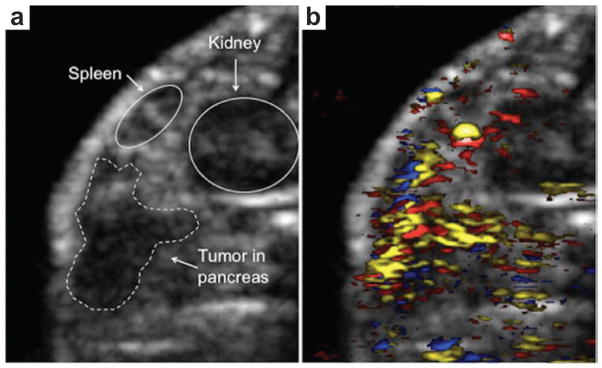
(a) US imaging of an orthotopic pancreatic tumor in a nude mouse model.140 (b) PAT of the pancreatic tumor using antibody conjugated Ag nanoplates (yellow), oxygenated blood (red) and deoxygenated blood (blue).140 Both image sizes are 14.5 mm by 11.8 mm.
4.3 Quantum dots
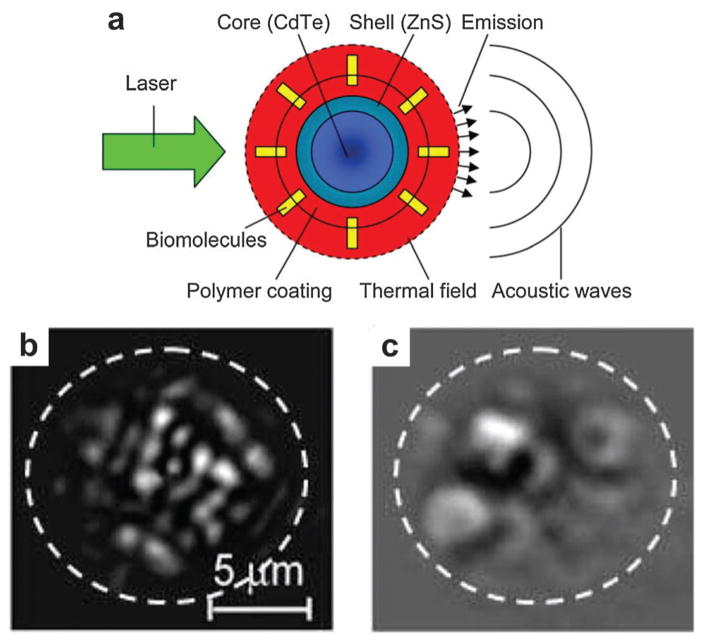
Despite the obvious advantages of non-fluorescent agents for PAT, it does not preclude fluorescent probes for dual imaging modality applications. Quantum dots (QDs) were developed as fluorescent probes owing to the high quantum yield, excellent photostability as well as narrow and tunable emission.143 However, high fluorescence yield reduces PA contrast but does not eliminate it. As shown in Fig. 23a, QDs were used as PAT contrast agents and sensitizers besides for fluorescence imaging. Core–shell CdSe/ZnS QDs with a relatively high optical absorption in the NIR range were explored for trimodality imaging: PAT, photothermal and fluorescent imaging.144 The photothermal image in Fig. 23b showed individual QDs with high contrast in a thin suspension layer. The temporal structure changes in photothermal images at different time delays may provide the morphological information such as NP size. The photothermal signal obviously increased with higher laser pulse energy, which however led to microbubble generation around overheated QDs with overlapping microbubbles as shown in Fig. 23c. The microbubbles in the photothermal image shielded the fluorescent signals from the singular QDs.
Fig. 23.
(a) Quantum dots used for both photothermal and PA detection.144 (b) Photothermal image from QDs obtained with a single laser pulse at 560 nm with a low laser fluence of 0.6 J cm−2.144 (c) Photothermal image from QDs obtained with a single laser pulse at 560 nm with a high laser fluence of 3.5 J cm−2.144
Besides QDs, fluorescent nanodiamonds (FnDs) were also examined as fluorescent and PA biomarkers.145,146 Although pure FnDs are not an efficient PA signal producer, their signal can be increased by ~30-fold after conjugation with Au NPs.147 The energy transfer between FnDs and gold NPs extended the non-radiative decay processes of FnDs and thus the conversion efficiency of the laser energy into thermal expansion. Future work of fluorescent molecules in PAT is needed to further increase the conversion efficiency of laser energy to acoustic emission. Both absorption coefficient and fluorescence yield of the NPs should be taken in account to develop contrast agents for dual-modal imaging.
4.4 Copper sulfide
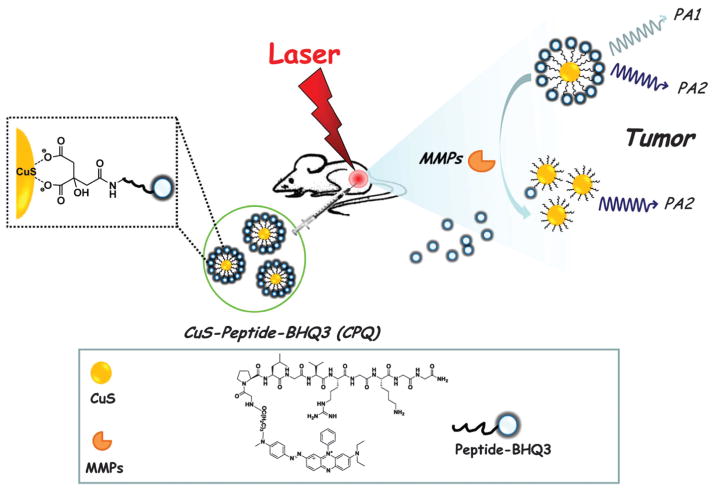
Most plasmonic NPs with absorption peaks in the NIR region of up to ~800 nm were evaluated as potential contrast agents for molecular PAT. However, contrast agents that absorb light at longer wavelength are rarely reported for optical imaging. Matrix metalloproteinases (MMPs) play important roles in cancer aggression and metastasis, inflammation, neurological and cardiovascular diseases.148 An enzyme activatable detection probe comprising of copper sulfide (CuS) and a black hole quencher 3 (BHQ3) was proposed for in vivo indication of cancer-related MMPs as illustrated in Fig. 24.149 CuS NPs, with an absorption peak at 990 nm, were conjugated to BHQ3 (absorption peak at 630 nm), by a MMP-cleavable peptide linker. In tumor microenvironment, the MMP-sensitive linker would be cleaved, unbundling BHQ3 from the CuS NPs.150 The released BHQ3 as a small molecule can be quickly cleared out from the tumor as opposed to CuS, as a large molecule, which would remain inside the tumor for a much longer time. As a result, the PA signal ratio of 680 nm/930 nm could be used as an in vivo indicator of MMPs activity inside the tumor. Such a functional and ratiometric PA nano-probe can be tailored to image specific enzyme activities.
Fig. 24.
Schematic illustration of CuS–pepitide–BHQ3 as PAT probe for in vivo MMPs detection.149 In this detection strategy, BHQ3 is conjugated to CuS NPs by a MMP-cleavable peptide linker, which could be dissociated by MMPs in the tumor environment.
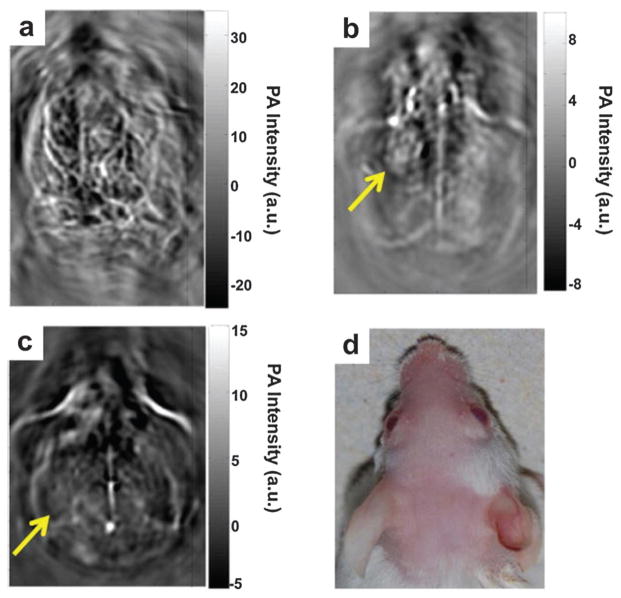
A fluorescent agent, MMPSense 680, was also used as MMPs activatable probe for PAT.151 When activated by MMPs, the silent fluorescent agent starts to fluoresce and its absorption spectrum changes, generating a unique PA property.151 As such, the detection method was applied to image human carotid plaques from patients. CuS NPs for deep PAT imaging was demonstrated ex vivo and in vivo.152 Gelatin containing CuS embedded in chicken breast at a depth of ~5 cm could be detectable with a sensitivity of ~0.7 nM. A nodule on the left cortex was clearly imaged (Fig. 25b) 24 h after intracranial injection of 15 μL CuS NPs (3 × 10¹³ NP mL−1) compared to the PAT image acquired before injection (Fig. 25a). However, the brain nodule in Fig. 25c disappeared 7 days after injection in the photograph of the mouse head shown in Fig. 25d, probably because CuS NPs had cleared from the injection site. In a multiple-purpose demonstration, CuS NPs with conjugated doxorubicin were developed: PAT, enzyme-responsive drug release, and PTT in a single nanoplatform.153
Fig. 25.
(a) PAT of a mouse brain at a wavelength of 532 nm without CuS injection.152 PAT of the mouse brain at 1064 nm (b) 24 h and (c) 7 days after intracranial injection of CuS NPs solution.152 (d) Photograph of the imaged area of mouse head. Laser light irradiated from the top.152
4.5 Iron oxide
Superparamagnetic iron oxide (SPIO) NPs, approved by the Food and Drug Administration (FDA), have been intensively used as negative T2 contrast agents for MRI.154 The dextran-coated magnetic NPs were found to be effective in various imaging instances such as hepatic tumor enhancement and lymph node metastasis imaging.155,156 However, MRI cannot differentiate micrometastases less than 1 mm using a conventional 1.5 Tesla system.157 In recent studies, the potentials of SPIO as PAT contrast agent were investigated for nodal staging.158,159 Lymph nodes in tumor environment usually exhibit responsive lymphadenopathy which could be mimicked by Incomplete Freund adjuvant (IFA) injection.160 Thus, 0.1 mL IFA (consisting of water in oil emulsion) was injected on both hind footpads to create induced lymph node swelling. After 7 days, the animals were subcutaneously injected with 0.1 mL of the SPIO NPs (Endorem®, Guerbet, France) in the footpad of the hind legs. The popliteal lymph nodes in both legs were harvested 24 h after the injection of SPIO for both PAT and MRI.
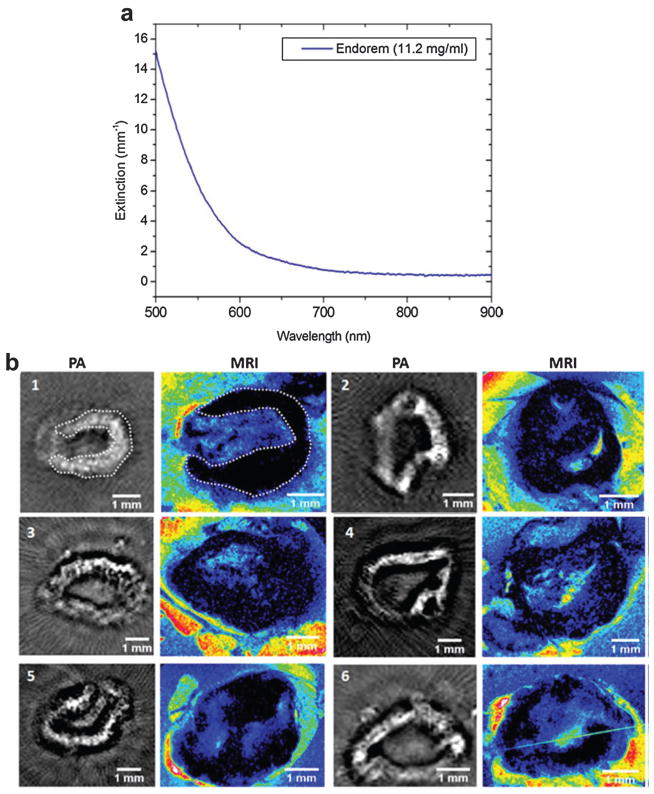
As can be seen in Fig. 26a, the optical absorbance of SPIO decreases with increasing wavelength. Although SPIO does not have absorption peak, 720 nm can identify a low absorption of total hemoglobin accompanied with a significant absorption of the SPIO dispersion. Additionally, NIR illumination enables deep penetration depth of the lymph nodes that are covered by extranodal fat layers. The respective nodes were scanned by a tomographic PA setup and compared with MRI shown in Fig. 26b where PAT images were displayed in gray with MRI images displayed in colormap. Taking lymph node 1 for example, the PAT image pattern agreed well with that of MRI image on the right indicated by a white dotted line. Some nodes (1 and 5) showed a continuous contrast in their boundary whereas others (4 and 6) showed small heterogeneities. The experimental results demonstrated that SPIO NPs can be used for lymph node staging and analysis in metastatic malignancies. The study provides potential method for intra-operative nodal staging for patients undergoing resections.
Fig. 26.
(a) Extinction spectrum of a commercial SPIO (Endorem®) solution.158 (b) PAT and MRI images of excised rat lymph nodes with SPIO injection.158
Instead of dextran, silica coated on SPIO NPs were demonstrated as alternative contrast agents on phantom experiments.161 In another study, a NIR dye labeled amino-terminal fragments of uPA conjugated to iron oxide NPs (NIR830-ATF-IONP) to specifically bind to uPAR, a cellular receptor highly expressed in human breast cancer.162 The targeted iron oxide NPs generated 10-fold enhancement in PA signals in the tumor, compared to the control mice. Similarly, iron oxide NPs were conjugated with polyaniline (PANI) used for targeted cancer imaging by TAT.48 A contrast agent that has already been clinically approved would facilitate a quick implementation to the bedside practice.
4.6 Palladium nanosheets
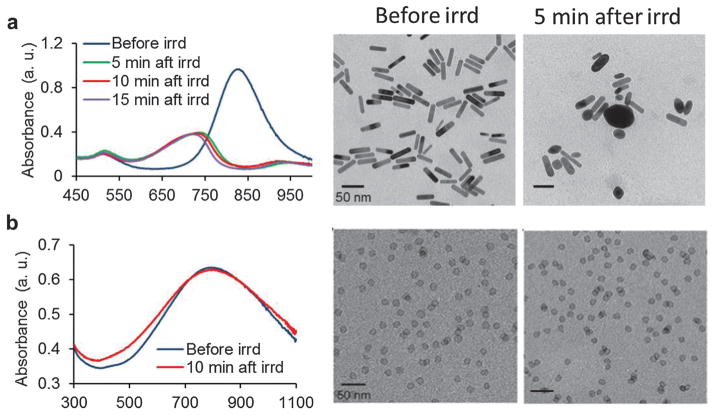
Gold NPs and their derivatives have attracted great attention in photoacuostics as introduced above. When the environmental temperature is higher than the melting temperature of gold nanostructures, laser-triggered or thermally induced collapse can be used for drug control release.112,163 On the other hand, gold nanoconstructs, once melted, will no longer be effective and lose their functions for imaging or therapy purposes. For example, GNRs begin to melt and aggregate dramatically after several minutes of laser irradiation with moderate energy. Previously, palladium (Pd) nanosheet (PNS) was found to have high photothermal property.164 Moreover, PNS holds great potential for cellular permeability due to the ultrathin structure. Therefore, PNS with strong optical absorption at 790 nm was proposed as highly stable and effective PAT contrast agents.107 As shown in Fig. 27a, the rod-shape GNRs changed to round structure after 5 min laser irradiation. The pulsed laser was set at 4 mJ cm−2 per pulse with a repetition rate of 20 Hz. As opposed to the absorption curve smoothing of GNR, the spectrum of PNS was almost unchanged after 10 min laser irradiation (Fig. 27b). In TEM images, the PNS shape remained the same during the irradiation period. The results suggested that the as-prepared palladium NPs are ideally steady under long-term laser irradiation.
Fig. 27.
Photostability comparison between GNRs and PNSs.107 (a) Absorption spectra of GNRs before, 5, 10 and 15 min after pulse laser irradiation (left). TEM images of the GNRs before (middle image) and 5 min after (right image) pulsed laser irradiation. (b) Absorption spectra of PNS before and 10 min after laser irradiation (left). TEM images of the PNS before (middle image) and 5 min after (right image) pulsed laser irradiation.
PAT of two mice groups bearing SCC7 xenografts was conducted at different time points after iv administration of either 200 μL PBS or 200 μL PNS (0.8 mg mL−1) shown in Fig. 28.107 PAT and US images were acquired by a portable and fast PAT system (Visualsonics LAZR 2100, Canada) with a hand-held linear array transducer. The 790 nm laser with moderate laser energy at ~4 mJ cm−2 was used for PNS probes visualization. PAT images were displayed in color while US images were displayed in gray. As shown in Fig. 28a, the control group injected with PBS showed PA signals only on the mice skin. However, the PNS injected group in Fig. 28b showed progressive PA signal enhancement, suggesting a high accumulation of PNS into the tumor. The PA signal increase in the tumor by PNS is likely attributable to enhanced permeability and retention (EPR) effect. The deeper boundary of tumor as marked by black arrows was visualized after injection of PNS, which could possibly be developed for resection guidance. The study indicated that PNS might be applied as stable and effective agents for PA cancer imaging and surgical guidance.
Fig. 28.
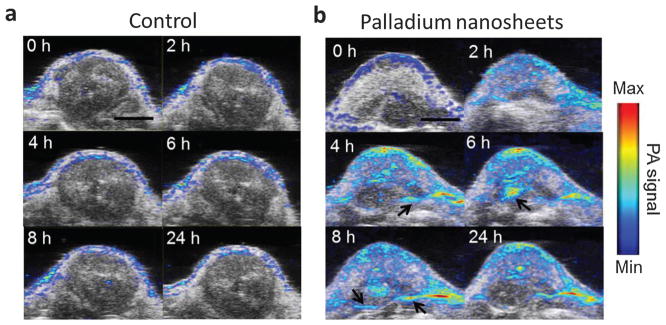
PAT and US images of SCC7 tumors on two mice groups acquired at 0, 2, 4, 6, 8 and 24 h after injection of 200 mL of either (a) PBS or (b) 0.8 mg mL−1 PNS, respectively.107 PAT image is overlapped with US image. Scale bar = 5 mm.
Multimodality imaging can bring complementary information as well as improve the diagnosis accuracy, which is of great significance to clinical application. However, a delivery agent is usually designed for one specific imaging modality. Multimodality agent requires that a tracer particle incorporates multiple functionalities into a single delivery carrier. A cobalt ‘nanowaton’ consisting of ferromagnetic (Co) particles coated with gold (Au) was explored for both PAT and MRI with a sensitivity of picomolar (pM) concentration.165 In this study, the dual imaging strategy offered complementary physiological information: volume detection provided by MRI and tumor boundary detection provided by PAT in a single vehicle.165
5 Carbon nanoparticles
5.1 Carbon nanotubes
Single-walled carbon nanotubes (SWNTs) are nanocylinders comprised of a graphene layer wrapped up to form a tube. As an optical agent in biological imaging, SWNTs have been used in Raman detection,166 fluorescence imaging,167 and PAT of cells and animals.168 RGD peptides were coupled with SWNTs through phospholipid-PEG (PL-PEG5000) to actively target a diseased site in living subjects as depicted in Fig. 29a.169 An AR–PAM system with a central frequency of 5 MHz was applied to image the mice bearing U87MG tumors. 3D US and PA images of the tumor and its surroundings were acquired before and up to 4 h after iv injection of SWNT–RGD. As shown in Fig. 29b, the PA signal in the tumor was greatly enhanced in the SWNT–RGD injected group, while the signal remained almost plateau like with a slight increase in the plain SWNTs injected group. The differential image between 4 h post-injection and pre-injection showed the pure SWNT accumulation to the tumor. The high PA signal in the mouse injected with plain SWNT (marked by a white arrow) is invisible in the subtraction image, indicating that the PA signal is possibly contributed by a blood vessel but not SWNT.
Fig. 29.
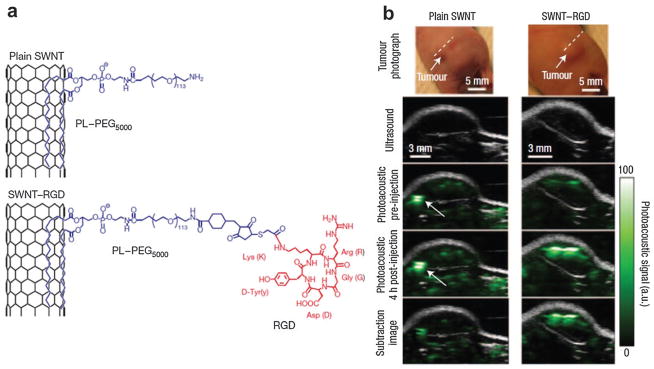
(a) Schematic illustrating SWNTs conjugated with RGD peptides for targeted PAT of mouse tumor.169 (b) B-scan US and PA images of U87MG tumor acquired along a white dotted line aided by SWNTs.169 The US images (gray) show the skin and tumor boundaries, while PAT images (green) show optical absorption (SWNT–RGD) in the tumor. Differential images were obtained by subtraction of the pre-injection image from the 4 h post-injection image.
Among various scaffold matrix materials, poly(lactide-co-glycolide acid) (PLGA) is a popularly used biodegradable polyester due to its excellent degradation and processibility properties.170 Since PLGA particle by itself did not strong enough PA signal, small quantities of SWNTs were incorporated with the polymer to enhance the photoacoustic signal from the scaffolds in biological buffer.171 In this application, SWNT was used to reinforce the mechanical properties and increase the PA signal of the scaffolds. However, in vivo applications have been limited by the relatively low extinction coefficient of nanotubes at NIR wavelengths and concerns over toxicity to some extent. SWNT loaded with small Indocyanine Green (ICG) dye molecules was used for ultrasensitive PA molecular imaging in living mice.172 The dye-enhanced contrast agent provided ~300 times higher PA contrast in living tissues than sole SWNT, leading to subnanomolar detection sensitivities. Approximately 20 times fewer U87MG cancer cells can be detectable by the combined agent than by sole SWNT. Since carbon nanomaterials suffer from insolubility and inefficient biocompatibility, a hyaluronic acid-based biosurfactant was used to simultaneously disperse carbon NPs and target SWNT to CD44 receptor positive tumor cells.173 In vivo trimodality PAT/fluorescence/PET imaging of coated SWCNTs showed high tumor targeting ability while providing long-term monitoring of enzyme events.
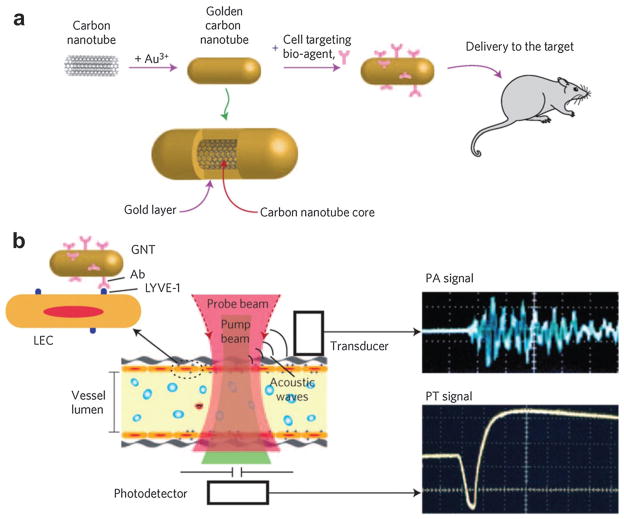
Similarly, gold-plated carbon nanotubes (golden carbon nanotubes) were used for both PAT and PTT with enhanced efficiency (~100 times) for targeting lymphatic vessels in mice.66 As shown in Fig. 30a, a golden carbon nanotube (GNT) consisted of a shortened SWNT core with a length of 100 nm and diameter of 1.5–2 nm, coated by a thin gold layer 4–8 nm thick. Then, an antibody specific to the lymphatic endothelial hyaluronan receptor-1 (LYVE-1) was conjugated to GNT for dual PA/photothermal mapping of lymphatic endothelial cells. PA/photothermal imaging of nude mouse mesentery can be obtained by an automatic scanning microscopic stage with the mouse and a fixed focused laser beam with a diameter of 2–10 mm (Fig. 30b).66 This hybrid plasmonic nanomaterial combining both advantages of Au and SWNT could be an effective alternative to existing NPs and presents a unique set of features.
Fig. 30.
(a) Schematics of gold coated single wall carbon nanotube for both PAT and PTT in mice.66 (b) Schematic of endothelial LYVE-1 targeting receptors with antibody–gold nanotube NPs and PA signal (top right) and photothermal (bottom right) signal.66
5.2 Graphene-based nanosheets
Graphene is a 2D free-standing honeycomb lattice made of a single atomic plane of graphite. Since its extraction from bulk graphite in 2004,174 this unique nanomaterial has become one of the hottest topics in material chemistry, drug carriers and optical imaging.175–177 Compared to carbon nanotubes, graphene possesses larger surface area, lower aspect ratio and better dispersibility in most biological systems. Using strong oxidizing agents, oxygenated functionalities in the graphene structure can produce graphene oxide (GO), which is hydrophilic and more biocompatible.178,179 Graphene and GO were tested and compared as direct contrast agents for both PAT and TAT.180 The experimental results showed that GO nanoribbons at a concentration of ~5 mg ml−1 exhibited about 5–10 fold higher PA signal as opposed to blood at the wavelength of 755 nm and about 10–28% signal enhancement for TAT as opposed to deionized (DI) water at 3 GHz. The ultra-large graphene or GO surface can be easily conjugated to a large number of functional molecules by π–π stacking. To further elevate the imaging contrast, GO was usually conjugated with a strong absorbing dye such as ICG or superparamagnetic NP for multi-modal imaging.181,182
From a synthetic perspective, a protein-based and facile method for the synthesis of reduced GO was explored without any post-reduction processes to remove the redundant oxygenated groups.183 The as-prepared graphene nanosheets exhibit strong wavelength-independent absorption in the visible and near-infrared (NIR) regions. Iv administration of GO for passive targeting in tumor-bearing mice showed PA signal enhancement in the tumor region. As a delivery vehicle, PEGylated GO was bound with photosensitizer molecules, 2-(1-hexyloxyethyl)-2-devinyl pyropheophorbide-alpha (HPPH), for high PDT agent loading and delivery to the tumor (Fig. 31a).184 After administration of 200 μL HPPH with a concentration of 1.0 mg kg−1, PDT was carried out using a 671 nm laser with a power of 75 mW cm−2 for 20 min. The quantitative sO2 change inside tumors before and 24 h after PDT was monitored by PAT as shown in Fig. 31b and c. The white dashed circles outline the measured region of interest in the tumors for comparison. It showed that the sO2 measured by PAT in the tumor after treatment was significantly decreased, indicating tumor necrosis induced by PDT and graphene as an effective carrier of PDT agents.
Fig. 31.
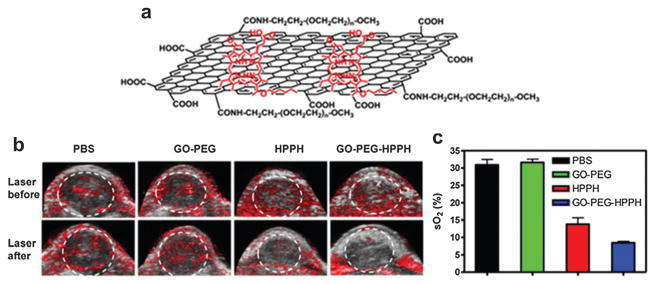
(a) Schematic structure of GO loaded HHPH for highly efficient drug delivery.184 (b) US and PAT of 4T1 tumor-bearing mice before and 24 h after exposure to a 671 nm laser (75 mW cm−2, 20 min).184 (c) Quantitative oxygen saturation obtained by PAT in the tumor after PDT treatment.184
6 Organic compounds
6.1 Polymer nanoparticles
6.1.1 Semiconducting polymer nanoparticles (SPNs)
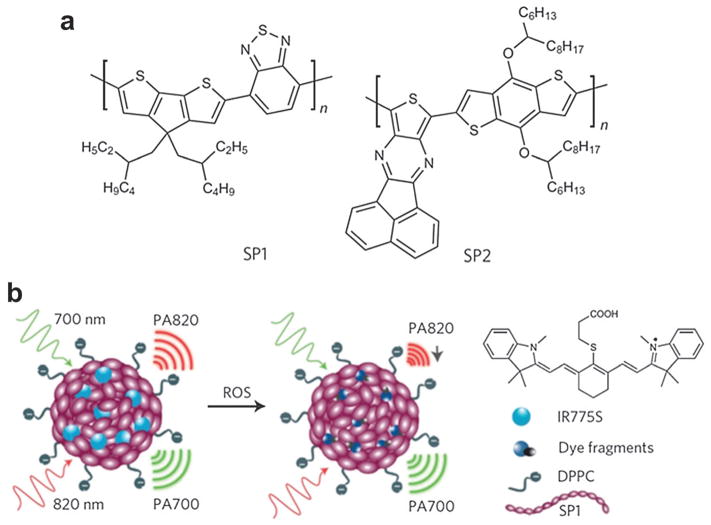
Semiconducting π-conjugated polymer NPs are hot materials with many applications for solar energy harvesting,185 and electronic devices.186 Recently, SPNs have been transformed as efficient PA and fluorescent imaging nanomaterials.187 Specifically, two semiconducting polymer derivatives, poly(cyclopentadithiophene-alt-benzothiadiazole) (SP1) and poly(acenaphthothienopyrazine-alt-benzodithiophene) (SP2) with molecular structure shown in Fig. 32a were used to prepare functional SPNs. Reactive oxygen species (ROS) are chemically reactive molecules containing oxygen, which play vital roles in the onset and progression of various diseases. Some examples of these diseases include atherosclerotic plaques, tumors and degenerating brain tissue. A cyanine dye (IR775S) that is susceptible (absorption spectrum change) to ROS-mediated oxidation was conjugated to the polymer, assisted by 1,2-dipalmitoyl-sn-glycero-3-phosphocholine (DPPC). The nano-precipitation process produced water-soluble functional SPNs at a small diameter (45 nm) and good size stability for ratiometric PA detection. In the strategy shown in Fig. 32b, the PA signal ratio of the semiconducting polymer (remains constant) to the ROS-responsive dye correlates with the ROS concentration.
Fig. 32.
SPN as activatable contrast agent for PA detection of ROS.187 (a) Molecular structures of SP1 and SP2 used for functional SPN preparation. (b) PA ratiometric detection mechanism of ROS at two different wavelengths.
In vivo PA imaging of ROS assisted by SPN was performed in a murine model of acute edema. Either saline (control group) or zymosan (a structural polysaccharide on the cell wall of Saccharomyces cerevisiae simulating the ROS generation such as ONOO− and ClO−) was intramuscularly injected into the thigh of living mice. After 20 min, SPN with the dye (3 μg in 50 μL saline) was injected into the same location. Utilizing a Vevo2100 PA/US imaging system (VisualSonics, Inc.), a PA signal was simultaneously acquired at 700 and 820 nm, as displayed by green and red colormaps, respectively. As can be seen in Fig. 33, the PA amplitude at 700 nm for both saline and zymosan treated mice remained almost unchanged over time. In contrast, the PA signal at 820 nm for zymosan treated mice greatly shrank by time (middle panel of Fig. 33b). The superposition analysis showed a progressive pseudocolor change from yellow to green for zymosan-treated mice but not for control mice (Fig. 33a), suggesting inflammatory ROS generation during edema.
Fig. 33.
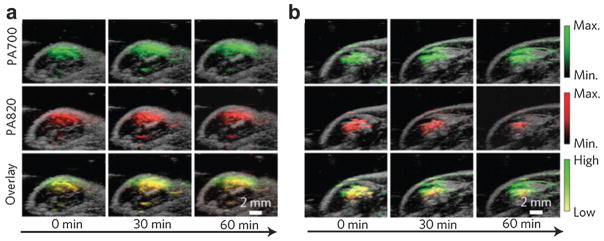
In vivo PA detection of ROS generation from a mouse model of acute oedema by SPN.187 (a) PA/US overlaid images of saline-treated and (b) zymosan-treated regions in the thigh of living mice (n = 3 in each group) at different time points.
Further quantitative analysis indicated that PA700/PA820 gradually increased to 2.7 ± 0.31 for zymosan-treated mice, compared with 1.4 ± 0.22 for the control mice, 2 h after injection. This study demonstrated the feasibility of SPN for activatable PA detection of pathological ROS change using a dual-peak ratiometric contrast mechanism. However, the biosafety of the polymer materials should be investigated much more thoroughly. Another concern is that while artificially induced inflammation in this study is detectable, ROS characteristics of some chronic diseases may not be sensitive enough to be distinguished by this approach.
6.1.2 Polypyrrole (PPy)
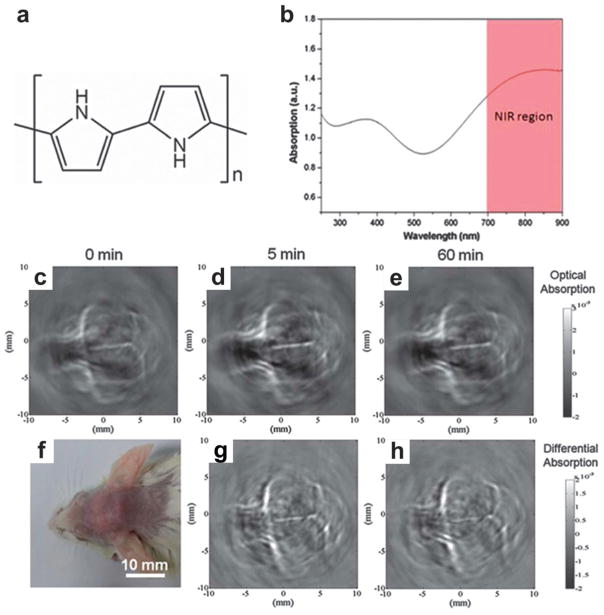
Polypyrrole (PPy) NPs as organic conducting polymer have been applied in electronic devices and chemical sensors owing to their high conductivity and good biocompatibility.188 Uniform PPy NPs can be synthesized based on water-soluble pyrrole monomer and a PVA–FeCl3 mixture in aqueous solution.189 Previously, PPy with high photothermal conversion efficiency was used as an NIR absorbing agent for photothermal ablation of tumors.190 Monodisperse PPy NPs with the molecular structure shown in Fig. 34a were also proposed as NIR absorbing agents for PAT of mouse brain.191 The UV-vis-NIR extinction spectrum of PPy NPs with a diameter of ~46 nm is shown in Fig. 34b. The high absorption coefficient in the NIR region suggests the use of PPy polymers for high contrast imaging with deep penetration depth.
Fig. 34.
PPy NPs as contrast agent for in vivo PAT of mouse brain.191 (a) Molecular structure of PPy. (b) UV-vis-NIR extinction spectrum of PPy at a concentration of 50 mg mL−1. PAT of a mouse brain in vivo using PPy NPs acquired (c) before, (d) 5 min after, and (e) 60 min after the iv injection of PPy NPs. (f) Photograph of the mouse brain before PAT experiment. (g and h) Differential images obtained by subtracting the pre-injection image from the post-injection images (5 and 60 min).
A mouse cerebral cortex was imaged by circularly scanning configuration-based PAT at 808 nm before and after iv injection of 100 mL PPy solution (2 mg mL−1). The PAT image acquired 5 min after PPy NPs injection shows clearer brain vasculature (Fig. 34d) than the control image before injection (Fig. 34c). The improvement is more obvious in a differential image (Fig. 34g) obtained by subtracting the preinjection image (Fig. 34c) from the post-injection image (Fig. 34d). At 1 h post-injection, the blood vessels (Fig. 34e) were imaged with intense brightness, suggesting good PPy NPs circulation in the bloodstream (differential image shown in Fig. 34h). The long-circulating characteristic of PPy NPs is probably attributed to their relatively small size of ~46 nm and the hydrophilic PVA stabilizer. Similarly, a conjugated polymer, poly[9,9-bis(4-(2-ethylhexyl)phenyl) fluorene-alt-co-6,7-bis(4-(hexyloxy)phenyl)-4,9-di(thiophen-2-yl)thiadiazoloquinoxaline] (PFTTQ) was demonstrated for PAT of brain vascular tissue.192 Despite the pilot demonstration, more specific functional applications by the polymers are expected in further study. In another study, NIR dyes incorporated with PLGA were proposed as submicron-size NPs for PAT.193 These organic agents demonstrated low cell toxicity and excellent biocompatibility.
6.2 Porphyrin NPs
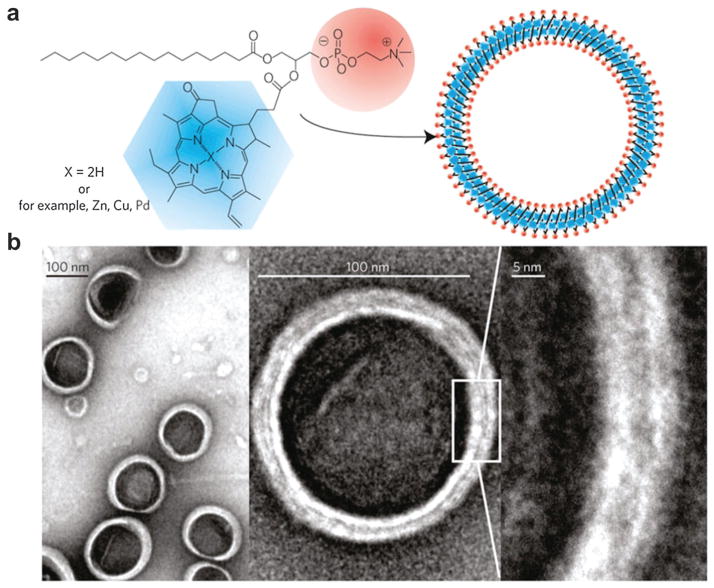
Supramolecular agents can be assembled by light-absorbing organic small molecules such as porphyrin conjugates.194 However, these organic constructs have not been comprehensively investigated as optical imaging agents due to stability or biological issues.195 A porphysome organic NP, self-assembled from phospholipid–porphyrin, was proposed for diverse biophotonic applications including PAT.196 As shown in Fig. 35a, the porphysome structure was comprised of porphyrin–lipid conjugates produced from an acylation reaction between pyropheophorbide and lysophosphatidylcholine. This organic compound could be self-assembled in aqueous buffer with extrusion to yield porphysomes. Polyethylene glycol (PEG) was used in the formulation to further increase the biocompatibility.197 TEM images in Fig. 35b showed that these porphysomes were hollow spherical vesicles with a diameter of ~100 nm. As can be seen at higher magnifications, the ‘sandwich’ structure consisted of two higher-density layers separated by a 2 nm gap, corresponding to two monolayers of porphyrin. The as-prepared pyropheophorbide porphysomes exhibited two absorption peaks at 400 and 680 nm. An alternative synthesis protocol was developed to incorporate metal ions such as Zn, Cu and Pd into the porphyrin–lipid structure, leading to a shifted optical absorption curve (440 and 670 nm). These different kinds of porphysome could be used in certain situations where specific wavelengths are required.
Fig. 35.
Porphysome nanovesicles assembled as optically active contrast agents.196 (a) Schematic illustration of a pyropheophorbide–lipid porphysome. The phospholipid headgroup and porphyrin were marked in red and blue, respectively. (b) TEM images of negatively stained porphysomes (5% PEG–lipid, 95% pyropheophorbide–lipid).
Photothermal conversion efficiencies of PBS, liposomes, GNRs and porphysomes were compared after irradiation by a 673 nm diode laser with a power of 150 mW. Liposomes and porphysomes were normalized to 0.5 mg mL−1, while porphysomes and gold nanorods were normalized to an optical density of 0.8 at 680 nm. As seen in Fig. 36a, the photothermal effect of porphysomes was similar to that of GNRs, whereas liposomes did not produce obvious temperature increase. Porphysomes at a concentration as low as 25 picomolar were detectable by PAT. In Fig. 36b, the PA signal of porphysome decreased up to sixfold after detergent addition to disrupt the structure. In contrast, the PA signals of MB with and without the detergent remained unchanged, suggesting that the vesicle structure of porphysomes is requisite for PA signal generation. The same phenomenon of PA signal decrease due to detergent-induced porphysome dissociation was also observed in Fig. 36c.
Fig. 36.
Porphysomes as contrast agents for PAT of lymph node.196 (a) Photothermal property of porphysomes compared with liposomes and GNRs. (b) PA signal ratio of porphysomes and methylene blue with and without detergent. (c) PA images of tubes filled with porphysomes and PBS measured with and without detergent. (d) PAM images of lymph node using porphysomes on rats before and after intradermal injection of porphysomes (2.3 pmol). Scale bar = 5 mm.
In a rat model, porphysomes were intradermally injected for PAT of SLN.196 The lymphatic network became clearly detectable with higher contrast 15 min after injection (Fig. 36d). The first draining lymph node (red) was surprisingly unveiled with enhanced contrast of the inflowing vessel (yellow) and surrounding vessels (cyan). In a later study, a porphyrin–lipid shell encapsulating a fluorinated gas was fabricated for both US and PAT imaging.198 These porphyrin-microbubbles exhibited high shell stiffness and enhanced stability. The unique constructs possess acoustic features compatible with clinical US imaging together with favorable PA capabilities. On the downside, the large size of the porphyrin-composed NP is not optimal for in vivo application such as intravenous injection.
6.3 Perfluorocarbon (PFC) nanodroplets
Most PAT contrast mechanisms are governed by the thermo-elastic effect (thermal expansion). However, the conversion efficiency of the thermal expansion-based NPs is not very high. Perfluorocarbon nanodroplet (PFCnD) with cryogenic TEM image shown in Fig. 37a, consisting of a liquid PFC droplet with an encapsulated light absorbing molecule, was introduced for PAT and US imaging enhancement in step 1 of Fig. 37b.199,200 Upon pulsed laser trigger, the enclosed agents such as GNRs absorb light and generate heat and thus produce a pressure wave (step 2). Subsequently liquid PFCnD experiences a liquid-to-gas phase transition generating giant PA pressures depicted in step 3. In this evaporation process, the immediate bubble ‘explosion’ can produce an order of magnitude higher US signal than traditional NPs. The supply of PFCnDs was depleted as they evaporated under laser irradiation. Then PA signal decayed to its steady state level contributed by the thermal expansion of the exposed GNRs. Meanwhile, the resulting PFC bubbles can provide US contrast owing to the acoustic impedance mismatch between the gaseous bubbles and the surrounding tissue (step 6). In summary, vaporization of PFCnD (steps 2 and 3) provides giant PA signal and thermal expansion caused by plasmonic NPs (steps 4 and 5) provide weaker but steady PA signal. The produced microbubble (step 6) provides US contrast.
Fig. 37.
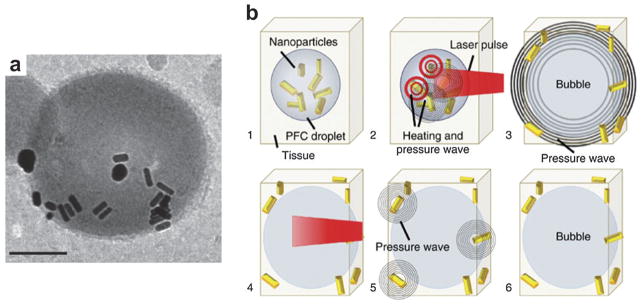
(a) Cryogenic TEM image of PFC nanodroplet containing GNRs.200 Scale bar = 100 nm. (b) Step-by-step diagram illustrating PA and US signal enhancement by PFCnDs attributed to the vaporization phenomenon.200
An in vivo experiment was undertaken to compare PFCnDs with the traditional contrast agent (GNRs) on the efficiency of producing PA contrast.200 On a murine model, either 50 μL PFCnD at a concentration of 108 PFCnD mL−1 or equivalent quantity of GNRs as encapsulated in the injected PFCnDs was locally injected into the pancreas, which is located ~5–7 mm underneath the skin. A Vevo 2100 PA/US imaging system (VisualSonics, Inc.) equipped with a 40 MHz transducer (256 elements) was utilized for both PA and US signal collection. A 10 Hz pulsed laser with pulse energy of 14 mJ cm−2 operating at 780 nm (the peak optical absorption of the GNR) was used to heat the embedded GNRs. Upon irradiation, the PA signal within the pancreas (PFCnDs injected) was initially very strong and decayed to a steady level as the pulsed laser irradiation continued due to the thermal expansion effect of the expelled nanorods (Fig. 38a). The corresponding combined PA and US images in Fig. 38b and c illustrate the peak PA signals corresponding to vaporization of PAnDs and thermal expansion of GNRs. However, in the group injected with an equivalent number of nanorods as encapsulated in the injected PFCnDs (Fig. 38d), the increase of signal generated by the nanorods alone was only ~1.9 dB (Fig. 38e), compared with a 6.0 dB increase in signal generation using PFCnDs (Fig. 38b).
Fig. 38.
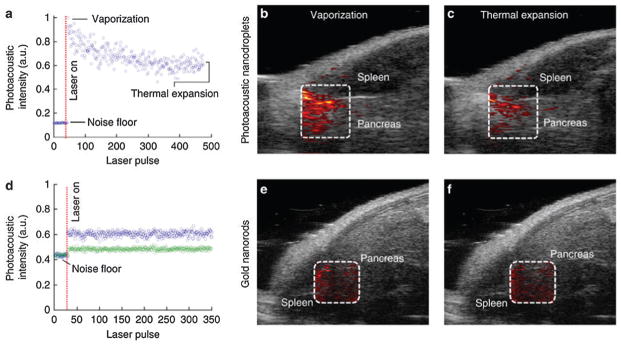
In vivo PA signal enhancement in mouse pancreas by PFCnDs (upper panel) and GNRs (lower panel).200 (a) PA signal change corresponding to the injected PFCnDs in the pancreas indicated by dashed area in (b) and (c). (b, c) Overlapped US and PA images generated from the rapid phase transition of the PFCnDs and expelled GNRs, respectively. (d) PA signal change corresponding to the injected GNRs in the pancreas indicated by dashed area in (e) and (f). The green circles represent the PA signal of the endogenous absorbers while blue circles represent the PA signal from the thermal expansion caused by both the endogenous absorbers and the GNRs. (e, f) Overlapped PA and US images of mouse tissue injected by GNRs immediately after the laser was turned on and at the end of the laser stimulation. Each image size is 12.2 × 10.8 mm2.
In the same way, ICG instead of GNR was loaded in PFCnDs for enhanced PAT and US imaging.199 The effect of surrounding temperature on droplet vaporization and enhancement of PA and US signals was exploited in the study. The experimental results showed that the nanodroplets under higher surrounding temperature produce greater PA signal due to greater vaporization efficiency. The trigger source to the droplets can be replaced by HIFU to provide US contrast and drug release.201,202 The dye release process may be useful for optical imaging of cancers or tumor metastasis in the SLNs. On the opposite side, PFCnDs are not suitable for long-lasting monitoring because the liquid-to-gas transition is too quick and irreversible. Instead of using the vaporization transition, PFCnDs were decorated with two different NIR fluorescent dyes on the surface, PPCy-C8 and cypate-C18, for PA and fluorescence imaging.203 Similarly, liposome as an agent vesicle containing GNRs and iron oxide NPs, was used as a dual-contrast agent for magneto-photo-acoustic imaging.204 B-mode US, PA and magneto-motive ultrasound (MMUS) images were obtained from a tissue sample injected with cells labeled by the hybrid agent. This concept of dual payload per particle is anticipated to increase thermal expansion effect resulting in greater acoustic signal. However, the relatively large size of the droplets still poses challenges on mobility and bloodstream circulation.
6.4 Indocyanine green (ICG)
ICG, first introduced for human medicine in 1957 and approved by the FDA in 1959,205 has been widely used in hepatic function diagnostics, cardiac output, and later on ophthalmic angiography.206–208 As an optical sensor, ICG has also been applied on PAT because of the high optical absorption and its NIR absorption peak at the isosbestic point of HbO and Hb.209,210 On mass basis, ICG at 780 nm is ~7 times more absorbing than SWNT and ~8500 times more absorbing than GNR.172 Moreover, ICG has a moderate fluorescent emission yield of ~10%.
As a contrast agent for both fluorescence imaging and PAT, ICG was used for SLN mapping in axillary staging.211 ICG (0.2 mL, 1 mM), with the molecular structure shown in Fig. 39a, was injected intradermally into the left forepaw pad of a rat. PAT images of the axillary area acquired from an AR–PAM system before and 0.2 h after injection were displayed in Fig 39b and c. The AR–PAM system equipped with a 5 MHz ultrasonic transducer and wavelength-tunable laser was used to collect PA signals at 618 and 668 nm for spectroscopic SLN identification. SLN and the lymphatic vessels were obviously unveiled in the post-injection image (Fig. 39c) with high contrast. A 3D image 0.7 h post-injection was shown in Fig. 39d. The results demonstrated that strong absorbing agents with PAM system have the potential to help map SLN in axillary staging and evaluate tumor metastasis in patients with breast carcinoma. PAT with ICG has also been used for brain cortex mapping,212 kidney perfusion,213 and cancer therapy.209 In the PA treatment study, ICG, PL-PEG and folic acid (FA) were conjugated together as cancer-targeting nanoprobes.209 The EMT6 tumors in mice after PA therapy showed a much slower growth rate. The pilot results indicated that the ICG-PL-PEG-based PA therapy could provide a new efficient cancer treatment technique.
Fig. 39.

(a) Molecular structure of ICG. (b) Control PAT image obtained before ICG injection in the axillary region.211 (c) PAT image obtained 0.2 h after injection in the same region.211 SLN and lymphatic vessels are clearly visible. (d) 3D PAT image of SLN 0.7 h after injection.211
To provide a more effective imaging system, ICG was covalently conjugated to SWNT to deliver a higher amount of ICG molecules to the disease site.172,210,214 SWNT has a diameter of several nm and length of 50–300 nm and ICG was attached to the surface of the SWNT. Hence it is expected that the total particle size can remain relatively small, enabling tumor targeting by iv injection. The PAT data showed that ICG/SWNT provided ~196% signal amplification with the main enhancement at the tumor periphery 2 h after injection.210 This feature is possibly useful to assess tumor boundaries for surgical resection of tumors.
Despite the strong absorption and nontoxicity properties, ICG has an unusual light absorption behavior depending on the particle concentration as well as the ambient environment. Moreover, ICG tends to degrade under light exposure, which could be alleviated when ICG is bound to albumin in blood. However, the reaction process takes several days and is also concentration-dependent. Taking advantage of the PA spectrum change in blood, ICG release by US induced drug delivery could be spatially and quantitatively monitored.215 An ICG derivative, IRDye 800, can be used for protein/antibody labeling after adding the NHS ester reactive group. In an in vivo study, IRDye 800 with an absorption peak of ~800 nm was conjugated with cyclic peptide cyclo(Lys-Arg-Gly-Asp-Phe) (cKRGDf) that targets integrin αvβ3 overexpressed by neovessels in U87MG glioblastoma tumor model.94 High tumor uptake of targeted IRDye 800 in the mouse brain structure was imaged by PAT.
6.5 Methylene blue (MB)
MB with its molecular structure shown in Fig. 40a, known as the first synthetic drug, was used on the treatment of malaria in 1891.216 As a potent cationic dye, MB has been used in different biological staining procedures and bacteriology.217 MB is FDA-approved and water soluble with a light absorption peak around 670 nm. In a rat model, intradermal injection of 0.7 μL MB at 10 mg mL−1 was performed on left forepaw for SLN identification.218 An MIP control image was obtained from an AR–PAM system before injection shown in Fig. 40b. The vasculature near an axial node was clearly imaged whereas the SLN was barely visible. In the PA image 52 min after injection, SLN appeared with a striking optical contrast as marked by the arrow. Quantitatively, the contrast of the SLN with respect to the surrounding vessels is ~146 ± 41 (standard deviation). The image area on the rat after skin removal is shown in Fig. 40b as reference. The results indicate that MB could be a useful agent to noninvasively identify SLNs for axillary staging in vivo.
Fig. 40.
In vivo PA imaging of SLN in a rat with MB injection.218 (a) Molecular structure of MB. (b) Photograph of the imaging area with skin removed after experiments. (c) Control PA image without MB injection. (d) PA image 52 min after MB injection.
In another study, MB was combined with microbubbles for dual PAT and US imaging.219 The PA contrast stemmed from the optical absorption of MB stimulated by pulse laser, while the US contrast was ascribed to the acoustic impedance differences between the gaseous microbubbles and surrounding tissues. It is noted that MB can be activated by light to an excited state which in turn activates oxygen to yield oxidizing radicals. By probing its transient absorption during the excited state, this process can be used to detect oxygen pressure as described in Section 3.2.88
6.6 Evans blue (EB)
Evans blue (EB), an alternative blue dye, has strong absorption in visible and NIR region with a peak at 620 nm. EB is also nontoxic and has been used in lymph node location,220 albumin marker evaluation,221 and permeability assessment of the blood–brain barrier.222 Since EB is uniformly bound with serum albumin in blood stream, capillary network and its dynamic diffusion can be clearly imaged by PAM.223 EB solution (6%, 0.2 mL) was iv injected into the bloodstream of a nude mouse. Before dye injection, main blood vessels were imaged at 570 nm with strong signal amplitude shown in Fig. 41a. However, smaller capillaries were discontinuous with much lower contrast as indicated by the arrows. Fig. 41b showed the PA image acquired at 610 nm where the signals were much weaker due to the low hemoglobin absorption at 610 nm. The microvascular network appeared continuous and smooth with more detail at 610 nm immediately after the dye injection, shown in Fig. 41c. In addition, the blood vessels in Fig. 41c exhibited much thicker (~50%) features than those in Fig. 41a due to the EB binding to the blood plasma. The image in Fig. 41d at 610 nm, acquired 30 min after dye injection, showed that some EB had spread out of the vessels into the ambient tissue, resulting in a high background contrast. The transmission microscopic image of the mouse ear after EB injection (Fig. 41f) showed that the EB appeared as brown patches after diffusion, with the transmission microscopic image before injection shown in Fig. 41e.
Fig. 41.
PAM of capillaries on a mouse ear enhanced by EB.223 PA image before dye injection acquired at (a) 570 nm and at (b) 610 nm. (c) PA image acquired at 610 nm right after EB (6%, 0.2 mL) injection. (d) PA image acquired at 610 nm 30 min after injection. Transmission microscopic images of the image area (e) before and (f) after EB injection. Arrows in (d), (e) and (f) indicate sebaceous glands.
6.7 Coomassie blue & Prussian blue (PB)
Coomassie blue was previously loaded by PEGylated polyacrylamide hydrogel to provide brain tumor staining.224 The organic dye with absorption peak at 595 nm was also used for delineation of brain tumor by PAT.225 PAT results showed that the detection sensitivity limit of the blue dye was ~0.84 μmol L−1.225 The exploratory PAT images suggested that PAT with the absorbing agents may help guide tumor surgery by revealing tumor morphology and margin. Another blue pigment, Prussian Blue (PB) as one of the first synthetic dyes, was also explored as a PAT contrast agent due to its high absorption of NIR laser pulses.226 The PB NPs can be easily fabricated by mixing Fe3+ and [Fe(CN)6]4− aqueous solutions. In particular, PB as a typical FDA-approved drug has been used for safe treatment of radioactive exposure on humans. In vitro PAT results showed that PB NPs at a low concentration of 60 μg mL−1 was detectable under ~4.3 cm thickness of chicken breast tissue. Moreover, the cortical vessels of a mouse brain were clearly imaged with greater clarity after iv administration of PB NPs. The results showed that PB NPs are promising as new PA contrast agents for clinical applications. In another study, Congo red with an absorption peak of ~500 nm was used to stain mouse brain on an OR–PAM system for amyloid plagues imaging.227
Compared with metallic NPs, many organic dyes have been approved by FDA for human use and are small in size (<5 nm), possessing excellent biosafety properties and fast migration ability. Moreover, on mass basis organic dye chromophores are usually more efficient on photothermal conversion efficiency than agents in other forms. However, most organic dyes suffer from serious photobleaching and are susceptible to environmental factors, leading to irreproducible signals and unpredictable phenomena.
7. Reporter genes
7.1 Fluorescence proteins
Besides directly imaging anatomy and physiology, PAT holds great potential as a preclinical molecular imaging tool through engineered reporter genes that express absorbing proteins. Imaging gene expression is crucial in disease diagnosis and profiling since many diseases are related to genetic issues. This will help unveil disease processes at a cellular or molecular level. A reporter gene is usually incorporated in a regulatory sequence of another gene as an indicator of whether a certain gene has been expressed in the cell or organism. Sophisticatedly studied reporter genes usually express visually identifiable fluorescent and luminescent proteins, which can be used as imaging contrast.228 For example, Green Fluorescent Protein (GFP) gene from jellyfish causes cells that it expresses to emit green light under blue light excitation.229 Besides fluorescence emission, some reporter genes are able to produce contrast for PAT to overcome the shallow imaging depth provided by fluorescence imaging.230
Enhanced GFP (eGFP) was specifically expressed in the salivary glands of fly pupae. PAT images of a Drosophila melanogaster pupa encoded with the GFP gene were acquired at 488, 498 and 508 nm shown in Fig. 42a–c, respectively.230 The pupal case was clearly identified in those PAT images with high contrast compared with internal structures. It showed that the salivary glands can be accurately visualized (Figs. 42d and h). The benefit of using fluorescence proteins for PAT is that they have been well developed for molecular imaging and can readily be conjugated to target a wide range of specific receptors. On the other hand, their weaknesses are a relatively small absorption cross section and they are limited to relatively transparent subjects such as Zebrafish or small Drosophila (fruitfly) pupa.230 Accurate spectroscopic or unmixing techniques will be essential for more sensitive detection of molecular imaging agents in the face of the over-whelming PA contribution from blood.
Fig. 42.
PAT of eGFP distribution in Drosophila melanogaster pupa.230 PAT images acquired at (a) 488 nm, (b) 498 nm and (c) 508 nm, respectively. (d) Spectrally resolved PAT image of eGFP distribution in an intact pupa. (e) Corresponding histology of DAPI-stained pupa at the same imaging plane (green color corresponds to GFP-expressing salivary glands). (f) Extinction spectra of eGFP (red with absorption peak at 488 nm) along with measured absorption of pupa case (blue) and fat areas (green). (g) Imaging plane of the pupa. (h) Overlaid image of the image at 508 nm (c) and the spectrally resolved image (d).
A recently developed bacteriophytochrome-based NIR fluorescence protein, named iRFP, provided much higher PA contrast than conventional GFP-like proteins.231,232 Two differently labeled tumors, one with iRFP670 (absorption/emission maxima at 645 nm/670 nm) and the other with iRFP720 (absorption/emission maxima at 703 nm/720 nm), and surrounding vasculature can be spectrally resolved. PAT images of iRFP-encoded mouse with sub-millimeter resolution at depths up to 8 mm were acquired.233 The signal amplification is caused by its substantially red-shifted absorption spectra and high extinction coefficient. With the attributes, iRFP670 and iRFP720 are more suitable probes for in vivo PAT than conventional GFP-like fluorescence proteins. Furthermore, in vivo PACT and deep-PAM imaging was exploited on mouse tumor xenograft model with iRFP-expressing MTLn3 cells.232
7.2 LacZ
LacZ, originating from E. coli, is one of the most widely used reporter genes.234 The LacZ reporter gene encodes a bacterial enzyme, β-galactosidase, which metabolizes lactose into galactose and glucose. A colorless analogue of lactose, 5-bromo-4-chloro-3-indolyl-β-D-galactoside (X-gal), was used for β-galactosidase staining (Fig. 43).235,236 By adding X-gal, β-galactosidase cleaves the X-gal and yields galactose and an optical indoxyl monomer, 5-bromo-4-chloro-3-hydroxyindole. Afterwards, two of the monomers are oxidized to form a blue product, 5,5′-dibromo-4,4′-dichloroindigo, which absorbs light strongly between 605 and 665 nm. Taking advantage of the effect, multi-scale PAT was used to image gene expression as deep as 5 cm in living biological tissue. AR–PAM with a high-frequency focused transducer can supply sufficient resolving ability to unveil the microvasculature without enough imaging depth. Complementarily, PAT is able to detect the LacZ-marked tumor in great depth at the expense of resolution. The caveat of this method is that the assay requires local injection of the X-gal substrate into the imaging region of interest. Moreover, X-gal usually causes skin irritation and was not efficiently metabolized in tumors especially when X-gal was injected through the tail vein.
Fig. 43.
PAT of LacZ reporter gene expression using chromogenic X-gal probe.236 (a) Staining of X-Gal catalyzed by β-galactosidase for PAT detection. (b) Photograph showing the chromogenic change after addition of X-gal solution into the native lysate of 9 L per lacZ cells.
7.3 Tyrosinase
In contrast to LacZ, tyrosinase gene, which does not require injection of enzymatic substrate for PAT, regulates melanin generation in skin and hair in humans. The expressed tyrosinase is a key enzyme that catalyzes the production of multiple melanin molecules which will generate strong PA signal.237 Tyrosinase-catalyzed melanin and various other absorbers in tissue can be spectrally differentiated by PAM in vivo.237 In fact, expression of melanin in cells is variable and dependent on the transfection efficiency. Although the extinction coefficient of melanin is lower than that of hemoglobin at the wavelengths studied, there is enough melanin production in the transfected cells to increase concentration to detectable levels. The disadvantage of this gene expression is that the melanin production process in transfected cells can potentially be toxic.238 Future work will involve different methods and cell lines to selectively express melanin and improve transfection rates. Further work is also needed to study the toxicity of melanin production in transfected cells. Tyrosinase was also shown to be a reporter gene for MRI owing to the binding of melanin with heavy metal ions that create a substantial increase in T1 signals.239 Moreover, PET of reporter gene can also be realized by the melanin avid probes such as N-(2-(diethylamino)ethyl)-18F-5-fluoropicolinamide (18F-P3BZA) as a reporter probe.240 Similarly, plasmid expressing human heavy chain ferritin was co-transfected with human melanoma SK-24 (SK-MEL-24) for PAT.241 Iron accumulation due to ferritin overexpression was demonstrated in SK-MEL-24 cells in vitro.
8. Discussion and prospects
In this review, we have surveyed recent contrast agent advancements in design, biochemistry and theranostic applications for PAT. Indeed, the versatile optical probes are now increasingly active in numerous aspects: enhanced sensitivity and specificity, functional biosensing, activatable drug release/response and imaging of tumor microenvironments as well as gene activities. However, there is no single best agent for all applications and selection of the most ideal agent can be ambiguous due to the great variety of NPs. They are categorized and summarized in Table 1 according to their different characteristics. The choice of NP for a certain purpose is application dependent: NP properties, imaging depth and biological interactions all play important roles. The key criteria in evaluating potential PA contrast agents are optical absorption spectrum, size dimension, functionality design, surface modification, targeting capability, as well as its toxicity and biodegradability.
Table 1.
Exogenous contrast agents for functional PAT
| NP name | NP size | Absorption peak | Application examples | Features | Development stage |
|---|---|---|---|---|---|
| Gold nanorods | 10 by 30–60 nm | 650–1100 nm | Ovarian cancer imaging,105 organ imaging200 | Rod shape, high PA enhancement | In vivo |
| Gold nanocages | 10–150 nm | 500–1200 nm | SLN identification,119 melanoma imaging,120 PTT116 | Porous hollow cage, activatable drug release | In vivo |
| Gold nanostars | 45–80 nm | 780–840 nm | Neovascular imaging,52 cancer therapy123 | Multibranched with sharp tips, excellent PA enhancement | In vivo |
| Gold nanoshells | 130 nm | 800 nm | Brain cortex imaging,127 drug loading129 | Silica core and gold shell, moderate PA enhancement | In vivo |
| Gold nanovesicles | 250 nm | 808 nm | Tumor imaging, cancer therapy132 | Biodegradable, high PTT efficiency | In vivo |
| Gold nanotripods | <20 nm | 540, 700 nm | Tumor imaging135 | Tripod shape, small size, good biocompatibility | In vivo |
| Gold copper pentacles | 45–200 nm | 810, 530 nm for 200 nm NP | PTT136 | Pentacle shape, high photothermal effect | In vivo |
| Silver nanoplates | 25–250 nm | 550–1080 nm | Tumor imaging, image-guided therapy140 | Thin triangular plate, potential toxicity | In vivo |
| Quantum dots (CdTe/ZnS) | 5–50 nm | 635 nm | Photothermal, fluorescence, PA imaging144 | Dual imaging capability, low photothermal conversion efficiency | In vivo |
| Copper sulfide | 20 nm | 990 nm | MMP detection,149 deep imaging,152 drug delivery153 | High photostability, deep imaging | In vivo |
| Iron oxide | 60 nm–3 μm | No absorption peak | Nodal staging,158,159 breast cancer imaging162 | FDA approved, dual imaging (MRI & PAT) | Clinical |
| Palladium nanosheets | 1.8 nm by 8–50 nm | 790–1050 nm | Tumor imaging107 | Ultrathin structure, high photostability, high PA enhancement | In vivo |
| Carbon nanotubes | 1 nm by 50–300 nm | 680 nm | Tumor imaging,169 polymer scaffolds imaging171 | Cylindrical hollow cube, moderate PA enhancement | In vivo |
| Graphene oxide | 1 nm by <50 μm | 230 nm | Tumor imaging, drug delivery184 | Ultrathin sheet, high loading efficiency, low PA contrast | In vivo |
| Semiconducting polymer | ~40 nm | 660, 700 nm | Lymph node imaging, reactive oxygen species detection187 | Organic, good biocompatibility, large mass extinction coefficient | In vivo |
| Polypyrrole | ~45 nm | 808 nm | Brain vasculature imaging, deep tissue imaging191 | High conductivity, high PA enhancement | In vivo |
| Porphysome | ~100 nm | 400, 680 nm | Lymph node imaging,196 fluorescence imaging196 | Organic, biodegradable, multimodal imaging | In vivo |
| Perfluorocarbon nanodroplets | ~300 nm | Dependent on the loaded effector | Organ imaging,200 US imaging199 | Giant transient PA enhancement, large size | In Vivo |
| ICG | <2 nm | 790 nm | SLN mapping,211 tumor imaging215 | FDA approved, excellent PA enhancement, unstable in blood | Clinical |
| Methylene blue | <2 nm | 670 nm | SLN imaging,218 oxygen pressure detection88 | FDA approved, high PA enhancement | Clinical |
| Evans blue | <2 nm | 620 nm | Capillary imaging223 | Nontoxic, high PA enhancement | In vivo |
| Coomassie blue | <5 nm | 595 nm | Brain delineation225 | High PA enhancement, organic dye | Ex vivo |
| Prussian blue | <5 nm | 713 nm | Deep imaging, brain cortex imaging226 | Synthetic pigment, FDA approved, high PA enhancement | Clinical |
| Green fluorescent protein (GFP) | <5 nm | 488 nm | Pupa imaging230 | Dual fluorescent/PA imaging, low PA enhancement, shallow depth | In vivo |
| LacZ gene | NA | 605–665 nm (blue product) | Tumor cell imaging235,236 | Gene expression imaging, require catalyst injection, may cause skin irritation | In vivo |
| Tyrosinase gene | NA | 335 nm (melanin product) | Phantom imaging, melanin imaging237 | Gene expression imaging, potential toxic production process | In vivo |
It is expected that further advancement of this fast-growing topic will continue to accelerate both basic life sciences and bedside clinic care. Correspondingly, practical applications set demanding requirements on their optical properties, dimension and morphology, surface chemistry, ability to entail multiple tasks such as multimodality imaging, diagnosis and therapy in one platform, as well as clinical prospects. Although plenty of case studies and significant progress has been introduced in each section of this review, new research efforts in diverse directions are in demand to make rapid progress toward this end. Here we would like to highlight the facing challenges and future directions which can bring pronounced impact.
(1) PAT still needs to cope better with facing technical challenges. For example, PAT capabilities are severely hindered by thick bones such as human skull and thoracic air cavities in the body. Sophisticated algorithms are needed to recover the PA signals and suppress the interfering skull artifacts. High-repetition lasers with rapid wavelength turning are required for real-time functional PAM. Moreover, there is also a need to image more deeply which may be overcome by high laser energy and optimal wavelength.
(2) Improvement of PAT sensitivity is still needed for some real imaging cases, in particular, for weak signal detection. Theoretically, single molecule detection can be achievable by PAT at room temperature for molecules with fast enough relaxation time. However, in reality, the imaging sensitivity is mainly hampered by surrounding thermal noises and acoustic inherence of the medium itself in the form of black body radiation. Possible technical improvements include development of ultrasensitive acoustic transducers with very short focusing length to maximize the pressure receiving. In addition, high repetition pulse laser could allow sufficient PA signal averaging to eliminate the interfering thermal noises. Fabrication of NP with a strong absorption coefficient would also be of great help to increase the sensitivity.
(3) Developing contrast agents which comply with ‘smart, activatable, efficient’ strategies is another appealing direction. For instance, an agent candidate can selectively change its generated PA signal amplitude or absorption spectrum along with the environmental variations such as temperature, pH change or oxygen level. Or the activatable particle ‘cargo’ can release a therapeutic drug or optical agent upon laser irradiation/HIFU. As a result, the designed probe can be used as an indicator of functional parameters to reflect physiological/pathological status. Meanwhile accurate unmixing spectroscopic techniques are essential to distinguish the exogenous agents in the face of strong PA contribution from the medium.
(4) In general, NPs need to circulate and extravasate the vascular compartment, circumvent RES uptake, cross the interstitium, and be taken up by the desired site for imaging purposes. Despite the imaging enhancement by many NPs, more work is still required to overcome the delivery obstacles and boost the efficiency. Optimized surface engineering of these NPs to ensure prolonged stability and long circulation in the bloodstream will be attractive for in vivo applications in the future. Injected NPs are often unable to biodegrade into biologically benign components. Hence, an efficient clearance of them is necessary and of crucial importance by developing new or modified synthetic strategies to prepare small (<10 nm) but efficient NPs.
(5) Some organic dyes such as ICG and MB have already been approved by FDA for human applications. However, more types of proposed inorganic NPs including most gold nanoconstructs are still being examined in small animal study due to the potential toxicity issue. Future toxic investigations on non-human primates are necessary to provide useful information for their possible clinical translation.
(6) Promoting an agent or PAT system into clinical trials and FDA approval needs to undergo rigorous biosafety evaluation and arduous regulatory approval steps, which is a very time-consuming and costly process.242 Ultimately, it should take an interdisciplinary group, comprising a variety of professionals with diverse backgrounds, for example material chemistry, medical instrument engineering, disease diagnosis, vascular biology, oncology therapeutic, and government regulations to advance the new contrast agents for clinical imaging.
Acknowledgments
This work was supported by National Intramural Research Program (IRP) of the National Institute of Biomedical Imaging and Bioengineering (NIBIB), NIH.
Biographies

Dr Liming Nie earned his BS degree in 2005 and PhD degree in 2010, both in optics, from South China Normal University. His PhD project was focused on photoacoustic/thermoacoustic tomography system development and related biomedical applications. In August 2010 to September 2012, Dr Nie received postdoctoral training in the Optical Imaging Lab under the mentorship of Dr Lihong V. Wang at Washington University in St. Louis. His projects involved functional photoacoustic tomography of the primate brain and the reconstruction correction of acoustic aberration. From October 2012 to 2013, he worked on photoacoustic molecular imaging/microscopy in the Laboratory of Molecular Imaging and Nanomedicine (LOMIN), National Institutes of Health (NIH). Currently he works in the Center for Molecular Imaging and Translational Medicine (CMITM), Xiamen University. His research interests are the development of novel biomedical imaging techniques including photoacoustic imaging, fluorescence imaging, and biomarker sensing. One of his aims is to provide effective and low-cost imaging methods and instruments for early-stage disease diagnosis and treatment monitoring.

Xiaoyuan Chen received his PhD in Chemistry from the University of Idaho in 1999. He joined the University of Southern California as an Assistant Professor of Radiology in 2002. He then moved to Stanford University in 2004 and was promoted to Associate Professor in 2008. In the summer of 2009, he joined the Intramural Research Program of the NIBIB as a Senior Investigator and Chief of the Laboratory of Molecular Imaging and Nanomedicine (LOMIN). Dr Chen has published over 400 papers and numerous books and book chapters. He sits on the editorial board of over 10 peer-reviewed journals and is the founding editor of journal Theranostics. His lab focuses on developing molecular imaging probes and nanotechnologies for early diagnosis of disease, monitoring therapy responses, and guiding drug discovery/development.
References
- 1.Mirza RG, Johnson MW, Jampol LM. Surv Ophthalmol. 2007;52:397–421. doi: 10.1016/j.survophthal.2007.04.007. [DOI] [PubMed] [Google Scholar]
- 2.Mennella V, Keszthelyi B, McDonald K, Chhun B, Kan F, Rogers G, Huang B, Agard D. Nat Cell Biol. 2012;14:1159–1168. doi: 10.1038/ncb2597. [DOI] [PMC free article] [PubMed] [Google Scholar]
- 3.Juskaitis R, Wilson T, Neil MA, Kozubek M. Nature. 1996;383:804–806. doi: 10.1038/383804a0. [DOI] [PubMed] [Google Scholar]
- 4.Rice WL, Kaplan DL, Georgakoudi I. PLoS One. 2010;5:e10075. doi: 10.1371/journal.pone.0010075. [DOI] [PMC free article] [PubMed] [Google Scholar]
- 5.Habermehl C, Schmitz CH, Steinbrink J. Opt Express. 2011;19:18636–18644. doi: 10.1364/OE.19.018636. [DOI] [PMC free article] [PubMed] [Google Scholar]
- 6.Azizi L, Zarychta K, Ettori D, Tinet E, Tualle JM. Opt Express. 2009;17:12132–12144. doi: 10.1364/oe.17.012132. [DOI] [PubMed] [Google Scholar]
- 7.Fink M, Montaldo G, Tanter M. Annu Rev Biomed Eng. 2003;5:465–497. doi: 10.1146/annurev.bioeng.5.040202.121630. [DOI] [PubMed] [Google Scholar]
- 8.Guo Z, Li L, Wang LV. Med Phys. 2009;36:4084–4088. doi: 10.1118/1.3187231. [DOI] [PMC free article] [PubMed] [Google Scholar]
- 9.Bell AG. Am J Sci. 1880;s3–20:305–324. [Google Scholar]
- 10.Kreuzer LB, Patel CK. Science. 1971;173:45–47. doi: 10.1126/science.173.3991.45. [DOI] [PubMed] [Google Scholar]
- 11.Kim C, Favazza C, Wang LHV. Chem Rev. 2010;110:2756–2782. doi: 10.1021/cr900266s. [DOI] [PMC free article] [PubMed] [Google Scholar]
- 12.Wang LHV, Hu S. Science. 2012;335:1458–1462. doi: 10.1126/science.1216210. [DOI] [PMC free article] [PubMed] [Google Scholar]
- 13.Wang LV. IEEE J Sel Top Quantum Electron. 2008;14:171–179. doi: 10.1109/JSTQE.2007.913419. [DOI] [PMC free article] [PubMed] [Google Scholar]
- 14.Lou CG, Yang SH, Ji Z, Chen Q, Xing D. Phys Rev Lett. 2014:112. doi: 10.1103/PhysRevLett.109.218101. [DOI] [PubMed] [Google Scholar]
- 15.Wang Y, Hu S, Maslov K, Zhang Y, Xia YN, Wang LV. Opt Lett. 2011;36:1029–1031. doi: 10.1364/OL.36.001029. [DOI] [PMC free article] [PubMed] [Google Scholar]
- 16.Viator JA, Komadina J, Svaasand LO, Aguilar G, Choi B, Nelson JS. J Invest Dermatol. 2004;122:1432–1439. doi: 10.1111/j.0022-202X.2004.22610.x. [DOI] [PubMed] [Google Scholar]
- 17.Wang B, Su JL, Amirian J, Litovsky SH, Smalling R, Emelianov S. Opt Express. 2010;18:4889–4897. doi: 10.1364/OE.18.004889. [DOI] [PMC free article] [PubMed] [Google Scholar]
- 18.Holotta M, Grossauer H, Kremser C, Torbica P, Volkl J, Degenhart G, Esterhammer R, Nuster R, Paltauf G, Jaschke W. J Biomed Opt. 2011;16:036007. doi: 10.1117/1.3556720. [DOI] [PubMed] [Google Scholar]
- 19.Pramanik M, Ku G, Wang LHV. J Biomed Opt. 2009:14. doi: 10.1117/1.3103778. [DOI] [PMC free article] [PubMed] [Google Scholar]
- 20.Li CH, Ku G, Wang LV. Phys Rev E: Stat, Nonlinear, Soft Matter Phys. 2008:78. doi: 10.1103/PhysRevE.78.021901. [DOI] [PMC free article] [PubMed] [Google Scholar]
- 21.Nie LM, Guo ZJ, Wang LV. J Biomed Opt. 2011:16. doi: 10.1117/1.3595842. [DOI] [PMC free article] [PubMed] [Google Scholar]
- 22.Xu MH, Wang LHV. Phys Rev E: Stat, Nonlinear, Soft Matter Phys. 2005:71. [Google Scholar]
- 23.Burgholzer P, Matt GJ, Haltmeier M, Paltauf G. Phys Rev E: Stat, Nonlinear, Soft Matter Phys. 2007:75. doi: 10.1103/PhysRevE.75.046706. [DOI] [PubMed] [Google Scholar]
- 24.Cox BT, Treeby BE. IEEE Trans Med Imaging. 2010;29:387–396. doi: 10.1109/TMI.2009.2032358. [DOI] [PubMed] [Google Scholar]
- 25.Huang C, Nie LM, Schoonover RW, Guo ZJ, Schirra CO, Anastasio MA, Wang LHV. J Biomed Opt. 2012:17. doi: 10.1117/1.JBO.17.6.066016. [DOI] [PMC free article] [PubMed] [Google Scholar]
- 26.Treeby BE, Cox BT. J Biomed Opt. 2010:15. doi: 10.1117/1.3360308. [DOI] [PubMed] [Google Scholar]
- 27.Huang C, Nie LM, Schoonover RW, Wang LHV, Anastasio MA. J Biomed Opt. 2012:17. doi: 10.1117/1.JBO.17.6.061211. [DOI] [PMC free article] [PubMed] [Google Scholar]
- 28.Huang C, Wang K, Nie LM, Wang LHV, Anastasio MA. IEEE Trans Med Imaging. 2013;32:1097–1110. doi: 10.1109/TMI.2013.2254496. [DOI] [PMC free article] [PubMed] [Google Scholar]
- 29.Gamelin J, Aguirre A, Maurudis A, Huang F, Castillo D, Wang LV, Zhu Q. J Biomed Opt. 2008:13. doi: 10.1117/1.2907157. [DOI] [PMC free article] [PubMed] [Google Scholar]
- 30.Xia J, Chatni MR, Maslov K, Guo ZJ, Wang K, Anastasio M, Wang LV. J Biomed Opt. 2012:17. doi: 10.1117/1.JBO.17.5.050506. [DOI] [PMC free article] [PubMed] [Google Scholar]
- 31.Xia J, Huang C, Maslov K, Anastasio MA, Wang LHV. Opt Lett. 2013;38:3140–3143. doi: 10.1364/OL.38.003140. [DOI] [PMC free article] [PubMed] [Google Scholar]
- 32.Xia J, Chen WY, Maslov K, Anastasio MA, Wang LHV. J Biomed Opt. 2014:19. doi: 10.1117/1.JBO.19.1.016003. [DOI] [PMC free article] [PubMed] [Google Scholar]
- 33.Yao JJ, Xia J, Maslov KI, Nasiriavanaki M, Tsytsarev V, Demchenko AV, Wang LV. NeuroImage. 2013;64:257–266. doi: 10.1016/j.neuroimage.2012.08.054. [DOI] [PMC free article] [PubMed] [Google Scholar]
- 34.Nasiriavanaki M, Xia J, Wan HL, Bauer AQ, Culver JP, Wang LV. Proc Natl Acad Sci U S A. 2014;111:21–26. doi: 10.1073/pnas.1311868111. [DOI] [PMC free article] [PubMed] [Google Scholar]
- 35.Razansky D, Baeten J, Ntziachristos V. Med Phys. 2009;36:939–945. doi: 10.1118/1.3077120. [DOI] [PubMed] [Google Scholar]
- 36.Ntziachristos V, Razansky D. Chem Rev. 2010;110:2783–2794. doi: 10.1021/cr9002566. [DOI] [PubMed] [Google Scholar]
- 37.Razansky D, Buehler A, Ntziachristos V. Nat Protoc. 2011;6:1121–1129. doi: 10.1038/nprot.2011.351. [DOI] [PubMed] [Google Scholar]
- 38.Brecht HP, Su R, Fronheiser M, Ermilov SA, Conjusteau A, Oraevsky AA. J Biomed Opt. 2009;14:064007. doi: 10.1117/1.3259361. [DOI] [PMC free article] [PubMed] [Google Scholar]
- 39.Wang K, Ermilov SA, Su R, Brecht HP, Oraevsky AA, Anastasio MA. IEEE Trans Med Imaging. 2011;30:203–214. doi: 10.1109/TMI.2010.2072514. [DOI] [PMC free article] [PubMed] [Google Scholar]
- 40.Yin B, Xing D, Wang Y, Zeng Y, Tan Y, Chen Q. Phys Med Biol. 2004;49:1339–1346. doi: 10.1088/0031-9155/49/7/019. [DOI] [PubMed] [Google Scholar]
- 41.Ephrat P, Keenliside L, Seabrook A, Prato FS, Carson JJ. J Biomed Opt. 2008;13:054052. doi: 10.1117/1.2992131. [DOI] [PubMed] [Google Scholar]
- 42.Prost A, Funke A, Tanter M, Aubry JF, Bossy E. J Biomed Opt. 2012;17:061205. doi: 10.1117/1.JBO.17.6.061205. [DOI] [PubMed] [Google Scholar]
- 43.Erpelding TN, Kim C, Pramanik M, Jankovic L, Maslov K, Guo Z, Margenthaler JA, Pashley MD, Wang LV. Radiology. 2010;256:102–110. doi: 10.1148/radiol.10091772. [DOI] [PMC free article] [PubMed] [Google Scholar]
- 44.Yang D, Xing D, Gu H, Tan Y, Zeng L. Appl Phys Lett. 2005;87:194101. [Google Scholar]
- 45.Nie L, Xing D, Yang S. Med Phys. 2009;36:3429–3437. doi: 10.1118/1.3157204. [DOI] [PubMed] [Google Scholar]
- 46.Nie L, Xing D, Yang D, Zeng L, Zhou Q. Appl Phys Lett. 2007;90:174109. doi: 10.1063/1.2732824. [DOI] [PMC free article] [PubMed] [Google Scholar]
- 47.Nie L, Xing D, Zhou Q, Yang D, Guo H. Med Phys. 2008;35:4026–4032. doi: 10.1118/1.2966345. [DOI] [PubMed] [Google Scholar]
- 48.Nie L, Ou Z, Yang S, Xing D. Med Phys. 2010;37:4193–4200. doi: 10.1118/1.3466696. [DOI] [PubMed] [Google Scholar]
- 49.Levi J, Kothapalli SR, Bohndiek S, Yoon JK, Dragulescu-Andrasi A, Nielsen C, Tisma A, Bodapati S, Gowrishankar G, Yan XR, Chan C, Starcevic D, Gambhir SS. Clin Cancer Res. 2013;19:1494–1502. doi: 10.1158/1078-0432.CCR-12-3061. [DOI] [PMC free article] [PubMed] [Google Scholar]
- 50.Manohar S, Kharine A, van Hespen JCG, Steenbergen W, van Leeuwen TG. Phys Med Biol. 2005;50:2543–2557. doi: 10.1088/0031-9155/50/11/007. [DOI] [PubMed] [Google Scholar]
- 51.Heijblom M, Piras D, Xia W, van Hespen JCG, Klaase JM, van den Engh FM, van Leeuwen TG, Steenbergen W, Manohar S. Opt Express. 2012;20:11582–11597. doi: 10.1364/OE.20.011582. [DOI] [PubMed] [Google Scholar]
- 52.Nie L, Wang S, Wang X, Rong P, Ma Y, Liu G, Huang P, Lu G, Chen X. Small. 2014;10:1585–1593. doi: 10.1002/smll.201302924. [DOI] [PubMed] [Google Scholar]
- 53.Kruger RA, Lam RB, Reinecke DR, Del Rio SP, Doyle RP. Med Phys. 2010;37:6096–6100. doi: 10.1118/1.3497677. [DOI] [PMC free article] [PubMed] [Google Scholar]
- 54.Kruger RA, Kuzmiak CM, Lam RB, Reinecke DR, Del Rio SP, Steed D. Med Phys. 2013;40:113301. doi: 10.1118/1.4824317. [DOI] [PMC free article] [PubMed] [Google Scholar]
- 55.Zhang HF, Maslov K, Stoica G, Wang LV. Nat Biotechnol. 2006;24:848–851. doi: 10.1038/nbt1220. [DOI] [PubMed] [Google Scholar]
- 56.Ye S, Yang R, Xiong J, Shung KK, Zhou Q, Li C, Ren Q. Biomed Opt Express. 2012;3:360–365. doi: 10.1364/BOE.3.000360. [DOI] [PMC free article] [PubMed] [Google Scholar]
- 57.Wang H, Yang XQ, Liu YY, Jiang BW, Luo QM. Opt Express. 2013;21:24210–24218. doi: 10.1364/OE.21.024210. [DOI] [PubMed] [Google Scholar]
- 58.Hajireza P, Shi W, Zemp RJ. Opt Lett. 2011;36:4107–4109. doi: 10.1364/OL.36.004107. [DOI] [PubMed] [Google Scholar]
- 59.Hu S, Maslov K, Wang LV. Opt Lett. 2011;36:1134–1136. doi: 10.1364/OL.36.001134. [DOI] [PMC free article] [PubMed] [Google Scholar]
- 60.Zhang C, Maslov K, Hu S, Chen R, Zhou Q, Shung KK, Wang LV. J Biomed Opt. 2012;17:020501. doi: 10.1117/1.JBO.17.2.020501. [DOI] [PMC free article] [PubMed] [Google Scholar]
- 61.Zhang C, Maslov K, Wang LV. Opt Lett. 2010;35:3195–3197. doi: 10.1364/OL.35.003195. [DOI] [PMC free article] [PubMed] [Google Scholar]
- 62.Nunez R. Curr Issues Mol Biol. 2001;3:39–45. [PubMed] [Google Scholar]
- 63.Weight RM, Viator JA, Dale PS, Caldwell CW, Lisle AE. Opt Lett. 2006;31:2998–3000. doi: 10.1364/ol.31.002998. [DOI] [PubMed] [Google Scholar]
- 64.Galanzha EI, Shashkov EV, Kelly T, Kim JW, Yang L, Zharov VP. Nat Nanotechnol. 2009;4:855–860. doi: 10.1038/nnano.2009.333. [DOI] [PMC free article] [PubMed] [Google Scholar]
- 65.Zharov VP, Galanzha EI, Shashkov EV, Khlebtsov NG, Tuchin VV. Opt Lett. 2006;31:3623–3625. doi: 10.1364/ol.31.003623. [DOI] [PubMed] [Google Scholar]
- 66.Kim JW, Galanzha EI, Shashkov EV, Moon HM, Zharov VP. Nat Nanotechnol. 2009;4:688–694. doi: 10.1038/nnano.2009.231. [DOI] [PMC free article] [PubMed] [Google Scholar]
- 67.Silverman RH, Kong F, Chen Y, Lloyd HO, Kim HH, Cannata JM, Shung KK, Coleman DJ. Ultrasound Med Biol. 2010;36:733–742. doi: 10.1016/j.ultrasmedbio.2010.02.006. [DOI] [PMC free article] [PubMed] [Google Scholar]
- 68.Shi W, Kerr S, Utkin I, Ranasinghesagara J, Pan L, Godwal Y, Zemp RJ, Fedosejevs R. J Biomed Opt. 2010;15:056017. doi: 10.1117/1.3502661. [DOI] [PubMed] [Google Scholar]
- 69.Jiao S, Jiang M, Hu J, Fawzi A, Zhou Q, Shung KK, Puliafito CA, Zhang HF. Opt Express. 2010;18:3967–3972. doi: 10.1364/OE.18.003967. [DOI] [PMC free article] [PubMed] [Google Scholar]
- 70.Zhang HF, Puliafito CA, Jiao S. Ophthalmic Surgery, Lasers, and Imaging. 2011;42:S106–S115. doi: 10.3928/15428877-20110627-10. [DOI] [PMC free article] [PubMed] [Google Scholar]
- 71.Beard PC, Perennes F, Mills TN. IEEE Trans Ultrason Ferroelectr Freq Control. 1999;46:1575–1582. doi: 10.1109/58.808883. [DOI] [PubMed] [Google Scholar]
- 72.Zhang EZ, Laufer JG, Pedley RB, Beard PC. Phys Med Biol. 2009;54:1035–1046. doi: 10.1088/0031-9155/54/4/014. [DOI] [PubMed] [Google Scholar]
- 73.Zhang E, Laufer J, Beard P. Appl Opt. 2008;47:561–577. doi: 10.1364/ao.47.000561. [DOI] [PubMed] [Google Scholar]
- 74.Laufer J, Johnson P, Zhang E, Treeby B, Cox B, Pedley B, Beard P. J Biomed Opt. 2012;17:056016. doi: 10.1117/1.JBO.17.5.056016. [DOI] [PubMed] [Google Scholar]
- 75.Laufer J, Zhang E, Raivich G, Beard P. Appl Opt. 2009;48:D299–D306. doi: 10.1364/ao.48.00d299. [DOI] [PubMed] [Google Scholar]
- 76.Pinsky MR, Payen D. Crit Care. 2005;9:566–572. doi: 10.1186/cc3927. [DOI] [PMC free article] [PubMed] [Google Scholar]
- 77.Liao LD, Lin CT, Shih YYI, Duong TQ, Lai HY, Wang PH, Wu R, Tsang S, Chang JY, Li ML. J Cereb Blood Flow Metab. 2012;32:938–951. doi: 10.1038/jcbfm.2012.42. [DOI] [PMC free article] [PubMed] [Google Scholar]
- 78.Pan D, Pramanik M, Senpan A, Allen JS, Zhang H, Wickline SA, Wang LV, Lanza GM. FASEB J. 2011;25:875–882. doi: 10.1096/fj.10-171728. [DOI] [PMC free article] [PubMed] [Google Scholar]
- 79.Yao J, Maslov KI, Zhang Y, Xia Y, Wang LV. J Biomed Opt. 2011;16:076003. doi: 10.1117/1.3594786. [DOI] [PMC free article] [PubMed] [Google Scholar]
- 80.Wang L, Maslov K, Wang LV. Proc Natl Acad Sci U S A. 2013;110:5759–5764. doi: 10.1073/pnas.1215578110. [DOI] [PMC free article] [PubMed] [Google Scholar]
- 81.Li Z, Li H, Chen H, Xie W. J Biomed Opt. 2011;16:076011. doi: 10.1117/1.3598314. [DOI] [PubMed] [Google Scholar]
- 82.Gupta AS. Nanomed: Nanotechnol, Biol Med. 2011;7:763–779. [Google Scholar]
- 83.Berlis A, Lutsep H, Barnwell S, Norbash A, Wechsler L, Jungreis CA, Woolfenden A, Redekop G, Hartmann M, Schumacher M. Stroke. 2004;35:1112–1116. doi: 10.1161/01.STR.0000124126.17508.d3. [DOI] [PubMed] [Google Scholar]
- 84.Krumholz A, Wang L, Yao J, Wang LV. J Biomed Opt. 2012;17:060502. doi: 10.1117/1.JBO.17.6.060502. [DOI] [PMC free article] [PubMed] [Google Scholar]
- 85.Zhang Q, Liu Z, Carney PR, Yuan Z, Chen H, Roper SN, Jiang H. Phys Med Biol. 2008;53:1921. doi: 10.1088/0031-9155/53/7/008. [DOI] [PubMed] [Google Scholar]
- 86.Lo LW, Koch CJ, Wilson DF. Anal Biochem. 1996;236:153–160. doi: 10.1006/abio.1996.0144. [DOI] [PubMed] [Google Scholar]
- 87.Ashkenazi S, Huang SW, Horvath T, Koo YE, Kopelman R. J Biomed Opt. 2008;13:034023. doi: 10.1117/1.2927466. [DOI] [PubMed] [Google Scholar]
- 88.Ashkenazi S. J Biomed Opt. 2010;15:040501. doi: 10.1117/1.3465548. [DOI] [PubMed] [Google Scholar]
- 89.Ray A, Rajian JR, Lee YE, Wang X, Kopelman R. J Biomed Opt. 2012;17:057004. doi: 10.1117/1.JBO.17.5.057004. [DOI] [PMC free article] [PubMed] [Google Scholar]
- 90.Laufer J, Elwell C, Delpy D, Beard P. Phys Med Biol. 2005;50:4409. doi: 10.1088/0031-9155/50/18/011. [DOI] [PubMed] [Google Scholar]
- 91.Guo Z, Hu S, Wang LV. Opt Lett. 2010;35:2067–2069. doi: 10.1364/OL.35.002067. [DOI] [PMC free article] [PubMed] [Google Scholar]
- 92.Oladipupo SS, Hu S, Santeford AC, Yao J, Kovalski JR, Shohet RV, Maslov K, Wang LV, Arbeit JM. Blood. 2011;117:4142–4153. doi: 10.1182/blood-2010-09-307538. [DOI] [PMC free article] [PubMed] [Google Scholar]
- 93.Oladipupo S, Hu S, Kovalski J, Yao J, Santeford A, Sohn RE, Shohet R, Maslov K, Wang LV, Arbeit JM. Proc Natl Acad Sci U S A. 2011;108:13264–13269. doi: 10.1073/pnas.1101321108. [DOI] [PMC free article] [PubMed] [Google Scholar]
- 94.Li ML, Oh JT, Xie X, Ku G, Wang W, Li C, Lungu G, Stoica G, Wang LV. Proc IEEE. 2008;96:481–489. [Google Scholar]
- 95.Grzelczak M, Pérez-Juste J, Mulvaney P, Liz-Marzán LM. Chem Soc Rev. 2008;37:1783–1791. doi: 10.1039/b711490g. [DOI] [PubMed] [Google Scholar]
- 96.Zhang Q, Li W, Moran C, Zeng J, Chen J, Wen L-P, Xia Y. J Am Chem Soc. 2010;132:11372–11378. doi: 10.1021/ja104931h. [DOI] [PMC free article] [PubMed] [Google Scholar]
- 97.Okuno T, Kato S, Hatakeyama Y, Okajima J, Maruyama S, Sakamoto M, Mori S, Kodama T. J Controlled Release. 2013;172:879–884. doi: 10.1016/j.jconrel.2013.10.014. [DOI] [PubMed] [Google Scholar]
- 98.Xiao YL, Hong H, Matson VZ, Javadi A, Xu W, Yang YA, Zhang Y, Engle JW, Nickles RJ, Cai WB, Steeber DA, Gong SQ. Theranostics. 2012;2:757–768. doi: 10.7150/thno.4756. [DOI] [PMC free article] [PubMed] [Google Scholar]
- 99.Alkilany AM, Thompson LB, Boulos SP, Sisco PN, Murphy CJ. Adv Drug Delivery Rev. 2012;64:190–199. doi: 10.1016/j.addr.2011.03.005. [DOI] [PubMed] [Google Scholar]
- 100.Abraham GE, Himmel PB. J Nutr Environ Med. 1997;7:295–305. [Google Scholar]
- 101.Thakor AS, Jokerst J, Zavaleta C, Massoud TF, Gambhir SS. Nano Lett. 2011;11:4029–4036. doi: 10.1021/nl202559p. [DOI] [PMC free article] [PubMed] [Google Scholar]
- 102.Sperling RA, Gil PR, Zhang F, Zanella M, Parak WJ. Chem Soc Rev. 2008;37:1896–1908. doi: 10.1039/b712170a. [DOI] [PubMed] [Google Scholar]
- 103.Hayat MA. Colloidal gold: principles, methods, and applications. Elsevier; 2012. [Google Scholar]
- 104.Kim K, Huang S-W, Ashkenazi S, ODonnell M, Agarwal A, Kotov NA, Denny MF, Kaplan MJ. Appl Phys Lett. 2007;90:223901. [Google Scholar]
- 105.Jokerst JV, Cole AJ, Van de Sompel D, Gambhir SS. ACS Nano. 2012;6:10366–10377. doi: 10.1021/nn304347g. [DOI] [PMC free article] [PubMed] [Google Scholar]
- 106.Nikoobakht B, El-Sayed MA. Chem Mater. 2003;15:1957–1962. [Google Scholar]
- 107.Nie L, Chen M, Sun X, Rong P, Zheng N, Chen X. Nanoscale. 2014;6:1271–1276. doi: 10.1039/c3nr05468c. [DOI] [PubMed] [Google Scholar]
- 108.Chen YS, Frey W, Kim S, Kruizinga P, Homan K, Emelianov S. Nano Lett. 2011;11:348–354. doi: 10.1021/nl1042006. [DOI] [PMC free article] [PubMed] [Google Scholar]
- 109.Jokerst JV, Thangaraj M, Kempen PJ, Sinclair R, Gambhir SS. ACS Nano. 2012;6:5920–5930. doi: 10.1021/nn302042y. [DOI] [PMC free article] [PubMed] [Google Scholar]
- 110.Skrabalak SE, Chen J, Sun Y, Lu X, Au L, Cobley CM, Xia Y. Acc Chem Res. 2008;41:1587–1595. doi: 10.1021/ar800018v. [DOI] [PMC free article] [PubMed] [Google Scholar]
- 111.Sun Y, Xia Y. Science. 2002;298:2176–2179. doi: 10.1126/science.1077229. [DOI] [PubMed] [Google Scholar]
- 112.Yavuz MS, Cheng Y, Chen J, Cobley CM, Zhang Q, Rycenga M, Xie J, Kim C, Song KH, Schwartz AG, Wang LV, Xia Y. Nat Mater. 2009;8:935–939. doi: 10.1038/nmat2564. [DOI] [PMC free article] [PubMed] [Google Scholar]
- 113.Li W, Cai X, Kim C, Sun G, Zhang Y, Deng R, Yang M, Chen J, Achilefu S, Wang LV, Xia Y. Nanoscale. 2011;3:1724–1730. doi: 10.1039/c0nr00932f. [DOI] [PMC free article] [PubMed] [Google Scholar]
- 114.Wang Y, Liu Y, Luehmann H, Xia X, Wan D, Cutler C, Xia Y. Nano Lett. 2013;13:581–585. doi: 10.1021/nl304111v. [DOI] [PMC free article] [PubMed] [Google Scholar]
- 115.Cang H, Sun T, Li ZY, Chen JY, Wiley BJ, Xia YN, Li XD. Opt Lett. 2005;30:3048–3050. doi: 10.1364/ol.30.003048. [DOI] [PubMed] [Google Scholar]
- 116.Chen JY, Glaus C, Laforest R, Zhang Q, Yang MX, Gidding M, Welch MJ, Xia YN. Small. 2010;6:811–817. doi: 10.1002/smll.200902216. [DOI] [PMC free article] [PubMed] [Google Scholar]
- 117.Li WY, Brown PK, Wang LHV, Xia YN. Contrast Media Mol Imaging. 2011;6:370–377. doi: 10.1002/cmmi.439. [DOI] [PMC free article] [PubMed] [Google Scholar]
- 118.Yang XM, Skrabalak SE, Li ZY, Xia YN, Wang LHV. Nano Lett. 2007;7:3798–3802. doi: 10.1021/nl072349r. [DOI] [PubMed] [Google Scholar]
- 119.Song KH, Kim CH, Cobley CM, Xia YN, Wang LV. Nano Lett. 2009;9:183–188. doi: 10.1021/nl802746w. [DOI] [PMC free article] [PubMed] [Google Scholar]
- 120.Kim C, Cho EC, Chen JY, Song KH, Au L, Favazza C, Zhang QA, Cobley CM, Gao F, Xia YN, Wang LHV. ACS Nano. 2010;4:4559–4564. doi: 10.1021/nn100736c. [DOI] [PMC free article] [PubMed] [Google Scholar]
- 121.Brooks PC, Montgomery AMP, Rosenfeld M, Reisfeld RA, Hu TH, Klier G, Cheresh DA. Cell. 1994;79:1157–1164. doi: 10.1016/0092-8674(94)90007-8. [DOI] [PubMed] [Google Scholar]
- 122.Ye YP, Chen XY. Theranostics. 2011:102–126. doi: 10.7150/thno/v01p0102. [DOI] [PMC free article] [PubMed] [Google Scholar]
- 123.Wang SJ, Huang P, Nie LM, Xing RJ, Liu DB, Wang Z, Lin J, Chen SH, Niu G, Lu GM, Chen XY. Adv Mater. 2013;25:3055–3061. doi: 10.1002/adma.201204623. [DOI] [PMC free article] [PubMed] [Google Scholar]
- 124.Kim C, Song HM, Cai X, Yao JJ, Wei A, Wang LHV. J Mater Chem. 2011;21:2841–2844. doi: 10.1039/C0JM04194G. [DOI] [PMC free article] [PubMed] [Google Scholar]
- 125.Preston TC, Signorell R. ACS Nano. 2009;3:3696–3706. doi: 10.1021/nn900883d. [DOI] [PubMed] [Google Scholar]
- 126.Mejac I, Bryan WW, Lee TR, Tran CD. Anal Chem. 2009;81:6687–6694. doi: 10.1021/ac9007495. [DOI] [PubMed] [Google Scholar]
- 127.Wang YW, Xie XY, Wang XD, Ku G, Gill KL, O’Neal DP, Stoica G, Wang LV. Nano Lett. 2004;4:1689–1692. [Google Scholar]
- 128.Li ML, Wang JC, Schwartz JA, Gill-Sharp KL, Stoica G, Wang LHV. J Biomed Opt. 2009:14. doi: 10.1117/1.3081556. [DOI] [PMC free article] [PubMed] [Google Scholar]
- 129.Lee HJ, Liu Y, Zhao J, Zhou M, Bouchard RR, Mitcham T, Wallace M, Stafford RJ, Li C, Gupta S, Melancon MP. J Controlled Release. 2013;172:152–158. doi: 10.1016/j.jconrel.2013.07.020. [DOI] [PMC free article] [PubMed] [Google Scholar]
- 130.Gad SC, Sharp KL, Montgomery C, Payne JD, Goodrich GP. Int J Toxicol. 2012;31:584–594. doi: 10.1177/1091581812465969. [DOI] [PubMed] [Google Scholar]
- 131.Nehl CL, Grady NK, Goodrich GP, Tam F, Halas NJ, Hafner JH. Nano Lett. 2004;4:2355–2359. [Google Scholar]
- 132.Huang P, Lin J, Li W, Rong P, Wang Z, Wang S, Wang X, Sun X, Aronova M, Niu G, Leapman RD, Nie Z, Chen X. Angew Chem, Int Ed. 2013;52:13958–13964. doi: 10.1002/anie.201308986. [DOI] [PMC free article] [PubMed] [Google Scholar]
- 133.Lin J, Wang S, Huang P, Wang Z, Chen S, Niu G, Li W, He J, Cui D, Lu G, Chen X, Nie Z. ACS Nano. 2013;7:5320–5329. doi: 10.1021/nn4011686. [DOI] [PMC free article] [PubMed] [Google Scholar]
- 134.He J, Huang X, Li YC, Liu Y, Babu T, Aronova MA, Wang S, Lu Z, Chen X, Nie Z. J Am Chem Soc. 2013;135:7974–7984. doi: 10.1021/ja402015s. [DOI] [PubMed] [Google Scholar]
- 135.Cheng K, Kothapalli SR, Liu H, Koh AL, Jokerst JV, Jiang H, Yang M, Li J, Levi J, Wu JC, Gambhir SS, Cheng Z. J Am Chem Soc. 2014;136:3560–3571. doi: 10.1021/ja412001e. [DOI] [PMC free article] [PubMed] [Google Scholar]
- 136.Zeng J, He R, Wang Y, Wang X, Wang Z, Liu G, Zhou W, Wen L, Li Q, Wang X, Chen X, Hou J. Nat Commun. 2014 doi: 10.1038/ncomms5327. [DOI] [PMC free article] [PubMed] [Google Scholar]
- 137.Kim JH, Bryan WW, Lee TR. Langmuir. 2008;24:11147–11152. doi: 10.1021/la8016497. [DOI] [PubMed] [Google Scholar]
- 138.Auer J, Berent R, Ng CK, Punzengruber C, Mayr H, Lassnig E, Schwarz C, Puschmann R, Hartl P, Eber B. J Heart Valve Dis. 2001;10:717–723. [PubMed] [Google Scholar]
- 139.Homan K, Shah J, Gomez S, Gensler H, Karpiouk A, Brannon-Peppas L, Emelianov S. J Biomed Opt. 2010:15. doi: 10.1117/1.3365937. [DOI] [PMC free article] [PubMed] [Google Scholar]
- 140.Homan KA, Souza M, Truby R, Luke GP, Green C, Vreeland E, Emelianov S. ACS Nano. 2012;6:641–650. doi: 10.1021/nn204100n. [DOI] [PMC free article] [PubMed] [Google Scholar]
- 141.Asharani PV, Lianwu Y, Gong Z, Valiyaveettil S. Nanotoxicology. 2011;5:43–54. doi: 10.3109/17435390.2010.489207. [DOI] [PubMed] [Google Scholar]
- 142.Johnston HJ, Hutchison G, Christensen FM, Peters S, Hankin S, Stone V. Crit Rev Toxicol. 2010;40:328–346. doi: 10.3109/10408440903453074. [DOI] [PubMed] [Google Scholar]
- 143.Li J, Zhu JJ. Analyst. 2013;138:2506–2515. doi: 10.1039/c3an36705c. [DOI] [PubMed] [Google Scholar]
- 144.Shashkov EV, Everts M, Galanzha EI, Zharov VP. Nano Lett. 2008;8:3953–3958. doi: 10.1021/nl802442x. [DOI] [PMC free article] [PubMed] [Google Scholar]
- 145.Yu SJ, Kang MW, Chang HC, Chen KM, Yu YC. J Am Chem Soc. 2005;127:17604–17605. doi: 10.1021/ja0567081. [DOI] [PubMed] [Google Scholar]
- 146.Liu JH, Yang ST, Chen XX, Wang H. Curr Drug Metab. 2012;13:1046–1056. doi: 10.2174/138920012802850083. [DOI] [PubMed] [Google Scholar]
- 147.Zhang B, Fang CY, Chang CC, Peterson R, Maswadi S, Glickman RD, Chang HC, Ye JY. Biomed Opt Express. 2012;3:1662–1629. doi: 10.1364/BOE.3.001662. [DOI] [PMC free article] [PubMed] [Google Scholar]
- 148.Egeblad M, Werb Z. Nat Rev Cancer. 2002;2:161–174. doi: 10.1038/nrc745. [DOI] [PubMed] [Google Scholar]
- 149.Yang K, Zhu L, Nie L, Sun X, Cheng L, Wu C, Niu G, Chen X, Liu Z. Theranostics. 2014;4:134. doi: 10.7150/thno.7217. [DOI] [PMC free article] [PubMed] [Google Scholar]
- 150.Levi J, Kothapalli SR, Ma TJ, Hartman K, Khuri-Yakub BT, Gambhir SS. J Am Chem Soc. 2010;132:11264–11269. doi: 10.1021/ja104000a. [DOI] [PMC free article] [PubMed] [Google Scholar]
- 151.Razansky D, Harlaar NJ, Hillebrands JL, Taruttis A, Herzog E, Zeebregts CJ, van Dam GM, Ntziachristos V. Mol Imaging Biol. 2012;14:277–285. doi: 10.1007/s11307-011-0502-6. [DOI] [PMC free article] [PubMed] [Google Scholar]
- 152.Ku G, Zhou M, Song S, Huang Q, Hazle J, Li C. ACS Nano. 2012;6:7489–7496. doi: 10.1021/nn302782y. [DOI] [PMC free article] [PubMed] [Google Scholar]
- 153.Zha Z, Zhang S, Deng Z, Li Y, Li C, Dai Z. Chem Commun. 2013;49:3455–3457. doi: 10.1039/c3cc40608c. [DOI] [PubMed] [Google Scholar]
- 154.Babes L, Denizot Bt, Tanguy G, Le Jeune JJ, Jallet P. J Colloid Interface Sci. 1999;212:474–482. doi: 10.1006/jcis.1998.6053. [DOI] [PubMed] [Google Scholar]
- 155.Reimer P, Tombach B. Eur Radiol. 1998;8:1198–1204. doi: 10.1007/s003300050535. [DOI] [PubMed] [Google Scholar]
- 156.Wang YX, Hussain SM, Krestin GP. Eur Radiol. 2001;11:2319–2331. doi: 10.1007/s003300100908. [DOI] [PubMed] [Google Scholar]
- 157.Taupitz M, Wagner S, Hamm B. Der Radiologe. 1996;36:134–140. doi: 10.1007/s001170050050. [DOI] [PubMed] [Google Scholar]
- 158.Grootendorst DJ, Jose J, Fratila RM, Visscher M, Velders AH, Ten Haken B, Van Leeuwen TG, Steenbergen W, Manohar S, Ruers TJ. Contrast Media Mol Imaging. 2013;8:83–91. doi: 10.1002/cmmi.1498. [DOI] [PubMed] [Google Scholar]
- 159.Grootendorst DJ, Fratila RM, Visscher M, Haken BT, van Wezel RJ, Rottenberg S, Steenbergen W, Manohar S, Ruers TJ. J Biophotonics. 2013;6:493–504. doi: 10.1002/jbio.201200204. [DOI] [PubMed] [Google Scholar]
- 160.Klerkx WM, Geldof AA, Heintz AP, van Diest PJ, Visser F, Mali WP, Veldhuis WB. J Magn Reson Imaging. 2011;33:1151–1159. doi: 10.1002/jmri.22539. [DOI] [PubMed] [Google Scholar]
- 161.Alwi R, Telenkov S, Mandelis A, Leshuk T, Gu F, Oladepo S, Michaelian K. Biomed Opt Express. 2012;3:2500–2509. doi: 10.1364/BOE.3.002500. [DOI] [PMC free article] [PubMed] [Google Scholar]
- 162.Xi L, Grobmyer SR, Zhou G, Qian W, Yang L, Jiang H. J Biophotonics. 2012;7:401–409. doi: 10.1002/jbio.201200155. [DOI] [PMC free article] [PubMed] [Google Scholar]
- 163.Huschka R, Zuloaga J, Knight MW, Brown LV, Nordlander P, Halas NJ. J Am Chem Soc. 2011;133:12247–12255. doi: 10.1021/ja204578e. [DOI] [PMC free article] [PubMed] [Google Scholar]
- 164.Huang X, Tang S, Mu X, Dai Y, Chen G, Zhou Z, Ruan F, Yang Z, Zheng N. Nat Nanotechnol. 2011;6:28–32. doi: 10.1038/nnano.2010.235. [DOI] [PubMed] [Google Scholar]
- 165.Bouchard LS, Anwar MS, Liu GL, Hann B, Xie ZH, Gray JW, Wang X, Pines A, Chen FF. Proc Natl Acad Sci U S A. 2009;106:4085–4089. doi: 10.1073/pnas.0813019106. [DOI] [PMC free article] [PubMed] [Google Scholar]
- 166.Liu Z, Li X, Tabakman SM, Jiang K, Fan S, Dai H. J Am Chem Soc. 2008;130:13540–13541. doi: 10.1021/ja806242t. [DOI] [PMC free article] [PubMed] [Google Scholar]
- 167.Robinson JT, Hong G, Liang Y, Zhang B, Yaghi OK, Dai H. J Am Chem Soc. 2012;134:10664–10669. doi: 10.1021/ja303737a. [DOI] [PMC free article] [PubMed] [Google Scholar]
- 168.Zhou F, Wu S, Yuan Y, Chen WR, Xing D. Small. 2012;8:1543–1550. doi: 10.1002/smll.201101892. [DOI] [PubMed] [Google Scholar]
- 169.De la Zerda A, Zavaleta C, Keren S, Vaithilingam S, Bodapati S, Liu Z, Levi J, Smith BR, Ma TJ, Oralkan O, Cheng Z, Chen X, Dai H, Khuri-Yakub BT, Gambhir SS. Nat Nanotechnol. 2008;3:557–562. doi: 10.1038/nnano.2008.231. [DOI] [PMC free article] [PubMed] [Google Scholar]
- 170.Hwang CM, Khademhosseini A, Park Y, Sun K, Lee SH. Langmuir. 2008;24:6845–6851. doi: 10.1021/la800253b. [DOI] [PubMed] [Google Scholar]
- 171.Cai X, Paratala BS, Hu S, Sitharaman B, Wang LV. Tissue Eng, Part C. 2012;18:310–317. doi: 10.1089/ten.tec.2011.0519. [DOI] [PMC free article] [PubMed] [Google Scholar]
- 172.de la Zerda A, Liu Z, Bodapati S, Teed R, Vaithilingam S, Khuri-Yakub BT, Chen X, Dai H, Gambhir SS. Nano Lett. 2010;10:2168–2172. doi: 10.1021/nl100890d. [DOI] [PMC free article] [PubMed] [Google Scholar]
- 173.Swierczewska M, Choi KY, Mertz EL, Huang X, Zhang F, Zhu L, Yoon HY, Park JH, Bhirde A, Lee S, Chen X. Nano Lett. 2012;12:3613–3620. doi: 10.1021/nl301309g. [DOI] [PMC free article] [PubMed] [Google Scholar]
- 174.Novoselov KS, Geim AK, Morozov SV, Jiang D, Zhang Y, Dubonos SV, Grigorieva IV, Firsov AA. Science. 2004;306:666–669. doi: 10.1126/science.1102896. [DOI] [PubMed] [Google Scholar]
- 175.Geim AK. Science. 2009;324:1530–1534. doi: 10.1126/science.1158877. [DOI] [PubMed] [Google Scholar]
- 176.Wang Y, Li Z, Wang J, Li J, Lin Y. Trends Biotechnol. 2011;29:205–212. doi: 10.1016/j.tibtech.2011.01.008. [DOI] [PMC free article] [PubMed] [Google Scholar]
- 177.Goenka S, Sant V, Sant S. J Controlled Release. 2014;173:75–88. doi: 10.1016/j.jconrel.2013.10.017. [DOI] [PubMed] [Google Scholar]
- 178.Zhu Y, Murali S, Cai W, Li X, Suk JW, Potts JR, Ruoff RS. Adv Mater. 2010;22:3906–3924. doi: 10.1002/adma.201001068. [DOI] [PubMed] [Google Scholar]
- 179.Dreyer DR, Park S, Bielawski CW, Ruoff RS. Chem Soc Rev. 2010;39:228–240. doi: 10.1039/b917103g. [DOI] [PubMed] [Google Scholar]
- 180.Lalwani G, Cai X, Nie L, Wang LV, Sitharaman B. Photoacoustics. 2013;1:62–67. doi: 10.1016/j.pacs.2013.10.001. [DOI] [PMC free article] [PubMed] [Google Scholar]
- 181.Wang Y-W, Fu Y-Y, Peng Q, Guo S-S, Liu G, Li J, Yang H-H, Chen G-N. J Mater Chem B. 2013;1:5762–5767. doi: 10.1039/c3tb20986e. [DOI] [PubMed] [Google Scholar]
- 182.Yang K, Hu L, Ma X, Ye S, Cheng L, Shi X, Li C, Li Y, Liu Z. Adv Mater. 2012;24:1868–1872. doi: 10.1002/adma.201104964. [DOI] [PubMed] [Google Scholar]
- 183.Patel MA, Yang H, Chiu PL, Mastrogiovanni DD, Flach CR, Savaram K, Gomez L, Hemnarine A, Mendelsohn R, Garfunkel E. ACS Nano. 2013;7:8147–8157. doi: 10.1021/nn403429v. [DOI] [PubMed] [Google Scholar]
- 184.Rong P, Yang K, Srivastan A, Kiesewetter DO, Yue X, Wang F, Nie L, Bhirde A, Wang Z, Liu Z. Theranostics. 2014;4:229–239. doi: 10.7150/thno.8070. [DOI] [PMC free article] [PubMed] [Google Scholar]
- 185.Gunes S, Neugebauer H, Sariciftci NS. Chem Rev. 2007;107:1324–1338. doi: 10.1021/cr050149z. [DOI] [PubMed] [Google Scholar]
- 186.Erb RM, Cherenack KH, Stahel RE, Libanori R, Kinkeldei T, Munzenrieder N, Troster G, Studart AR. ACS Appl Mater Interfaces. 2012;4:2860–2864. doi: 10.1021/am300508e. [DOI] [PubMed] [Google Scholar]
- 187.Pu K, Shuhendler AJ, Jokerst JV, Mei J, Gambhir SS, Bao Z, Rao J. Nat Nanotechnol. 2014;9:233–239. doi: 10.1038/nnano.2013.302. [DOI] [PMC free article] [PubMed] [Google Scholar]
- 188.Janata J, Josowicz M. Nat Mater. 2003;2:19–24. doi: 10.1038/nmat768. [DOI] [PubMed] [Google Scholar]
- 189.Hong JY, Yoon H, Jang J. Small. 2010;6:679–686. doi: 10.1002/smll.200902231. [DOI] [PubMed] [Google Scholar]
- 190.Zha Z, Yue X, Ren Q, Dai Z. Adv Mater. 2013;25:777–782. doi: 10.1002/adma.201202211. [DOI] [PubMed] [Google Scholar]
- 191.Zha Z, Deng Z, Li Y, Li C, Wang J, Wang S, Qu E, Dai Z. Nanoscale. 2013;5:4462–4467. doi: 10.1039/c3nr00627a. [DOI] [PubMed] [Google Scholar]
- 192.Liu J, Geng J, Liao L-D, Thakor N, Gao X, Liu B. Polym Chem. 2013;5:2854–2862. [Google Scholar]
- 193.Kohl Y, Kaiser C, Bost W, Stracke F, Fournelle M, Wischke C, Thielecke H, Lendlein A, Kratz K, Lemor R. Nanomed: Nanotechnol, Biol Med. 2011;7:228–237. doi: 10.1016/j.nano.2010.07.006. [DOI] [PubMed] [Google Scholar]
- 194.Hu J-S, Guo Y-G, Liang H-P, Wan L-J, Jiang L. J Am Chem Soc. 2005;127:17090–17095. doi: 10.1021/ja0553912. [DOI] [PubMed] [Google Scholar]
- 195.Drain CM, Varotto A, Radivojevic I. Chem Rev. 2009;109:1630–1658. doi: 10.1021/cr8002483. [DOI] [PMC free article] [PubMed] [Google Scholar]
- 196.Lovell JF, Jin CS, Huynh E, Jin HL, Kim C, Rubinstein JL, Chan WCW, Cao WG, Wang LV, Zheng G. Nat Mater. 2011;10:324–332. doi: 10.1038/nmat2986. [DOI] [PubMed] [Google Scholar]
- 197.Harris JM, Chess RB. Nat Rev Drug Discovery. 2003;2:214–221. doi: 10.1038/nrd1033. [DOI] [PubMed] [Google Scholar]
- 198.Huynh E, Lovell JF, Helfield BL, Jeon M, Kim C, Goertz DE, Wilson BC, Zheng G. J Am Chem Soc. 2012;134:16464–16467. doi: 10.1021/ja305988f. [DOI] [PubMed] [Google Scholar]
- 199.Hannah A, Luke G, Wilson K, Homan K, Emelianov S. ACS Nano. 2014;8:250–259. doi: 10.1021/nn403527r. [DOI] [PMC free article] [PubMed] [Google Scholar]
- 200.Wilson K, Homan K, Emelianov S. Nat Commun. 2012;3 doi: 10.1038/ncomms1627. [DOI] [PubMed] [Google Scholar]
- 201.Reznik N, Seo M, Williams R, Bolewska-Pedyczak E, Lee M, Matsuura N, Gariepy J, Foster FS, Burns PN. Phys Med Biol. 2012;57:7205–7217. doi: 10.1088/0031-9155/57/21/7205. [DOI] [PubMed] [Google Scholar]
- 202.Sheeran PS, Dayton PA. Curr Pharm Des. 2012;18:2152–2165. doi: 10.2174/138161212800099883. [DOI] [PMC free article] [PubMed] [Google Scholar]
- 203.Akers WJ, Kim C, Berezin M, Guo K, Fuhrhop R, Lanza GM, Fischer GM, Daltrozzo E, Zumbusch A, Cai X, Wang LV, Achilefu S. ACS Nano. 2011;5:173–182. doi: 10.1021/nn102274q. [DOI] [PMC free article] [PubMed] [Google Scholar]
- 204.Qu M, Mallidi S, Mehrmohammadi M, Truby R, Homan K, Joshi P, Chen YS, Sokolov K, Emelianov S. Biomed Opt Express. 2011;2:385–396. doi: 10.1364/BOE.2.000386. [DOI] [PMC free article] [PubMed] [Google Scholar]
- 205.Fox IJ, Brooker LG, Heseltine DW, Essex HE, Wood EH. Proc Staff Meet Mayo Clin. 1957;32:478–484. [PubMed] [Google Scholar]
- 206.Caesar J, Shaldon S, Chiandussi L, Guevara L, Sherlock S. Clin Sci. 1961;21:43–57. [PubMed] [Google Scholar]
- 207.Stenson RE, Constantino RT, Harrison DC. Circulation. 1971;43:205–211. doi: 10.1161/01.cir.43.2.205. [DOI] [PubMed] [Google Scholar]
- 208.Desmettre T, Devoisselle JM, Mordon S. Surv Ophthalmol. 2000;45:15–27. doi: 10.1016/s0039-6257(00)00123-5. [DOI] [PubMed] [Google Scholar]
- 209.Zhong J, Yang S, Zheng X, Zhou T, Xing D. Nanomedicine. 2013;8:903–919. doi: 10.2217/nnm.12.123. [DOI] [PubMed] [Google Scholar]
- 210.Zanganeh S, Li H, Kumavor PD, Alqasemi U, Aguirre A, Mohammad I, Stanford C, Smith MB, Zhu Q. J Biomed Opt. 2013;18:096006. doi: 10.1117/1.JBO.18.9.096006. [DOI] [PMC free article] [PubMed] [Google Scholar]
- 211.Kim C, Song KH, Gao F, Wang LV. Radiology. 2010;255:442. doi: 10.1148/radiol.10090281. [DOI] [PMC free article] [PubMed] [Google Scholar]
- 212.Wang X, Ku G, Wegiel MA, Bornhop DJ, Stoica G, Wang LV. Opt Lett. 2004;29:730–732. doi: 10.1364/ol.29.000730. [DOI] [PubMed] [Google Scholar]
- 213.Buehler A, Herzog E, Razansky D, Ntziachristos V. Opt Lett. 2010;35:2475–2477. doi: 10.1364/OL.35.002475. [DOI] [PubMed] [Google Scholar]
- 214.Koo J, Jeon M, Oh Y, Kang HW, Kim J, Kim C, Oh J. Phys Med Biol. 2012;57:7853–7862. doi: 10.1088/0031-9155/57/23/7853. [DOI] [PubMed] [Google Scholar]
- 215.Rajian JR, Fabiilli ML, Fowlkes JB, Carson PL, Wang X. Opt Express. 2011;19:14335–14347. doi: 10.1364/OE.19.014335. [DOI] [PMC free article] [PubMed] [Google Scholar]
- 216.Schirmer RH, Adler H, Pickhardt M, Mandelkow E. Neurobiol Aging. 2011:32. doi: 10.1016/j.neurobiolaging.2010.12.012. [DOI] [PubMed] [Google Scholar]
- 217.Kiesslich R, Fritsch J, Holtmann M, Koehler HH, Stolte M, Kanzler S, Nafe B, Jung M, Galle PR, Neurath MF. Gastroenterology. 2003;124:880–888. doi: 10.1053/gast.2003.50146. [DOI] [PubMed] [Google Scholar]
- 218.Song KH, Stein EW, Margenthaler JA, Wang LV. J Biomed Opt. 2008:13. doi: 10.1117/1.2976427. [DOI] [PMC free article] [PubMed] [Google Scholar]
- 219.Jeon M, Song WT, Huynh E, Kim J, Kim J, Helfield BL, Leung BYC, Goertz DE, Zheng G, Oh J, Lovell JF, Kim C. J Biomed Opt. 2014:19. doi: 10.1117/1.JBO.19.1.016005. [DOI] [PubMed] [Google Scholar]
- 220.Harrell MI, Iritani BM, Ruddell A. J Immunol Methods. 2008;332:170–174. doi: 10.1016/j.jim.2007.11.012. [DOI] [PMC free article] [PubMed] [Google Scholar]
- 221.Moitra J, Sammani S, Garcia JGN. Transl Res. 2007;150:253–265. doi: 10.1016/j.trsl.2007.03.013. [DOI] [PubMed] [Google Scholar]
- 222.Manaenko A, Chen H, Kammer J, Zhang JH, Tang JP. J Neurosci Methods. 2011;195:206–210. doi: 10.1016/j.jneumeth.2010.12.013. [DOI] [PMC free article] [PubMed] [Google Scholar]
- 223.Yao JJ, Maslov K, Hu S, Wang LHV. J Biomed Opt. 2009:14. doi: 10.1117/1.3251044. [DOI] [PMC free article] [PubMed] [Google Scholar]
- 224.Nie G, Hah HJ, Kim G, Lee YE, Qin M, Ratani TS, Fotiadis P, Miller A, Kochi A, Gao D, Chen T, Orringer DA, Sagher O, Philbert MA, Kopelman R. Small. 2012;8:884–891. doi: 10.1002/smll.201101607. [DOI] [PubMed] [Google Scholar]
- 225.Ray A, Wang XD, Lee YEK, Hah HJ, Kim G, Chen T, Orringer DA, Sagher O, Liu XJ, Kopelman R. Nano Res. 2011;4:1163–1173. doi: 10.1007/s12274-011-0166-1. [DOI] [PMC free article] [PubMed] [Google Scholar]
- 226.Liang XL, Deng ZJ, Jing LJ, Li XD, Dai ZF, Li CH, Huang MM. Chem Commun. 2013;49:11029–11031. doi: 10.1039/c3cc42510j. [DOI] [PubMed] [Google Scholar]
- 227.Hu S, Yan P, Maslov K, Lee JM, Wang LHV. Opt Lett. 2009;34:3899–3901. doi: 10.1364/OL.34.003899. [DOI] [PMC free article] [PubMed] [Google Scholar]
- 228.Tsien RY. Annu Rev Biochem. 1998;67:509–544. doi: 10.1146/annurev.biochem.67.1.509. [DOI] [PubMed] [Google Scholar]
- 229.Chalfie M, Tu Y, Euskirchen G, Ward WW, Prasher DC. Science. 1994;263:802–805. doi: 10.1126/science.8303295. [DOI] [PubMed] [Google Scholar]
- 230.Razansky D, Distel M, Vinegoni C, Ma R, Perrimon N, Koster RW, Ntziachristos V. Nat Photonics. 2009;3:412–417. [Google Scholar]
- 231.Filonov GS, Piatkevich KD, Ting LM, Zhang JH, Kim K, Verkhusha VV. Nat Biotechnol. 2011;29:757–U133. doi: 10.1038/nbt.1918. [DOI] [PMC free article] [PubMed] [Google Scholar]
- 232.Filonov GS, Krumholz A, Xia J, Yao JJ, Wang LHV, Verkhusha VV. Angew Chem, Int Ed. 2012;51:1448–1451. doi: 10.1002/anie.201107026. [DOI] [PMC free article] [PubMed] [Google Scholar]
- 233.Krumholz A, Shcherbakova DM, Xia J, Wang LHV, Verkhusha VV. Sci Rep. 2014:4. doi: 10.1038/srep03939. [DOI] [PMC free article] [PubMed] [Google Scholar]
- 234.Perez-Esteban B, Gomez-Pardo E, Penalva MA. J Bacteriol. 1995;177:6069–6076. doi: 10.1128/jb.177.21.6069-6076.1995. [DOI] [PMC free article] [PubMed] [Google Scholar]
- 235.Li L, Zemp RJ, Lungu G, Stoica G, Wang LV. J Biomed Opt. 2007;12:020504. doi: 10.1117/1.2717531. [DOI] [PubMed] [Google Scholar]
- 236.Cai X, Li L, Krumholz A, Guo Z, Erpelding TN, Zhang C, Zhang Y, Xia Y, Wang LV. PLoS One. 2012;7:e43999. doi: 10.1371/journal.pone.0043999. [DOI] [PMC free article] [PubMed] [Google Scholar]
- 237.Krumholz A, Vanvickle-Chavez SJ, Yao J, Fleming TP, Gillanders WE, Wang LV. J Biomed Opt. 2011;16:080503. doi: 10.1117/1.3606568. [DOI] [PMC free article] [PubMed] [Google Scholar]
- 238.Urabe K, Aroca P, Tsukamoto K, Mascagna D, Palumbo A, Prota G, Hearing VJ. Biochim Biophys Acta, Mol Cell Res. 1994;1221:272–278. doi: 10.1016/0167-4889(94)90250-x. [DOI] [PubMed] [Google Scholar]
- 239.Paproski RJ, Forbrich AE, Wachowicz K, Hitt MM, Zemp RJ. Biomed Opt Express. 2011;2:771–780. doi: 10.1364/BOE.2.000771. [DOI] [PMC free article] [PubMed] [Google Scholar]
- 240.Qin C, Cheng K, Chen K, Hu X, Liu Y, Lan X, Zhang Y, Liu H, Xu Y, Bu L. Sci Rep. 2013:3. doi: 10.1038/srep01490. [DOI] [PMC free article] [PubMed] [Google Scholar]
- 241.Ha SH, Carson AR, Kim K. Cytometry, Part A. 2012;81A:910–915. doi: 10.1002/cyto.a.22160. [DOI] [PMC free article] [PubMed] [Google Scholar]
- 242.U. FDA, Department of Health & Human Services, US Food and Drug Administration, Rockville, MD, 2007.


