

Abstract
When functioning properly, the intestine is one of the key interfaces between the human body and its environment. It is responsible for extracting nutrients from our food and excreting our waste products. It provides an environment for a host of healthful microbes and serves as a first defense against pathogenic ones. These processes require tight homeostatic controls, which are provided by the interactions of a complex mix of epithelial, stromal, neural and immune cells, as well as the resident microflora. This homeostasis can be disrupted by invasive microbes, genetic lesions, and carcinogens, resulting in diseases such Clostridium difficile infection, inflammatory bowel disease (IBD) and cancer. Enormous strides have been made in understanding how this important organ functions in health and disease using everything from cell culture systems to animal models to human tissue samples. This has resulted in better therapies for all of these diseases, but there is still significant room for improvement. In the United States alone, 14000 people per year die of C. difficile, up to 1.6 million people suffer from IBD, and more than 50000 people die every year from colon cancer. Because these and other intestinal diseases arise from complex interactions between the different components of the gut ecosystem, we propose that systems approaches that address this complexity in an integrative manner may eventually lead to improved therapeutics that deliver lasting cures. This review will discuss the use of systems biology for studying intestinal diseases in vivo with particular emphasis on mouse models. Additionally, it will focus on established experimental techniques that have been used to drive this systems-level analysis, and emerging techniques that will push this field forward in the future.
1. Introduction
1.1 Why use systems biology to study intestinal health and disease?
Evolution, due to its non-directed, non-design-driven nature, has generated substantial complexity in biological systems. Even the fundamental unit of biology, that of a cell, consists of many components that interact with each other to form dynamic complex networks.1 Additional types of complexity emerge at the organ level in vivo. In the intestine, the in vivo environment is characterized by interactions between epithelial, immune, muscle, neural and stromal cells, as well as interactions between these cell types and extracellular matrix components, secreted factors, and micro-organisms (Fig. 1). The reductionist view of biology maintains that the functional output of a single component or pathway dictates phenotypic behaviors. This view is drawn from in vitro cell culture experiments where simplicity is imposed by controlling individual components one at a time. However, because of the interconnectivity between components of in vivo biological systems, the effects of single perturbations are propagated throughout interaction networks.2 Hence, macroscopic phenotypic outcomes, like those involved in diseases, can be viewed as network state effects versus single pathway effects.
Fig. 1.
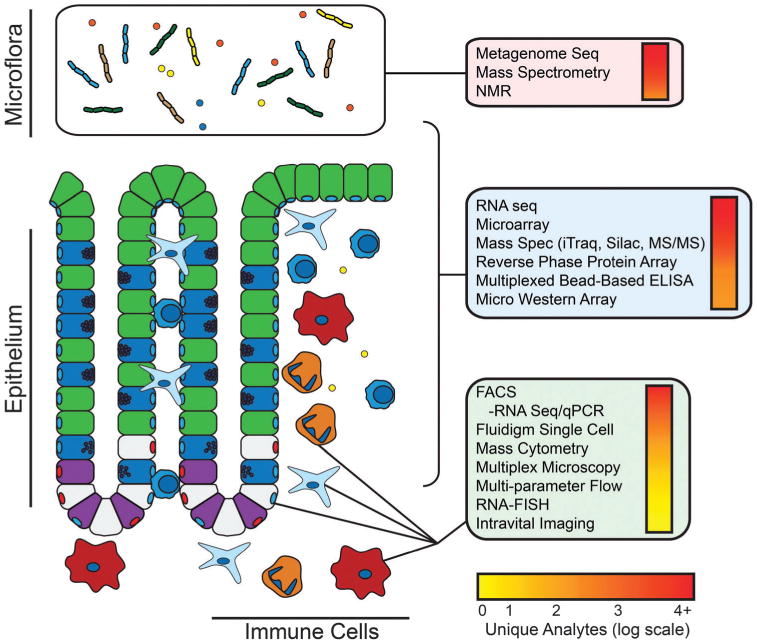
Gut function and disease is governed by interactions between the epithelium, the immune system and the gut microflora. These interactions are mediated by cell–cell contact, cytokines, metabolites, and microbial products. We propose that an integrative systems approach that engages with this complexity is necessary to fully understand these interactions and their impact on gut homeostasis and disease. This figure lists some of the techniques that can be applied to systems-level studies in the gut. Techniques in the red box are amenable to studies of the microflora; techniques in the blue box are suitable for bulk measurements encompassing all components of the gut ecosystem; techniques in the green box are suitable for single cell or population-based analysis. Experimental approaches are listed in descending order of coverage with the number of unique analytes denoted by the color bar.
Complexity of the intestinal system is best demonstrated by the interaction between the multitudes of bacterial species in the gut. Using a conservative estimate of ∼500–1000 species in the gut3 with ∼5000 genes per species, the combinatorial potential of interaction is enormous. Combinatorial complexity is a feature of evolution for maintaining the stability of biological processes in the face of constant perturbations – a property known as robustness.4,5 Maintaining a homeostatic network of interactions within bacterial communities prevents colonization of the gut by harmful foreign pathogens via mechanisms of competitive exclusion, stimulation of host immunity, and direct antagonism.6 These mechanisms are difficult to appreciate without considering the underlying combinatorial complexity at the systems-level, and thus, remain far from full characterization.
Systems biology is an approach to studying biological and biomedical problems from an integrative perspective. There are three main ways in which a systems approach can be useful. First, large scale data collection and network level analysis are ideally suited for screening for molecules and pathways that contribute to a given phenotype or can be targeted to produce a desired outcome. Second, these networks can be viewed as phenotypes in and of themselves and can be used prognostically or diagnostically to determine the effects of an intervention on a pathway of interest. Third, network-level analyses facilitate the identification of unexpected effects resulting from a perturbation. This may be extremely useful in identifying pathways to drug resistance, and in identifying secondary targets that will subvert the resistance mechanisms.
An ideal outcome of a systems-level investigation would consist of a model that represents all of the species in a system and their interactions. Furthermore, it would describe how particular network states relate to given outcomes. By knowing how the pieces of the network relate to one another and how those relationships relate to particular outcomes, the network could be engineered in order to produce a desired outcome. This could be used for deriving combinations of therapies that target not just proteins or pathways, but entire network states, and by extension, phenotypic outcomes. While this represents the ideal outcome of systems-level analysis, in actual practice, researchers are still building the experimental and analytical tools that would enable the production of complete models.
The barriers to a true systems-level understanding are many. The first barrier is technical: even with advances in data collection, it is impossible to measure all of the components of a system that may contribute to a given outcome. RNA-based techniques bring us closest, with typical RNAseq (RNA sequencing) platforms capable of measuring hundreds of thousands of transcripts down to the level of splice variants.7 Mass spectrometry has vastly accelerated our ability to interrogate protein abundance,8,9 however there are many important low-abundance or poor-flying proteins that evade detection by the current state-of-the-art techniques. Fluorescence imaging facilitates temporal interrogation of signaling, but only a very limited number of analytes can be assessed at a time. The second barrier to a full systems understanding is analytical: as we increase the dimensionality of our measurement space, we must adapt our analytical frameworks to deal with this increased complexity. To be truly useful in generating actionable hypotheses, these analytical frameworks must not only be comprehensive, but predictive as well. Unfortunately, as more species are included in a network, it becomes increasingly difficult to predictively model their mechanistic interactions. From current sampling of mathematical models constructed from biological data (Fig. 2), a general tradeoff can be observed between the mechanistic resolution of a model and the number of experimental conditions required to constrain each model parameter. To reduce the degrees of freedom and draw mechanistic conclusions from high dimensional data, the number of experimental conditions must increase in order to differentiate between correlative and causative interactions.
Fig. 2.
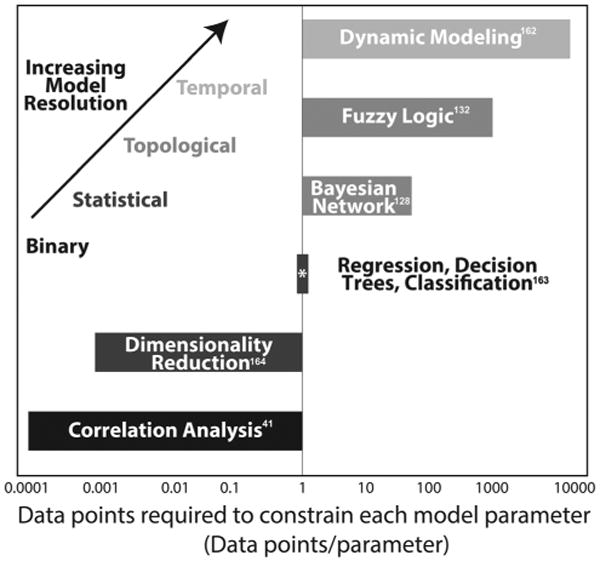
Increased mechanistic resolution of mathematical models require larger amounts of data to constrain each model parameter. The ratio of the number of parameters per model to number of experimental data points to build each model from a collection of mathematical models in the literature. 41,128,132,162–164
This is one of the main reasons that systems biology has been carried out primarily in vitro. Practically speaking, it is cheaper, faster and easier to get consistent results with large numbers of experimental perturbations using cell culture models than it is by using in vivo models or by testing human specimens. For these reasons, in vitro systems biology is extremely powerful for developing the experimental and analytical tools necessary for systems analysis. Furthermore, the large-scale connectivity networks that have been developed form the backbone of mechanistic systems models used for in vivo studies. However, while in vitro systems biology is extremely useful for understanding intra-cellular signaling networks, it is very difficult to mimic the full range of inter-cellular interactions that ultimately control outcome in living tissues. Even improved culture methods that involve multiple cell types and three-dimensional structure often fail to fully capture the behavior of a living tissue or organ. Lau et al. provided a powerful example of unexpected inter-cellular interactions driving tissue behavior when they found that a lack of adaptive immune cells increased apoptosis in response to TNF-α (tumor necrosis factor alpha) in the intestinal epithelium.10 Ultimately, this was the result of a compensatory proinflammatory environment (as underscored by IFN-γ – interferon gamma) induced by other epithelial and immune cell subtypes in the tissue. While IFN-γ and TNF-α have been shown to cooperate to induce apoptosis in vitro, the increased IFN-γ and the mechanisms that induce its production would not have been predicted by current state-of-the art cell culture models. While this paper speaks to the importance of using systems approaches to identify unexpected and novel tissue responses, part of the reason the modeling was able to produce actionable hypotheses was that the number of analytes (cytokines, immune cells, epithelial response) was relatively few for a systems study. Identifying the key components of a network and their mechanistic interactions becomes increasingly difficult as the number of analytes increases. Still, this paper provides a valuable example of the importance of using in vivo models when investigating tissue-level behavior using a systems approach.
In the same way that we think about molecular context in a cellular system, we must think about the tissue context when we try to expand to an organ or organismal system. While the outcome of activating a given pathway may be modified by the activities of other pathways, cell contact, or nutrients in an in vitro setting, an in vivo system is affected by these plus many other factors. Spatial and biophysical constraints, the presence of other cell types, access to oxygen, and the presence of microbes are just a few of the additional factors that may drive cellular, organ and organismal behavior. This complexity provides one of the strongest arguments for the need for systems approaches in studying intestinal diseases, however, it is also one of the chief obstacles to creating meaningful, actionable models. Even comparatively simple in vitro systems cannot be mechanistically modeled at the scale of many thousands of molecular species. This difficulty is further compounded by the complexity of the in vivo tissue environment. While the ultimate goal of producing computable systems-level models at the tissue and organismal scale may be out of reach with current measurement and analytic techniques, systems-level correlative studies have already been powerful tools for hypothesis generation and have enhanced our knowledge of human gastrointestinal function and disease.10,11 In this review we will discuss some of the ways that even incomplete models have provided key insights into intestinal disease, with particular emphasis on the measurement techniques that generate systems scale data, and the mouse as a model system, which has been an invaluable tool for generating hypotheses using systems-level measurement and analysis.
1.2 Mouse as a model system for in vivo systems analysis
Every system used to understand human health and disease has its advantages and disadvantages. Though human subjects certainly provide the best reflection of human physiology, patient tissue is not always readily available or sufficiently robust for experimental purposes. On the other end of the spectrum, cell lines are far more readily available and provide some of the same network architecture observed in human beings. However, since they lack many of the critical features of physiological space, they are not always an ideal platform for simulating human disease. Model organisms, such as rodents or zebrafish, have long been used to model human disease.12 These animal models have provided the means for numerous breakthroughs yet there can be significant drawbacks in their use that should be kept in mind.
First, we want to touch upon the use of humans as a model system for studying intestinal biology. A major challenge for performing human studies is the deficiency of well-defined experimental controls. The natural genetic variation present in human populations adds tremendous confounding variation to biological phenotypes. Specifically in regards to the gut, environmental factors such as dietary influences on the microbiome can further confound biological variation.13 Human social behavior, such as mental state and smoking habits, provides additional sources of variation and can also lead to non-compliance during intervention studies.14,15 Of course, the amount of variation that can be tolerated within human studies depends upon the phenotype being examined. A well-controlled study by Wu et al. examined the change in microbiome when human subjects were fed restricted diets while retained in a hospital setting for 10 days. Although changes in microbial species were examined, these changes were far outweighed by inter-individual variation, suggesting the genetics and environmental histories of the subjects play much more significant roles than the intervention.16 Evidence from twin studies suggests that there is an important component of heritability in Crohn's disease.17 Yet, similar concordance is not present for either severity or progression of disease.17,18 Furthermore, monozygotic twins display much less concordance in ulcerative colitis.19 While genetic variation can often be a confounding factor in studying human disease directly, approaches such as Genome Wide Association Studies (GWAS) leverage this natural variation in order to identify rare and complexly interacting genes and genomic regions associated with a given phenotype. For example, IBD GWAS have been fruitful in identifying 163 disease-associated loci.20,21 However due to many non-genetic variations within human populations, larger and larger sample sizes (some numbering in tens of thousands of patients) are required to find rare or interacting disease alleles.22 Furthermore, although these analyses identify regions of the genome that are correlated with disease, follow up work, often using cell and animal models, is required in order to confirm a given gene as the driver of the genetic association.
At present, rodents and zebrafish are the prevailing model organisms utilized in studying gastrointestinal disorders. Various features of the zebrafish have made them a desirable candidate for modeling GI illnesses such as CD (Crohn's disease) and UC (ulcerative colitis).23,24 For instance, organism transparency during the larval stage lends itself to sophisticated imaging techniques.25 Additionally, zebrafish are extremely fecund and long-term maintenance is relatively inexpensive. Their gastrointestinal tract is very similar to the human small and large intestine and the adult zebrafish possess an innate and adaptive immune system with many features resembling its human counterpart.26 The high degree of gene and protein homology have led to the use of zebrafish as an important tool for the study of IBD susceptibility genes. This platform could also prove beneficial for high-throughput screening of compounds suitable for IBD treatment.23 An important caveat, however, is that, while the immune system is fully developed by adulthood, at this stage in their life cycle, the organism is no longer transparent. This greatly minimizes one of the aforementioned benefits of this model organism, which is the ease of real-time in vivo imaging. Moreover, the current protocols for modeling IBD in zebrafish are mostly limited to the use of chemicals known as “haptens,” such as TNBS (trinitrobenzenesulfonic acid) and oxazolone.27 Though chemically inducing IBD is a laborious process, zebrafish larvae subjected to these treatments will develop many of the same histological characteristics of IBD observed in mice and humans.25 These include neutrophil infiltration, altered intestinal lipid metabolism, and goblet cell hypertrophy. However, the inflammatory response via haptens is not a perfect representation of human disease since, at this life stage, the zebrafish adaptive immune system is not fully functional.12 More critically, these haptens do not cause epithelial cell damage, an important hallmark of human UC and CD.25,27 Additionally, the experimental tools such as surface protein antibodies and associated reagents are less developed for zebrafish than for mice or humans.
Non-human primates, such as the rhesus macaque and the common marmoset, are immunologically and biologically closer to humans, certainly more so than rodents or zebrafish. The rhesus macaque and the cotton-top tamarin, a marmoset native to Colombia, are both known to develop spontaneous colitis when housed in captivity and display an increased incidence of chronic diarrhea.12,28 Primate models have been especially useful in the evaluation of gene therapy techniques and other intervention methods for IBD. In addition, the use of primate models has provided insight on the effect of sexual dimorphism in the development of IBD.29 However, these organisms have many obvious drawbacks to their use, chiefly the increased expense and effort related to their care. Similarly most work in primate models has been primarily observational and limited to studying the pathology of spontaneous incidence of chronic inflammation. The dearth of genetic tools is a critical drawback of this model organism.
Ultimately, given trade-offs in cost versus homology, the mouse still represents the best model system for addressing questions of intestinal disorder via systems approaches. Mouse models are relatively inexpensive, have a strong experimental tool kit, and reflect many aspects of human immune and gastrointestinal physiology. Additionally, numerous genetic and chemical models have been developed to study various aspects of gut health and disease, including stem cell function,30 inflammation,31 and cancer32 (Table 1). In the IBD field, for instance, there are five main classes of mouse models available for the study of GI-related inflammation.12 These include chemical induction models, cell transfer models, spontaneous models, congenital models, and genetically engineered models. Certainly no other organism has an equally well-developed assortment of IBD and GI tumor models.
Table 1. Common mouse models of intestinal pathologies165–176.
| Model | Disease modeled | Location | Details |
|---|---|---|---|
| Inflammatory bowel disease | |||
| DSS | Chemical damage | Colon | Epithelial cell toxicity followed by bacterial penetration and inflammatory reaction165 |
| TNBS | Chemical damage | Colon | Mucosal barrier damage followed by increased antigenicity166 |
| T-cell transfer | Ulcerative colitis or Crohn's disease | Colon and ileum | 1–3 month latency, high penetrance, severe mucosal inflammation. Crohn's-like cytokine profile; UC-like hyperproliferation, goblet cellloss167 |
| IL-10−/− | Crohn's disease (Colitis) | Colon and cecum | Variable mucosal inflammation dependent on microbiota, epithelial hyperplasia, inflammatory cell infiltration, loss of goblet cells168 |
| TNFΔARE/+ | Crohn's disease (Ileitis) | Terminal ileum (proximal colon) | Severe ileal transmural inflammation, mucosal/submucosal infiltration of inflammatory cells, increased goblet cells169 |
| Colorectal cancer | |||
| AOM/DSS | Colonic adenocarcinoma | Colon | Tubular adenoma, dysplasia, and colitis with mucosal ulceration170 |
| Lrig1CreERT2/Apcflox/+ | Adenoma and adenocarcinoma | Distal colon (small intestine) | Mainly distal colonic adenomas with high-grade dysplasia171 |
| ApcMin/+ | Adenoma | Small intestine and colon | Low-grade adenoma mainly in the small intestine172 |
| Fabpl-Cre; Apcflox/+; LSL-KrasG12D/+ | Adenoma and adenocarcinoma | Distal colon | High-grade dysplasia173 |
| Apcflox/+; LSL-K-rasG12D/+; adeno-cre after colonic abrasion | Adenoma and adenocarcinoma | Distal colon | Colonic tumors with high grade dysplasia and metastasis174 |
| Infection models | |||
| Citrobacter rodentium | Enteropathogenic E. coli (EPEC) and enterohemorrhagic E. coli (EHEC) | Colon and cecum | Crypt hyperplasia, goblet cell loss, mucosal infiltration, diarrhea175 |
| Salmonella-induced colitis (with antibiotic treatment) | Early (4–72 hours) intestinal events in salmonella infection | Colon and cecum | Mainly in cecum, epithelial hyperplasia and erosion, acute inflammation, goblet cell lost176 |
However, it is important to bear in mind that researchers must always exercise caution when extrapolating from mouse models to human physiology. There are numerous examples of mouse models failing to accurately reflect human biochemistry and disease.33,34 For instance, the development of intervention methods for IBD have often yielded conflicting results in human and mouse. Experimental therapies that have proven efficacious in rodents have not always proven equally effective in clinical trials using human patients.12 Additionally, significant evidence has implicated the importance of strain differences and diet modulation in murine research.35–39 Modeling chronic human diseases may also be limited by the relatively short lifespan of mice. Specifically, late stage metastasis in colon cancer has been difficult to model with the mouse, perhaps due to insufficient time to accumulate mutations given similar mutation and cell division rates in the mouse as human.40 With mice or any other model system, it is imperative to perform complementary studies in humans to confirm critical findings. We believe that systems approaches will be invaluable in this regard since they provide a more global outlook on a given health or disease state, enabling a more thorough comparison of how a mouse model may succeed or fail to reflect the human condition.
Below we will describe some of the powerful ways in which systems biology has been applied to mouse models of human intestinal biology. In particular, we will focus on the experimental techniques that have fueled this growing field and will propel it forward in the future (Table 2). We believe that this growing field, especially when combined with in vitro and human data, has tremendous promise for improving our understanding of intestinal diseases ranging from infection to inflammation to cancer. This enhanced understanding should provide insight into novel methods of treating diseases at the whole organ level, hopefully leading to better therapeutic outcomes for human patients.
Table 2. A subset of multiplex and -omics experimental approaches for obtaining quantitative data for systems biology, with approximate numbers of analytes measured from cited studies10,41,54,76,83,177–187.
| Experimental approach | Approximate number of analytes |
|---|---|
| Microbiome | |
| Metagenomic sequencing177 | 4 × 10⁶ |
| Mass spectrometry178 | 500–6000 |
| NMR179 | 500 |
| Bulk cell analysis | |
| RNASeq180 | 25 000 |
| Microarray41 | 40 000 |
| Mass spec (iTraq, SILAC)181 | 500–6000 |
| Reverse phase protein array182 | 150 |
| Multiplex bead based ELISA10 | 25–100 |
| Microwestern array54 | 100 |
| Single cell analysis | |
| Flow sorting RNAseq183 | 10 000 |
| Fluidigm single cell RNASeq180 | 6000 |
| Fluidigm biomark184 | 96 |
| CyTOF185 | 50 |
| Multiplex imaging76 | 60 |
| Multiparameter flow cytometry186 | 18 |
| Multiplex RNA FISH83 | 30 |
| Intravital imaging187 | 1–2 |
2. Tools for generating network-scale datasets from mouse tissues
2.1 RNA tools
Quantitative, network-scale studies of mammalian tissues have been ongoing since the early 2000s via the use of gene expression arrays.41 Of all the measurement techniques for interrogating biological systems, nucleic acid-based platforms including gene expression array and RNAseq provide the most comprehensive sampling. However, because gene expression is one level removed from the cellular machinery – the proteins and their modifications – that control function, signatures derived from these studies are correlative but do not necessarily reflect the causative factors that affect phenotypes. As such, these techniques have been most useful for classifying samples and for candidate gene identification. In the intestine for example, genes involved in neoplasia have been identified by comparing expressed genes between ApcMin (adenomatous polyposis coli multiple intestinal neoplasia) tumors and adjacent normal tissues.42 However, to best leverage the large scale of RNA-based measurements, computational tools for inferring signaling activity based on these profiles must be used. Using computational algorithms such as gene ontology enrichment43,44 and Gene Set Enrichment (GSEA),45 it is possible to identify not only the individual genes that are shared or differ, but also to infer biological processes and pathways that contribute to different phenotypic outcomes between samples.46 These techniques can be used for generating biological insights from multiple expression profile comparisons, for example, for distinguishing shared or divergent gene modules between mouse models and the human diseases they represent. This is important both as a basic scientific question and in choosing the best mouse to represent different aspects of human physiology or disease.
Gene expression analysis, when applied to small amounts of tissue, has the potential to expand current understanding of important biological phenomena. For instance, this technique could be of particular value in identifying and characterizing rare but significant cell populations, such as stem cells or circulating tumor cells.47,48 However, validation of single cell mRNA sequencing has not been without its challenges. Currently, many mRNA-sequencing protocols require anywhere from 1 ng to 10 ug of sample RNA.47 Acquiring RNA quantities on the nano- or microgram level is often unfeasible for single-cell transcriptomic analysis.49 As sufficient RNA cannot be directly obtained, a variety of protocols have been developed to sufficiently amplify the RNA pool in order to carry out next generation sequencing. mRNA transcripts undergo reverse transcription, after which double-stranded cDNA is amplified and fragmented for sequence library generation.50 RNA amplification methods, however, vary in their workflow and can introduce variation in the downstream sequencing analysis.47 In order to identify gene expression at single cell resolution, amplification protocols and sequencing approaches must be capable of accurately recapitulating the transcriptomic profile of individual cells. However, various factors should be taken into consideration when interpreting data from single cell sequence libraries. For instance, stochastic loss of low abundant transcripts is common when transcribing or amplifying cDNA.51 Insufficient amplification and subsequent transcript fragmentation can impede read coverage of rare transcripts. This ultimately results in enrichment of high abundant transcripts and skewing of the generated sequence library. Moreover, amplification also tends to induce a bias by preferentially enriching towards the 3′-end of transcripts. Generated fragments do not uniformly sample across the whole length of the transcript.50 As a result, having adequate read coverage for long transcripts becomes increasingly challenging as the levels of input RNA decrease. The 3′-end bias also impedes the detection of alternatively spliced isoforms of RNA transcripts.
While the development of RNA amplification methods has brought the field closer to accurate representation of transcriptomics of single cells, there is still significant room for improvement. Smart-seq, for instance, has demonstrated the capacity to overcome some common limitations of RNA amplification. Smart-seq works by converting poly(A)+ RNA to full-length cDNA via SMART (Switching mechanism at 5′ end of RNA template) switching technology.49 The addition of non-template “anchor sequences” to full-length cDNA enables efficient primer extension.49 PCR amplification generates sufficient cDNA to then construct Illumina-based sequence libraries. Application of this technique to early mouse embryos has revealed the presence of random monoallelic gene expression in embryonic and mature mammalian cells.51 Moreover, in comparison to various other mRNA amplification protocols adapted for single cells, Smart-seq technology provides improved read coverage and enables quantitative assessment of single cell transcriptomes.49 This improved read coverage augments identification and assessment of alternatively spliced exons and mRNA isoforms. However, there is still a sensitivity threshold where Smart-seq fails. For instance, this platform possesses limited ability to accurately and efficiently read transcripts longer than 4 Kb, which can minimize its utility in certain contexts.50 Furthermore, Smart-seq still demonstrates significant PCR biases during its amplification steps. Highly abundant transcripts are preferentially enriched while rarer transcripts are lost.50,51 Optimization of this and other amplification techniques remains vital for better characterization of single cell transcriptomes.
2.2 Protein tools
While RNA-based measurement techniques are extremely powerful for generating global patterns of expression, most of the cellular work is carried out by proteins. Fortunately, the number of tools becoming available to assess protein levels and modification at a large scale in tissues are increasing rapidly.52 Candidate approaches such as reverse phase protein lysate arrays53 and microwestern arrays54 have all been applied to study cell culture phenomena at various multivariate scales. Furthermore, approaches such as multiplexed bead-based ELISA (enzyme-linked immunosorbent assay) have been used to study acute and chronic inflammation in the mouse as well as culture models.11,55,56 These technologies are candidate-based such that antibody probes can be selected to generate high confidence data, even for low abundance or post-translationally modified proteins. However, because of their candidate-based nature, the investigator must have some prior knowledge of the important analytes to examine for each study.
Moving towards higher coverage, advances in mass spectrometry have enabled researchers to produce a more quantitative global understanding of protein abundance. The two most accurate techniques for measuring relative protein abundances between samples are SILAC (stable isotope labeling by/with amino acids in cell culture) and isobaric tagging (iTraq – isobaric tag for relative and absolute quantitation, TMT – Tandem mass tag). Both techniques work by differentially labeling proteins between samples with heavy metal isotopes and then analyzing all samples in one run. The main differences between the two techniques are the number of samples and the labeling procedure. For SILAC, proteins are tagged by providing isotopically labeled supplements live, such that the label is incorporated into proteins during metabolism. Because of the limited number of isotopes available for this type of labeling, only a few samples can be directly compared. Isobaric labeling is performed after removal of tissue, and, because there are more isobaric tags available, can be performed with up to 8 different samples in one run.57 SILAC has been applied to mouse models by feeding mice with a diet modified by isotope-labeled lysines. Using mass spectrometry, proteins that are differentially phosphorylated can be identified and quantified between different mice. This approach has been used for studying the signaling network alterations that occur during the progression of squamous cell carcinoma, using the 7,12-dimethylbenz(a)anthracene (DMBA)/12-O-tetradecanoylphorbol-13-acetate (TPA) mouse model.58 Isobaric tagging methods have also been applied to mouse models, and have been used to identify novel biomarkers of colorectal cancer from ApcMin mice.59
Although mass spectrometry techniques allow for unbiased sampling of the proteome, this technique still carries certain limitations. For both SILAC and TMT labeling, only a few samples can be analyzed at a time. Without a sufficient amount of data points to constrain the large number of parameters measured, it is not possible to build sophisticated models that depict biological complexity. This situation is similar to early microarray analyses performed with few samples, but many measured genes. This problem cannot be solved by simply performing multiple runs because the coverage of proteins detected by mass spectrometry can vary from run to run. At last, mass spectrometry tends to favor highly abundant proteins, while low abundant, but important proteins, are not detected.60
3. Moving from bulk measurements to single cells
3.1 Flow cytometry based-approaches
Flow cytometry has been a powerful tool for moving from bulk measurements down to subpopulations or even single cells. This technique relies on fluidic systems to pass cells one at a time past lasers which can detect cell size and granularity as well as fluorescence derived from dyes or fluorophore conjugated antibodies. These properties allow flow cytometry to be used in one of 3 ways: (1) cell type identification and counting, (2) sorting cell mixtures into homogeneous populations or single cells for collection and downstream analyses, and (3) direct quantification of proteins in individual cells. The field of immunology has been built upon using flow cytometry to identify and enumerate specific immune cell subsets using cell type specific markers (1). In the intestine, flow cytometry has been heavily used for profiling immune cells in the lamina propria. These include CD4+ (cluster of differentiation 4) helper, CD8+ cytotoxic T cells in response to food antigens in the gut,61 Foxp3+ (forkhead box P3) T regulatory cells (Tregs) induced by microbiota,62,63 dendritic cell interaction with the intestinal epithelium,64 and various innate lymphoid cell subsets interactions with the microbiota,65–67 macrophages and Tregs.68 For intestinal epithelial cells, flow cytometry has mostly been utilized for sorting and collecting epithelial stem cell populations using surface markers such as CD24 and CD44 (2).69 Sorted intestinal cell populations can then be further analyzed, for example, by qPCR (quantitative polymerase chain reaction).70 Alternatively, using multiplexed flow cytometry, protein abundances can be determined within those populations directly (3). For example, tumor initiating potential of colorectal cancer cell subpopulations can be determined by the levels of a panel of cancer stem cell surface markers.71 Although the number of analytes has been limited by the number of unique fluorochromes and their spectral overlaps, the recent development of mass cytometry or Cytometry Time-of-Flight (CyTOF) has enabled the number of markers analyzed to increase several fold. This growing technology uses heavy metal-labelled reagents in lieu of fluorescently labelled antibodies. Because heavy metals have minimal mass overlap, up to 100 protein analytes can be identified and quantified in single cells.72 Another method that overcomes fluorescence spectral overlap is DNA conjugation coupled to Nanostring barcode detection,73 which has been used to detect over 90 protein analytes in fine needle aspirates.74 These highly multiplexable technologies enable high resolution phenotypic profiling of individual cells, which can lead to significant biological insight into how multiple cell types contribute to a tissue phenotype at a systems-level. Advantages of flow cytometry-based approaches include whole cell quantification (without sectioning cells into partial cell fragments as with in situ approaches), and the thorough sampling of cells from tissues. While these techniques can provide high-dimensional information at the single-cell level, it should be noted that, once the tissue is in single cell suspension, all spatial information is lost.
3.2 In situ microscopy approaches
To maintain spatial information for single cell studies, microscopy-based approaches to quantify protein and nucleic acid analytes at single cell resolution are constantly being improved. Conventional and spectral deconvolution fluorescent microscopy, like flow cytometry, is limited by spectral overlap for accurate quantification. One strategy to enable high multiplexity with immunofluorescent microscopy is dye/reagent cycling. One example of this approach is the GE MultiOmyx™ technology, which utilizes chemical-based photo-deactivation after every round of imaging to allow multiple antibodies conjugated to the same set of fluorochromes to be used in iterative cycles of staining. Using algorithmic software processing routines that register cells from different staining rounds and segment individual cells by sub-cellular markers, MultiOmyx has been used to quantify in excess of 60 different protein analytes from single cells in formalin-fixed paraffin embedded tissue sections.75,76 Analogous to the development of CyTOF, the use of heavy metal-labelled reagents in conjunction with mass spectrometry-based imaging can also enable high multiplexity.77,78 A recent emerging imaging technology is to leverage tissue clearing strategies and biophysical matrices to preserve the 3-dimensional architecture of a cleared, transparent tissue for 3D imaging (CLARITY).79,80 Future developments of these promising technologies for robust multiplex applications will further our understanding of spatial relationships and communication mechanisms between individual cells in tissue contexts.
Imaging gene expression has been made possible by RNA fluorescence in situ hybridization (FISH). RNA-FISH has been used for visualizing the expression of stem cell genes within the intestinal epithelium in native tissue context at single-cell resolution.81 Similar to protein immunofluorescence, RNA-FISH is also limited by the spectral properties of fluorochromes. To enable high multiplexity, the Church group has developed a rolling circle-based RNAseq method (fluorescent in situ RNA sequencing – FISSEQ), where amplification of the cDNA sequence as tandem repeats allows for multiple rounds of stripping and re-hybridization of probes with the same set of fluorochromes.82 Likewise, the Cai group has developed RNA in situ hybridization techniques that either use combinatorial fluorescence83 or sequential hybridization84 to generate barcodes and enable multiplex quantification of gene expression via imaging.
While in situ imaging approaches maintain spatial resolution, sophisticated and powerful image processing algorithms are required for segmenting individual cells for analysis. Since each tissue type has cells with different morphologies, these algorithms have to be tailored made. Furthermore, the accuracy of quantification is reduced since sectioned cell fragments are analyzed; it is very difficult to control how much of each cell is sectioned during the tissue preparation process. This problem is further compounded by the sampling of a localized population of cells via tissue sectioning, thus, important details of heterogeneity may be missing unless serial sectioning of the whole tissue is performed. Lastly, both flow cytometry and in situ techniques are endpoint assays, meaning that one cannot follow individual cells over time. This limitation hampers dynamic analysis of single cells because one cannot directly link early events to later phenomena.
3.3 Intravital imaging
At present, the only way to incorporate both spatial and temporal dynamics at the single cell level is via intravital imaging. Advances in imaging modalities such as two photon microscopy allow researchers to track populations of cells in vivo at depths of up to 1.6 mm.85 This can be used to track cell migration in vivo in real time and can be used to construct detailed 3-dimensional images of tissues with higher clarity than techniques such as confocal microscopy. Another approach for intravital imaging is confocal endoscopy. For this procedure, a confocal microscope is mounted directly to an endoscope, which can be used to fluorescently image the colon.86,87 Coupled with emerging varieties of live-cell biosensors that measure, for example, Erk (extracellular-signal-regulated kinase) activation88 or cell proliferation,89,90 intravital imaging may be used for identifying and quantifying cell types in the mucosa of living, sedated animals. Intravital imaging has been used in the intestine to follow single stem cells through an abdominal window in combination with a confetti reporter driven by the stem cell marker Lgr5 (leucine-rich repeat-containing G-protein coupled receptor 5).91 This work provides strong evidence for a model called neutral competition. In this model, stem cells divide symmetrically but stochastically compete for space within the stem cell niche, such that differentiation and renewal occurs at equal probability to maintain homeostasis. This result confirms previous mathematical modeling of stem cell neutral competition,92 where individual outcomes of cell fate follow a stochastic process but stem cell population dynamics provide deterministic outcomes. While studies such as these show that intravital imaging can be extremely powerful in revealing spatiotemporal dynamics within living tissues, these approaches are not yet amenable to network-level studies because they cannot detect more than a handful of colors/analytes at a given time.
4. Microbiome and metagenomics
In recent years, the improved cost and efficiency of next-generation sequencing platforms has greatly facilitated the study of the intestinal microbiome. This has vastly improved our ability to not only screen for and identify novel pathogens involved in gut diseases,93 but to study microbial communities at the population level as well. Due to the relative ease and lack of invasiveness of sample collection, compared to other systems approaches, microbiome studies are perhaps most amenable to human studies. Changes in intestinal microbiome have been associated with everything from obesity,94,95 to gestational diabetes,96 to schizophrenia97 in human subjects. Generally, these effects are correlated with population-level changes in microbial population. The use of mice may help in identifying which segments of these pathogenic communities are directly causative of disease and the mechanisms by which they wield their effects. One of the key methods by which this can be accomplished is through the use of gnotobiotic mice with humanized microbiomes.98,99 Humanized mice are produced by maintaining recipient animals in germ-free conditions followed by transplantation with human fecal innoculates. Through this method, population level structure of the microbiome is maintained, although there may be changes at the species or OTU (operational taxonomic unit) level.98 These mice have been used to assess the microbiome's effects on traits such as obesity and susceptibility to infection by pathogenic bacteria such as Salmonella.100 It should also be noted that this same study indicates that the mouse immune system does not mature as fully when it develops in the presence of a humanized microbiome. Furthermore, the methods to correctly identify bacteria at the species lever are still in development and shotgun approaches can both over-estimate species diversity101,102 and miss rare species that are present within samples.103 While these mice can be very useful as hypothesis generators, as with all mouse models of human disease, results must be confirmed in human subjects before drawing any firm conclusions.
In addition to understanding the role of intestinal microbes in disease, there has been a great deal of interest in how the microbiome can be used to improve health. Intestinal microbiota are known to have important nutritional consequences, including vitamin synthesis and fermentation of complex dietary carbohydrates. In the colonic lumen, clostridia and bifidobacteria ferment dietary fiber into SCFAs (short chain fatty acids) such as butyrate, propionate, and acetate.104 Butyrate is a crucial component of the large intestine and contributes to colonocyte proliferation, differentiation, and maturation.105 Additionally, propionate is known to induce Foxp3+ IL-10-producing T regulatory cells via Ffar2 (free fatty acid receptor 2).105 Luminal levels of SCFAs play an important role in immune modulation, enteric neuron function,106 and epithelial cell maintenance. On a systems scale, metabolomics techniques such as correlative NMR (nuclear magnetic resonance) have been used to profile the metabolic capability of the microbiome and its associations with pathologies such as infection.107 The metabolic potential of the microbiome can also be inferred simply from metabolic genes expressed, using meta-genomic analyses such as PICRUSt (phylogenetic investigation of communities by reconstruction of unobserved states).107–109 However, clinical attempts to replace certain gut metabolites exogenously have been largely inconclusive, mainly due to the vast combinatorial complexity in the microbial metabolome. As with other forms of high-dimensional measurement such as RNAseq and microarray, the techniques used to identify microbial molecular species have outpaced the computational and statistical tools needed to fully model and understand the interactions present in the system. Improved computational tools will be necessary if the field is to move from higher-level understanding of populations of bacteria to mechanistic modeling of the genetic and metabolic interactions that define the microbial compartment.
Another approach that has not required gene-level understanding is replacement of the whole microbiome of a diseased individual with a healthy microbiome through fecal transplant. This approach has been extremely effective, particularly for treating infections like Clostridium difficile.110–112 Patients who have shown poor response to conventional antibiotics and exhibit relapsing infection, have shown profound responses to fecal transplantation from healthy donors. This technique has already been implemented very successfully with up to 90% cure rates,112–114 and studies in humanized mice may enable researchers to gain insight into the populations of bacteria that produce the best patient outcomes. Additionally, a recent paper from the Pamer group has shown how mouse models and meta-genomics can be used to identify single species, and particular metabolic functions of that species, that can enhance resistance to C. difficile infection.115 In this paper, the authors used a series of antibiotic perturbations to alter the microbiome of mice prior to challenge with C. difficile. By correlating the resulting microbiomes with susceptibility to infection and comparing that with patient data, the authors identified a different species of Clostridium with an important role in bile acid metabolism that provided resistance to infection. Approaches such as these may eventually enable researchers and clinicians to identify the key components of the microbiome that provide resistance to infection, and to begin standardizing this very powerful therapeutic tool.
5. Systems biology in mouse models
5.1 Advantages of genetic perturbations
One of the reasons that the mouse is such a powerful experimental tool is its genetic tractability and the large numbers of genetic models of human diseases that are already available to researchers (Table 1). Often based on human genetic data, mouse models have been generated that mimic features of intestinal inflammation and cancers. Intestinal-specific expression or knockout can be controlled by techniques such as the Cre–Lox recombination system.116 Additionally, genes can be targeted by techniques such as RNA interference117,118 and CRISPR-CAS (clustered regularly interspaced short palindromic repeats-CRISPR associated).119 Using the experimental methods described above, these models can be used to generate systems-level understanding of the mechanisms of action of genetic lesions associated with human pathologies, or to identify unknown genetic events that may drive these diseases.
Alongside traditional transgenic approaches, an emerging discipline known as systems genetics may provide additional clues as to the genetic origins of intestinal function. This approach generates variation in mouse models for systems-level studies by harnessing the natural variation between different strains of mice.120 Instead of strictly looking at genes and traits, for example, by using haplotype based computational genetic mapping,121 one can also leverage the natural variation in signaling sensitivity between different mouse strains to study network behaviors. Genetic variation between mouse strains can be used in lieu of targeted perturbations for systems-level studies. These variations can then be mapped back to pathways if genomic information is available. The Collaborative Cross, an effort to generate additional genomically characterized inbred lines from eight commonly used but diverse inbred mouse strains, will be a valuable resource in the future for studying mice with a spectrum of variation that can be leveraged for systems-level studies.122
5.2 Computational modeling of in vivo datasets
Many theoretical approaches have been developed over the years to model biological behaviors at multiple scales. Much effort has been dedicated to deriving insights from systems-level data generated from cell culture. However, in vivo systems are poor candidates for traditional approaches that assume changes in the network state occur through predictable continuous pathways in predetermined network topologies due to their inherent heterogeneity. Probabilistic approaches based upon statistics are more appropriate for analyzing data that are generated from in vivo organisms by experimental systems biology approaches. Here, we give a brief introduction to some of the modeling approaches used for in vivo systems data sets. For a more thorough review, see Wood et al. in this issue.
Dimension reduction statistical approaches
An elegant approach to interpreting large in vivo datasets is to classify or cluster phenotypic outcomes by measured components (protein/gene expression states, etc.) in multivariate space. A commonly used technique is principal component analysis (PCA), which uses a mathematical algorithm to reduce the dimensionality of the data while maintaining most of the variation in the dataset123 (Fig. 3A). PCA introduces new variables called principal components that are linear combinations of the original variables. Principal components can be assessed by the amount of information (variance) captured, and, thus, plotting a few principal components with the maximal information content allows for the direct visualization of similarities and differences between samples in multi-dimensional space.123 A supervised version of PCA, which allows for correlation between independent and dependent variables, called partial least squares regression (PLSR), has been used successfully to infer how changes in signaling network are correlated with cell death and proliferative outcomes.11,124,125 Since PCA-based approaches use linear combinations of variables to form components, nonlinear relationships between the variables are not always apparent. t-SNE (t-distributed stochastic neighbor embedding) is a space-maintaining dimension reduction approach that preserves nonlinearity of the data.126 For visualization, SPADE (sequential pattern discovery using equivalence classes)127 combines spanning tree analysis with clustering to delineate relationships between samples and/or cells.
Fig. 3.
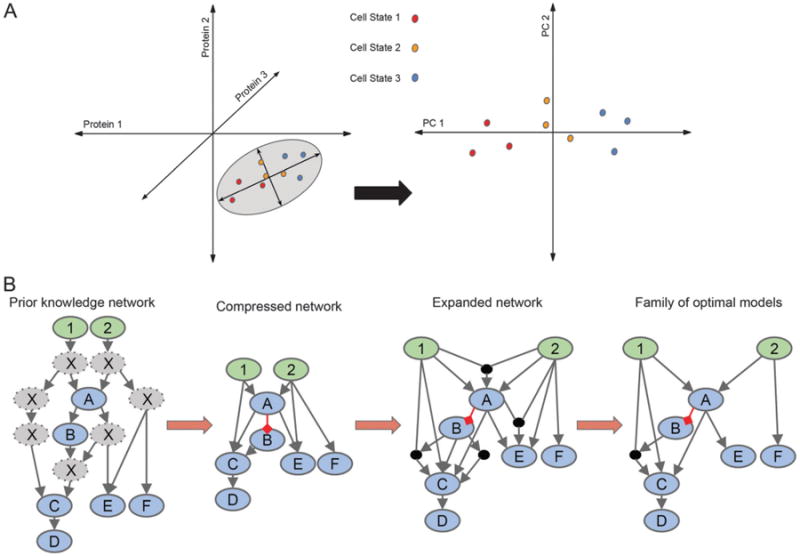
Quantitative modeling of multidimensional data. (A) Principal component analysis can be used for interpreting multivariate data by reducing dimensionality. In this simple example, cells are plotted (left plot) in 3D according to expression levels of three proteins. The grey ellipse encircles the axes that contain the most variation in the data, the principal components. The data aligned to the principal components in 2D (right plot) allows for easier visualization of the difference(s) in the data. In this case, the three cell states are more easily identified. (B) Logic-based modeling can be used for constructing a family of optimal models from a prior knowledge network (PKN) with a given set of inputs (green nodes) and observables (blue nodes). The PKN is compressed by removing all unobservables (grey nodes) while maintaining connectivity of nodes downstream. Grey arrows represent activation, while red arrows represent inhibition. To allow for all possible connections, the network is expanded. A family of optimal models is derived using experimental data.
Bayesian networks
Bayesian-based methods are stochastic methods used to determine model parameters from a posterior probability distribution derived from experimental data.128,129 These methods utilize a likelihood function that increases the predictability with the number of datasets used to train the system. Graph theory and probability meet in Bayesian methods where variables are represented as nodes and their relationships through acyclic edges. The Bayesian parameters can be modeled as discrete, continuous, or both, and temporally, the system can be modeled as static or dynamic. The result is an ensemble of feasible solutions that is more predictable and robust than a single best fit solution. Two popular and freely available software packages that incorporate Bayesian methods are SloppyCell and BioBayes.130,131
Logic modeling
An important goal of systems-level analysis is the derivation of a biological network's topology. Traditionally, a pathway's or network's topology is determined painstakingly from decades of experiments, which then are cataloged in the literature. Because the topology of a network can change depending on biological context (e.g., cell type), it is difficult to derive the correct network strictly from mining the literature. Logic-based modeling uses a technique borrowed from engineering that derives relationships from systems-level data with guidance from a prior knowledge network (PKN)132 (Fig. 3B). A PKN is first initiated by enumerating all components and connections that are included directly or indirectly in the data from the literature or databases. The PKN is then collapsed to exclude nodes and edges that have not been explicitly measured while maintaining logical consistency. Next, the modified PKN is fit to the experimental data using a logic-based objective function to determine an optimal set of networks, with each network in this set considered equally viable. Finally, the quality of each edge is statistically assessed by its representation in an ensemble of models. CellNetOptimizer is an example of a freely available logic-based modeling software.133
5.3 Considerations for systems biology studies in mice
Studying biological phenomena in in vivo settings provides the advantage of physiological significance and relevance. However, studying organisms in vivo presents its own set of challenges for the design of controlled experiments. While one can largely control for extrinsic factors like diet and drug treatments when doing mouse experiments, even inbred mice have additional sources of variation intrinsic to each animal such as sex and age that can affect the outcome of an experiment. These variations can sometimes override the effects of intended experimental perturbations. However, if one is aware of these variations from the outset of experimental design, one can adjust for these confounding effects with statistical analyses.134
Sex
The most obvious controllable variable is the sex of the animal. Aside from sex organ-specific differences, there are many physiological differences prescribed by the presence of a Y-chromosome. Examples include differences in hormone levels,135 neuronal development and responses affecting behavior,136,137 metabolism, and fat storage.138 A particular hormonal influence that dramatically affects the interpretation of mouse studies is the use of tamoxifen to activate estrogen receptor-based inducible Cre recombinase, which can subsequently affect normal estrogen receptor function and hormonal balance. Tamoxifen use has also been associated with atrophy and metaplasia of the gastric epithelium,139 even in the absence of any floxed alleles.
Age
Aging is associated with cellular and physiological changes. As such, aging itself is a systems-level phenomenon that results from the integration of multiple inputs and outputs occurring at different levels. Changes in oxidative stress, endocrine functions, and metabolism occurring at the organismal level can have effects down to the cellular level. Stem cell function is drastically reduced in aged mice, resulting in defects in bone marrow140 and intestinal regeneration.141 The latter effect contributes to malabsorption of nutrients and subsequent changes in metabolism.142 Thymus involution occurs in early adulthood resulting in the exhaustion of T cells later in life, a major contributor to immunosenescence.143 Imbalance of the immune system with age can lead to chronic, low grade inflammation called “inflammaging”.144 Changes in the immune system, diet, and gastrointestinal environment with age lead to alterations in the microbiome.145,146 These are a few specific examples, but it should be borne in mind that the multitude of changes that occur with age may have profound effects on many biological processes.
Strain differences
Mice from different strains and sub-strains are produced via multiple generations of inbreeding. Their overall genetic compositions can vary significantly, with some even harboring homozygous recessive alleles and mutations. As such, phenotypes observed in one mouse strain either at steady state or under perturbation are very likely to be influenced by its genetic background. Thus, comparing the effect of a specific perturbation should be performed under one background or with added caution if performed across multiple backgrounds. An example of a strain-specific effect is the susceptibility to dextran sodium sulfate-induced colitis due to variation in immunity genes.147,148 As described above, systems genetics and strain-specific differences can be leveraged to link suites of genes to changes in phenotype.
Microbiome
Recent research has shed light on the drastic influences of the microbiome on vertebrate organism physiology, including metabolism and immunity. The establishment of the microbiome is a function of not only inherent features such as genetics, but the environment where the organism is housed and raised as well. Mice from the same strain exhibit different biological behaviors if they are acquired from different sources. For example, C57BL6 mice exhibit divergent Th17 (T helper 17) differentiation in the gut depending on whether they originate from Taconic Farms, Jackson Laboratories or Charles River.149 Human studies suggest that the adult microbiome is relatively stable,16 and is established through a chaotic process during the first year of life when dietary richness and environmental exposures are increased. Importantly, dizygotic twins show significant similarity in early temporal profile gut microbiome development, demonstrating the importance of early fostering.150 There has been evidence suggesting that the adult mouse microbiome is not as stable and can be changed within days.151 Cage specific effects are strong and can account for up to 30% of variation. These effects can be reduced by mixing bedding and/or medium term co-housing for weeks, although these approaches may not result in perfect normalization.152 A better strategy may be to begin with littermates or germ free mice followed by co-housing, although only a limited number of mice can be studied by this strategy.
Circadian rhythm
The day-night cycle also greatly affects vertebrate organism physiology. For example, light–dark cycles neurologically affect feeding behaviors,153 and circadian genes like Bmal1 cyclically regulate cytokine secretion and immune function.154,155 Cyclic regulation of toll-like receptors can also affect bacterial pathogenesis and microbiome balance.156 To control for these variations, in vivo experiments should be performed and repeated at similar stages of the circadian cycle.
6. Discussion
Technological advances during the latter half of the 20th century enabled scientists to interrogate biological systems down to the molecular level and ushered in a golden age of reductionist biomedicine. By understanding how genes and proteins are structured and function at the molecular level, we have been able to design targeted therapies for many clinically important diseases including cancer,157 inflammation,158 and infection.159 While these reductionist approaches have been extremely successful in increasing life span and quality for many patients, there are many others for whom these treatments eventually fail. In colon cancer or IBD, treatments based on initiator genes and proteins often show periods of efficacy followed by relapse.160 In some cases this relapse is triggered by compensatory mutations within the target gene or pathway, while in other cases, mutations activating independent pathways or network adaptation without mutation can drive resistance. Understanding and targeting these compensatory mechanisms may prove effective in driving disease remission, with the caveat that these successes might be met with secondary resistance resulting in cyclical rounds of treatment and resistance.
Drugs that have even a partial effect or a short-term cure provide immense benefits to patients. However, better treatments and complete cures remain the goal for scientists, physicians and the patients they serve. For systems biologists, the best route to improving therapies is to view these diseases not from the perspective of the single genes and proteins that drive them, but from the integrative perspective of the whole disease network. This has been born out at the intracellular level using in vitro cell culture systems to map interaction networks and to identify network architectures that drive disease-related phenotypes. As our understanding of these architectures and the available tools for measuring nodes (whether they be at the level of RNA, protein or cell type) in vivo have improved, we are entering an era where we will possess an integrated understanding of disease and health at the organ and organismal level.
The field of systems biology, particularly in vivo, is still in its infancy and exactly how this type of understanding will translate to better therapies remains an open question. In the ideal scenario, computable tissue-level networks would be leveraged to design combination therapies capable of shifting a tissue from a disease state to a healthy one. Several systems biology driven companies have been founded based on the principles and techniques described above, and have achieved success in bringing drugs to the clinic based on in vitro systems modeling.161 However, it is important to recognize that the field of systems biology is still growing and there are many limitations to reaching a fully realized systems understanding of any disease. At present, it is impossible to measure and meaningfully model all of the components of any given system. However, by incorporating as many of those system-level interactions as possible into our understanding of a given organ, we will be able to better design therapies that attack the disease network, and we will be able to better understand how the network responds to drive resistance.
Here, we have discussed some of the ways in which systems biology has been used to study intestinal disease in the mouse and some of the techniques that will drive this growing field forward in the future. This approach will be extremely useful in identifying paradigms of tissue-level systems behavior and in determining candidate networks that may be operative in human disease. Furthermore, systems-level understanding will enable us to calibrate our mouse models to determine which ones best recapitulate human tissue behavior and which parts of human networks are well-represented by a given model. This will be of benefit directly to systems biologists and to researchers utilizing mouse models for reductionist approaches. This knowledge can be leveraged to identify new therapeutic approaches for diseases affecting not only the intestine directly, but many diseases of distant organ systems that are caused or modified by intestinal health. While the field of in vivo systems biology is still in its infancy, there is every reason to hope that it will provide massive value not only to researchers, but also to patients suffering from diseases such as cancer, C. difficile infection and IBD.
Insight, innovation, integration.
We address the technological advances and challenges for investigating complex pathological phenomena occurring within the gut. The intestine can be studied as a complex system with three major domains: the intestinal epithelium, the immune system, and the gut flora. Complexity emerges from numerous interactions that occur within and between each of these domains. The murine intestine is the closest and most applicable mammalian experimental system to study human conditions. Innovative, “big data” experimental technologies to interrogate this complex system can be viewed as a continuum, from those with genome-wide coverage to those with cellular and spatio-temporal resolution. We further discuss data integration techniques for deriving insight from large-scale data, and considerations for using mouse models as a platform for systems-level studies of human diseases.
Acknowledgments
J.L. is funded by Crohn's and Colitis Foundation of America Research Fellowship Award. K.S.L. is partially funded by a Crohn's and Colitis Foundation Career Development Award (308221), a career development award from the Vanderbilt GI SPORE (P50-CA095103), and pilot project grants from the Vanderbilt-Ingram Cancer Center (P30-CA068485) and the Vanderbilt Digestive Disease Research Center (P30-DK058404). K.S.L. is indebted to the VICC Young Ambassadors for their generous funding. C.A.H. is funded by the Training Program in Stem Cell and Regenerative Developmental Biology at Vanderbilt (T32-HD007502). The authors regret their inability to exhaustively enumerate all mouse models of intestinal diseases due to space constraints.
Biographies

Dr. Jesse Lyons is a postdoctoral fellow at MIT and Beth-Israel Deaconess Medical Center working in the labs of Doug Lauffenburger and Kevin Haigis. He is currently applying system approaches to in vitro organoids, in vivo mouse models and human patient samples in order to produce an integrative understanding of Inflammatory Bowel Disease. Prior to starting his postdoctoral training, Dr. Lyons received his PhD in cancer biology in the laboratory of Dr. Frank McCormick at the University of California, San Francisco.

Dr. Ken Lau is an assistant professor of Cell and Development Biology at Vanderbilt University Medical Center. Dr. Lau is interested in using quantitative system biology approaches to understand cell decision processes and signal transduction in animal models. His current research utilizes novel single cell analyses to dissect tissue level organization in vivo, with a special focus on the mammalian intestinal epithelium and its associated pathologies. Dr. Lau received joint-postdoctoral training at MIT and MGH with Drs. Douglas Lauffenburger and Kevin Haigis prior to starting his lab in 2013. He was the first graduate of the Proteomics and Bioinformatics PhD program at the University of Toronto (08′) with Dr. James Dennis.
Footnotes
Conflicts of interest: The authors declare no competing financial interests.
References
- 1.Barabasi AL, Oltvai ZN. Nat Rev Genet. 2004;5:101–113. doi: 10.1038/nrg1272. [DOI] [PubMed] [Google Scholar]
- 2.Pritchard JR, Lauffenburger DA, Hemann MT. Drug Resist Updates. 2012;15:249–257. doi: 10.1016/j.drup.2012.10.003. [DOI] [PMC free article] [PubMed] [Google Scholar]
- 3.Xu J, Gordon JI. Proc Natl Acad Sci U S A. 2003;100:10452–10459. doi: 10.1073/pnas.1734063100. [DOI] [PMC free article] [PubMed] [Google Scholar]
- 4.Ay N, Flack J, Krakauer DC. Philos Trans R Soc, B. 2007;362:441–447. doi: 10.1098/rstb.2006.1971. [DOI] [PMC free article] [PubMed] [Google Scholar]
- 5.Kim J, Vandamme D, Kim JR, Munoz AG, Kolch W, Cho KH. PLoS Comput Biol. 2014;10:e1003763. doi: 10.1371/journal.pcbi.1003763. [DOI] [PMC free article] [PubMed] [Google Scholar]
- 6.Buffie CG, Pamer EG. Nat Rev Immunol. 2013;13:790–801. doi: 10.1038/nri3535. [DOI] [PMC free article] [PubMed] [Google Scholar]
- 7.Wang Z, Gerstein M, Snyder M. Nat Rev Genet. 2009;10:57–63. doi: 10.1038/nrg2484. [DOI] [PMC free article] [PubMed] [Google Scholar]
- 8.Dephoure N, Gygi SP. Sci Signaling. 2012;5:rs2. doi: 10.1126/scisignal.2002548. [DOI] [PMC free article] [PubMed] [Google Scholar]
- 9.Wu R, Haas W, Dephoure N, Huttlin EL, Zhai B, Sowa ME, Gygi SP. Nat Methods. 2011;8:677–683. doi: 10.1038/nmeth.1636. [DOI] [PMC free article] [PubMed] [Google Scholar]
- 10.Lau KS, Cortez-Retamozo V, Philips SR, Pittet MJ, Lauffenburger DA, Haigis KM. PLoS Biol. 2012;10:e1001393. doi: 10.1371/journal.pbio.1001393. [DOI] [PMC free article] [PubMed] [Google Scholar]
- 11.Lau KS, Juchheim AM, Cavaliere KR, Philips SR, Lauffenburger DA, Haigis KM. Sci Signaling. 2011;4:ra16. doi: 10.1126/scisignal.2001338. [DOI] [PMC free article] [PubMed] [Google Scholar]
- 12.Conn PM. Animal models for the study of human disease. Elsevier; London, Waltham, MA: 2013. [Google Scholar]
- 13.Albenberg LG, Wu GD. Gastroenterology. 2014;146:1564–1572. doi: 10.1053/j.gastro.2014.01.058. [DOI] [PMC free article] [PubMed] [Google Scholar]
- 14.Nahon S, Lahmek P, Saas C, Durance C, Olympie A, Lesgourgues B, Gendre JP. Inflammatory Bowel Dis. 2011;17:1270–1276. doi: 10.1002/ibd.21482. [DOI] [PubMed] [Google Scholar]
- 15.Pittet V, Rogler G, Mottet C, Froehlich F, Michetti P, de Saussure P, Burnand B, Vader JP. Scand J Gastroenterol. 2014;49:662–673. doi: 10.3109/00365521.2014.896408. [DOI] [PubMed] [Google Scholar]
- 16.Wu GD, Chen J, Hoffmann C, Bittinger K, Chen YY, Keilbaugh SA, Bewtra M, Knights D, Walters WA, Knight R, Sinha R, Gilroy E, Gupta K, Baldassano R, Nessel L, Li H, Bushman FD, Lewis JD. Science. 2011;334:105–108. doi: 10.1126/science.1208344. [DOI] [PMC free article] [PubMed] [Google Scholar]
- 17.Orholm M, Binder V, Sorensen TI, Rasmussen LP, Kyvik KO. Scand J Gastroenterol. 2000;35:1075–1081. doi: 10.1080/003655200451207. [DOI] [PubMed] [Google Scholar]
- 18.Halme L, Paavola-Sakki P, Turunen U, Lappalainen M, Farkkila M, Kontula K. World J Gastroenterol. 2006;12:3668–3672. doi: 10.3748/wjg.v12.i23.3668. [DOI] [PMC free article] [PubMed] [Google Scholar]
- 19.Horiya M, Kakizaki S, Teshigawara K, Kikuchi Y, Hashida T, Tomizawa Y, Iida T, Masuo T, Takagi H, Mori M. World J Gastroenterol. 2005;11:7547–7549. doi: 10.3748/wjg.v11.i47.7547. [DOI] [PMC free article] [PubMed] [Google Scholar]
- 20.Khor B, Gardet A, Xavier RJ. Nature. 2011;474:307–317. doi: 10.1038/nature10209. [DOI] [PMC free article] [PubMed] [Google Scholar]
- 21.Jostins L, Ripke S, Weersma RK, Duerr RH, McGovern DP, Hui KY, Lee JC, Schumm LP, Sharma Y, Anderson CA, Essers J, Mitrovic M, Ning K, Cleynen I, Theatre E, Spain SL, Raychaudhuri S, Goyette P, Wei Z, Abraham C, Achkar JP, Ahmad T, Amininejad L, Ananthakrishnan AN, Andersen V, Andrews JM, Baidoo L, Balschun T, Bampton PA, Bitton A, Boucher G, Brand S, Buning C, Cohain A, Cichon S, D'Amato M, De Jong D, Devaney KL, Dubinsky M, Edwards C, Ellinghaus D, Ferguson LR, Franchimont D, Fransen K, Gearry R, Georges M, Gieger C, Glas J, Haritunians T, Hart A, Hawkey C, Hedl M, Hu X, Karlsen TH, Kupcinskas L, Kugathasan S, Latiano A, Laukens D, Lawrance IC, Lees CW, Louis E, Mahy G, Mansfield J, Morgan AR, Mowat C, Newman W, Palmieri O, Ponsioen CY, Potocnik U, Prescott NJ, Regueiro M, Rotter JI, Russell RK, Sanderson JD, Sans M, Satsangi J, Schreiber S, Simms LA, Sventoraityte J, Targan SR, Taylor KD, Tremelling M, Verspaget HW, De Vos M, Wijmenga C, Wilson DC, Winkelmann J, Xavier RJ, Zeissig S, Zhang B, Zhang CK, Zhao H, Silverberg MS, Annese V, Hakonarson H, Brant SR, Radford-Smith G, Mathew CG, Rioux JD, Schadt EE, Daly MJ, Franke A, Parkes M, Vermeire S, Barrett JC, Cho JH. Nature. 2012;491:119–124. doi: 10.1038/nature11582. [DOI] [PMC free article] [PubMed] [Google Scholar]
- 22.Walters WA, Xu Z, Knight R. FEBS Lett. 2014;588:4223–4233. doi: 10.1016/j.febslet.2014.09.039. [DOI] [PMC free article] [PubMed] [Google Scholar]
- 23.Oehlers SH, Flores MV, Hall CJ, Swift S, Crosier KE, Crosier PS. Dis Models & Mech. 2011;4:832–841. doi: 10.1242/dmm.006122. [DOI] [PMC free article] [PubMed] [Google Scholar]
- 24.Allen IC. Dis Models & Mech. 2011;4:711–712. doi: 10.1242/dmm.008805. [DOI] [PMC free article] [PubMed] [Google Scholar]
- 25.Fleming A, Jankowski J, Goldsmith P. Inflammatory Bowel Dis. 2010;16:1162–1172. doi: 10.1002/ibd.21200. [DOI] [PubMed] [Google Scholar]
- 26.Yang Y, Tomkovich S, Jobin C. Inflammatory Bowel Dis. 2014;20:956–966. doi: 10.1097/01.MIB.0000442923.85569.68. [DOI] [PMC free article] [PubMed] [Google Scholar]
- 27.Goldsmith JR, Jobin C. J Biomed Biotechnol. 2012;2012:817341. doi: 10.1155/2012/817341. [DOI] [PMC free article] [PubMed] [Google Scholar]
- 28.Blackwood RS, Tarara RP, Christe KL, Spinner A, Lerche NW. Comp Med. 2008;58:81–87. [PMC free article] [PubMed] [Google Scholar]
- 29.t'Hart BA, Vervoordeldonk M, Heeney JL, Tak PP. Gene Ther. 2003;10:890–901. doi: 10.1038/sj.gt.3302017. [DOI] [PubMed] [Google Scholar]
- 30.Barker N, van Es JH, Kuipers J, Kujala P, van den Born M, Cozijnsen M, Haegebarth A, Korving J, Begthel H, Peters PJ, Clevers H. Nature. 2007;449:1003–1007. doi: 10.1038/nature06196. [DOI] [PubMed] [Google Scholar]
- 31.Mizoguchi A. Prog Mol Biol Transl Sci. 2012;105:263–320. doi: 10.1016/B978-0-12-394596-9.00009-3. [DOI] [PubMed] [Google Scholar]
- 32.Washington MK, Powell AE, Sullivan R, Sundberg JP, Wright N, Coffey RJ, Dove WF. Gastroenterology. 2013;144:705–717. doi: 10.1053/j.gastro.2013.01.067. [DOI] [PMC free article] [PubMed] [Google Scholar]
- 33.Seok J, Warren HS, Cuenca AG, Mindrinos MN, Baker HV, Xu W, Richards DR, McDonald-Smith GP, Gao H, Hennessy L, Finnerty CC, Lopez CM, Honari S, Moore EE, Minei JP, Cuschieri J, Bankey PE, Johnson JL, Sperry J, Nathens AB, Billiar TR, West MA, Jeschke MG, Klein MB, Gamelli RL, Gibran NS, Brownstein BH, Miller-Graziano C, Calvano SE, Mason PH, Cobb JP, Rahme LG, Lowry SF, Maier RV, Moldawer LL, Herndon DN, Davis RW, Xiao W, Tompkins RG. Proc Natl Acad Sci U S A. 2013;110:3507–3512. doi: 10.1073/pnas.1222878110. [DOI] [PMC free article] [PubMed] [Google Scholar]
- 34.Rangarajan A, Hong SJ, Gifford A, Weinberg RA. Cancer Cell. 2004;6:171–183. doi: 10.1016/j.ccr.2004.07.009. [DOI] [PubMed] [Google Scholar]
- 35.Rinella ES, Bankaitis ED, Threadgill DW. Cancer Biol Ther. 2012;13:130–137. doi: 10.4161/cbt.13.3.18690. [DOI] [PMC free article] [PubMed] [Google Scholar]
- 36.La Merrill M, Harper R, Birnbaum LS, Cardiff RD, Threadgill DW. Environ Health Perspect. 2010;118:596–601. doi: 10.1289/ehp.0901047. [DOI] [PMC free article] [PubMed] [Google Scholar]
- 37.Gordon RR, La Merrill M, Hunter KW, Sorensen P, Threadgill DW, Pomp D. Clin Exp Metastasis. 2010;27:279–293. doi: 10.1007/s10585-010-9326-z. [DOI] [PMC free article] [PubMed] [Google Scholar]
- 38.Powell CL, Bradford BU, Craig CP, Tsuchiya M, Uehara T, O'Connell TM, Pogribny IP, Melnyk S, Koop DR, Bleyle L, Threadgill DW, Rusyn I. Toxicol Sci. 2010;115:131–139. doi: 10.1093/toxsci/kfq031. [DOI] [PMC free article] [PubMed] [Google Scholar]
- 39.La Merrill M, Kuruvilla BS, Pomp D, Birnbaum LS, Threadgill DW. Environ Health Perspect. 2009;117:1414–1419. doi: 10.1289/ehp.0800530. [DOI] [PMC free article] [PubMed] [Google Scholar]
- 40.Bozic I, Antal T, Ohtsuki H, Carter H, Kim D, Chen S, Karchin R, Kinzler KW, Vogelstein B, Nowak MA. Proc Natl Acad Sci U S A. 2010;107:18545–18550. doi: 10.1073/pnas.1010978107. [DOI] [PMC free article] [PubMed] [Google Scholar]
- 41.Zhang W, Morris QD, Chang R, Shai O, Bakowski MA, Mitsakakis N, Mohammad N, Robinson MD, Zirngibl R, Somogyi E, Laurin N, Eftekharpour E, Sat E, Grigull J, Pan Q, Peng WT, Krogan N, Greenblatt J, Fehlings M, van der Kooy D, Aubin J, Bruneau BG, Rossant J, Blencowe BJ, Frey BJ, Hughes TR. J Biol. 2004;3:21. doi: 10.1186/jbiol16. [DOI] [PMC free article] [PubMed] [Google Scholar]
- 42.Leclerc D, Deng L, Trasler J, Rozen R. J Cell Biochem. 2004;93:1242–1254. doi: 10.1002/jcb.20236. [DOI] [PubMed] [Google Scholar]
- 43.Huang da W, Sherman BT, Lempicki RA. Nat Protoc. 2009;4:44–57. doi: 10.1038/nprot.2008.211. [DOI] [PubMed] [Google Scholar]
- 44.Huang da W, Sherman BT, Lempicki RA. Nucleic Acids Res. 2009;37:1–13. doi: 10.1093/nar/gkn923. [DOI] [PMC free article] [PubMed] [Google Scholar]
- 45.Subramanian A, Tamayo P, Mootha VK, Mukherjee S, Ebert BL, Gillette MA, Paulovich A, Pomeroy SL, Golub TR, Lander ES, Mesirov JP. Proc Natl Acad Sci U S A. 2005;102:15545–15550. doi: 10.1073/pnas.0506580102. [DOI] [PMC free article] [PubMed] [Google Scholar]
- 46.Cornish AJ, Markowetz F. PLoS Comput Biol. 2014;10:e1003808. doi: 10.1371/journal.pcbi.1003808. [DOI] [PMC free article] [PubMed] [Google Scholar]
- 47.Rothwell DG, Li Y, Ayub M, Tate C, Newton G, Hey Y, Carter L, Faulkner S, Moro M, Pepper S, Miller C, Blackhall F, Bertolini G, Roz L, Dive C, Brady G. BMC Genomics. 2014;15:1129. doi: 10.1186/1471-2164-15-1129. [DOI] [PMC free article] [PubMed] [Google Scholar]
- 48.Janes KA, Wang CC, Holmberg KJ, Cabral K, Brugge JS. Nat Methods. 2010;7:311–317. doi: 10.1038/nmeth.1442. [DOI] [PMC free article] [PubMed] [Google Scholar]
- 49.Ramskold D, Luo S, Wang YC, Li R, Deng Q, Faridani OR, Daniels GA, Khrebtukova I, Loring JF, Laurent LC, Schroth GP, Sandberg R. Nat Biotechnol. 2012;30:777–782. doi: 10.1038/nbt.2282. [DOI] [PMC free article] [PubMed] [Google Scholar]
- 50.Bhargava V, Head SR, Ordoukhanian P, Mercola M, Subramaniam S. Sci Rep. 2014;4:3678. doi: 10.1038/srep03678. [DOI] [PMC free article] [PubMed] [Google Scholar]
- 51.Deng Q, Ramskold D, Reinius B, Sandberg R. Science. 2014;343:193–196. doi: 10.1126/science.1245316. [DOI] [PubMed] [Google Scholar]
- 52.Janes KA, Albeck JG, Peng LX, Sorger PK, Lauffenburger DA, Yaffe MB. Mol Cell Proteomics. 2003;2:463–473. doi: 10.1074/mcp.M300045-MCP200. [DOI] [PubMed] [Google Scholar]
- 53.Sevecka M, MacBeath G. Nat Methods. 2006;3:825–831. doi: 10.1038/NMETH931. [DOI] [PMC free article] [PubMed] [Google Scholar]
- 54.Ciaccio MF, Wagner JP, Chuu CP, Lauffenburger DA, Jones RB. Nat Methods. 2010;7:148–155. doi: 10.1038/nmeth.1418. [DOI] [PMC free article] [PubMed] [Google Scholar]
- 55.Kreeger PK, Mandhana R, Alford SK, Haigis KM, Lauffenburger DA. Cancer Res. 2009;69:8191–8199. doi: 10.1158/0008-5472.CAN-09-1921. [DOI] [PMC free article] [PubMed] [Google Scholar]
- 56.McBee ME, Zeng Y, Parry N, Nagler CR, Tannenbaum SR, Schauer DB. PLoS One. 2010;5:e13277. doi: 10.1371/journal.pone.0013277. [DOI] [PMC free article] [PubMed] [Google Scholar]
- 57.Miraldi ER, Sharfi H, Friedline RH, Johnson H, Zhang T, Lau KS, Ko HJ, Curran TG, Haigis KM, Yaffe MB, Bonneau R, Lauffenburger DA, Kahn BB, Kim JK, Neel BG, Saghatelian A, White FM. Integr Biol. 2013;5:940–963. doi: 10.1039/c3ib40013a. [DOI] [PMC free article] [PubMed] [Google Scholar]
- 58.Zanivan S, Meves A, Behrendt K, Schoof EM, Neilson LJ, Cox J, Tang HR, Kalna G, van Ree JH, van Deursen JM, Trempus CS, Machesky LM, Linding R, Wickstrom SA, Fassler R, Mann M. Cell Rep. 2013;3:552–566. doi: 10.1016/j.celrep.2013.01.003. [DOI] [PubMed] [Google Scholar]
- 59.Hammoudi A, Song F, Reed KR, Jenkins RE, Meniel VS, Watson AJ, Pritchard DM, Clarke AR, Jenkins JR. Biochem Biophys Res Commun. 2013;440:364–370. doi: 10.1016/j.bbrc.2013.08.076. [DOI] [PubMed] [Google Scholar]
- 60.Kito K, Ito T. Curr Genomics. 2008;9:263–274. doi: 10.2174/138920208784533647. [DOI] [PMC free article] [PubMed] [Google Scholar]
- 61.Korneychuk N, Ramiro-Puig E, Ettersperger J, Schulthess J, Montcuquet N, Kiyono H, Meresse B, Cerf-Bensussan N. Gastroenterology. 2014;146:1017–1027. doi: 10.1053/j.gastro.2013.12.023. [DOI] [PubMed] [Google Scholar]
- 62.Atarashi K, Tanoue T, Oshima K, Suda W, Nagano Y, Nishikawa H, Fukuda S, Saito T, Narushima S, Hase K, Kim S, Fritz JV, Wilmes P, Ueha S, Matsushima K, Ohno H, Olle B, Sakaguchi S, Taniguchi T, Morita H, Hattori M, Honda K. Nature. 2013;500:232–236. doi: 10.1038/nature12331. [DOI] [PubMed] [Google Scholar]
- 63.Cebula A, Seweryn M, Rempala GA, Pabla SS, McIndoe RA, Denning TL, Bry L, Kraj P, Kisielow P, Ignatowicz L. Nature. 2013;497:258–262. doi: 10.1038/nature12079. [DOI] [PMC free article] [PubMed] [Google Scholar]
- 64.Shan M, Gentile M, Yeiser JR, Walland AC, Bornstein VU, Chen K, He B, Cassis L, Bigas A, Cols M, Comerma L, Huang B, Blander JM, Xiong H, Mayer L, Berin C, Augenlicht LH, Velcich A, Cerutti A. Science. 2013;342:447–453. doi: 10.1126/science.1237910. [DOI] [PMC free article] [PubMed] [Google Scholar]
- 65.Klose CS, Kiss EA, Schwierzeck V, Ebert K, Hoyler T, d'Hargues Y, Goppert N, Croxford AL, Waisman A, Tanriver Y, Diefenbach A. Nature. 2013;494:261–265. doi: 10.1038/nature11813. [DOI] [PubMed] [Google Scholar]
- 66.Klose CS, Flach M, Mohle L, Rogell L, Hoyler T, Ebert K, Fabiunke C, Pfeifer D, Sexl V, Fonseca-Pereira D, Domingues RG, Veiga-Fernandes H, Arnold SJ, Busslinger M, Dunay IR, Tanriver Y, Diefenbach A. Cell. 2014;157:340–356. doi: 10.1016/j.cell.2014.03.030. [DOI] [PubMed] [Google Scholar]
- 67.Hepworth MR, Monticelli LA, Fung TC, Ziegler CG, Grunberg S, Sinha R, Mantegazza AR, Ma HL, Crawford A, Angelosanto JM, Wherry EJ, Koni PA, Bushman FD, Elson CO, Eberl G, Artis D, Sonnenberg GF. Nature. 2013;498:113–117. doi: 10.1038/nature12240. [DOI] [PMC free article] [PubMed] [Google Scholar]
- 68.Mortha A, Chudnovskiy A, Hashimoto D, Bogunovic M, Spencer SP, Belkaid Y, Merad M. Science. 2014;343:1249288. doi: 10.1126/science.1249288. [DOI] [PMC free article] [PubMed] [Google Scholar]
- 69.Gracz AD, Fuller MK, Wang F, Li L, Stelzner M, Dunn JC, Martin MG, Magness ST. Stem Cells. 2013;31:2024–2030. doi: 10.1002/stem.1391. [DOI] [PMC free article] [PubMed] [Google Scholar]
- 70.Magness ST, Puthoff BJ, Crissey MA, Dunn J, Henning SJ, Houchen C, Kaddis JS, Kuo CJ, Li L, Lynch J, Martin MG, May R, Niland JC, Olack B, Qian D, Stelzner M, Swain JR, Wang F, Wang J, Wang X, Yan K, Yu J, Wong MH. Am J Physiol: Gastrointest Liver Physiol. 2013;305:G542–G551. doi: 10.1152/ajpgi.00481.2012. [DOI] [PMC free article] [PubMed] [Google Scholar]
- 71.Dalerba P, Dylla SJ, Park IK, Liu R, Wang X, Cho RW, Hoey T, Gurney A, Huang EH, Simeone DM, Shelton AA, Parmiani G, Castelli C, Clarke MF. Proc Natl Acad Sci U S A. 2007;104:10158–10163. doi: 10.1073/pnas.0703478104. [DOI] [PMC free article] [PubMed] [Google Scholar]
- 72.Bendall SC, Simonds EF, Qiu P, Amirel AD, Krutzik PO, Finck R, Bruggner RV, Melamed R, Trejo A, Ornatsky OI, Balderas RS, Plevritis SK, Sachs K, Pe'er D, Tanner SD, Nolan GP. Science. 2011;332:687–696. doi: 10.1126/science.1198704. [DOI] [PMC free article] [PubMed] [Google Scholar]
- 73.Geiss GK, Bumgarner RE, Birditt B, Dahl T, Dowidar N, Dunaway DL, Fell HP, Ferree S, George RD, Grogan T, James JJ, Maysuria M, Mitton JD, Oliveri P, Osborn JL, Peng T, Ratcliffe AL, Webster PJ, Davidson EH, Hood L, Dimitrov K. Nat Biotechnol. 2008;26:317–325. doi: 10.1038/nbt1385. [DOI] [PubMed] [Google Scholar]
- 74.Ullal AV, Peterson V, Agasti SS, Tuang S, Juric D, Castro CM, Weissleder R. Sci Transl Med. 2014;6:219ra219. doi: 10.1126/scitranslmed.3007361. [DOI] [PMC free article] [PubMed] [Google Scholar]
- 75.Nelson DA, Manhardt C, Kamath V, Sui Y, Santamaria-Pang A, Can A, Bello M, Corwin A, Dinn SR, Lazare M, Gervais EM, Sequeira SJ, Peters SB, Ginty F, Gerdes MJ, Larsen M. Biol Open. 2013;2:439–447. doi: 10.1242/bio.20134309. [DOI] [PMC free article] [PubMed] [Google Scholar]
- 76.Gerdes MJ, Sevinsky CJ, Sood A, Adak S, Bello MO, Bordwell A, Can A, Corwin A, Dinn S, Filkins RJ, Hollman D, Kamath V, Kaanumalle S, Kenny K, Larsen M, Lazare M, Li Q, Lowes C, McCulloch CC, McDonough E, Montalto MC, Pang Z, Rittscher J, Santamaria-Pang A, Sarachan BD, Seel ML, Seppo A, Shaikh K, Sui Y, Zhang J, Ginty F. Proc Natl Acad Sci U S A. 2013;110:11982–11987. doi: 10.1073/pnas.1300136110. [DOI] [PMC free article] [PubMed] [Google Scholar]
- 77.Giesen C, Wang HA, Schapiro D, Zivanovic N, Jacobs A, Hattendorf B, Schuffler PJ, Grolimund D, Buhmann JM, Brandt S, Varga Z, Wild PJ, Gunther D, Bodenmiller B. Nat Methods. 2014;11:417–422. doi: 10.1038/nmeth.2869. [DOI] [PubMed] [Google Scholar]
- 78.Angelo M, Bendall SC, Finck R, Hale MB, Hitzman C, Borowsky AD, Levenson RM, Lowe JB, Liu SD, Zhao S, Natkunam Y, Nolan GP. Nat Med. 2014;20:436–442. doi: 10.1038/nm.3488. [DOI] [PMC free article] [PubMed] [Google Scholar]
- 79.Susaki EA, Tainaka K, Perrin D, Kishino F, Tawara T, Watanabe TM, Yokoyama C, Onoe H, Eguchi M, Yamaguchi S, Abe T, Kiyonari H, Shimizu Y, Miyawaki A, Yokota H, Ueda HR. Cell. 2014;157:726–739. doi: 10.1016/j.cell.2014.03.042. [DOI] [PubMed] [Google Scholar]
- 80.Chung K, Wallace J, Kim SY, Kalyanasundaram S, Andalman AS, Davidson TJ, Mirzabekov JJ, Zalocusky KA, Mattis J, Denisin AK, Pak S, Bernstein H, Ramakrishnan C, Grosenick L, Gradinaru V, Deisseroth K. Nature. 2013;497:332–337. doi: 10.1038/nature12107. [DOI] [PMC free article] [PubMed] [Google Scholar]
- 81.Itzkovitz S, Lyubimova A, Blat IC, Maynard M, van Es J, Lees J, Jacks T, Clevers H, van Oudenaarden A. Nat Cell Biol. 2012;14:106–114. doi: 10.1038/ncb2384. [DOI] [PMC free article] [PubMed] [Google Scholar]
- 82.Lee JH, Daugharthy ER, Scheiman J, Kalhor R, Yang JL, Ferrante TC, Terry R, Jeanty SS, Li C, Amamoto R, Peters DT, Turczyk BM, Marblestone AH, Inverso SA, Bernard A, Mali P, Rios X, Aach J, Church GM. Science. 2014;343:1360–1363. doi: 10.1126/science.1250212. [DOI] [PMC free article] [PubMed] [Google Scholar]
- 83.Lubeck E, Cai L. Nat Methods. 2012;9:743–748. doi: 10.1038/nmeth.2069. [DOI] [PMC free article] [PubMed] [Google Scholar]
- 84.Lubeck E, Coskun AF, Zhiyentayev T, Ahmad M, Cai L. Nat Methods. 2014;11:360–361. doi: 10.1038/nmeth.2892. [DOI] [PMC free article] [PubMed] [Google Scholar]
- 85.Kobat D, Horton NG, Xu C. J Biomed Opt. 2011;16:106014. doi: 10.1117/1.3646209. [DOI] [PubMed] [Google Scholar]
- 86.Choi JW, Kim JK, Choi M, Kim YR, Yun SH. Endoscopy. 2014;46:1110–1116. doi: 10.1055/s-0034-1377631. [DOI] [PMC free article] [PubMed] [Google Scholar]
- 87.Kim P, Chung E, Yamashita H, Hung KE, Mizoguchi A, Kucherlapati R, Fukumura D, Jain RK, Yun SH. Nat Methods. 2010;7:303–305. doi: 10.1038/nmeth.1440. [DOI] [PMC free article] [PubMed] [Google Scholar]
- 88.Albeck JG, Mills GB, Brugge JS. Mol Cell. 2013;49:249–261. doi: 10.1016/j.molcel.2012.11.002. [DOI] [PMC free article] [PubMed] [Google Scholar]
- 89.Basak O, van de Born M, Korving J, Beumer J, van der Elst S, van Es JH, Clevers H. EMBO J. 2014;33:2057–2068. doi: 10.15252/embj.201488017. [DOI] [PMC free article] [PubMed] [Google Scholar]
- 90.Sakaue-Sawano A, Miyawaki A. Cold Spring Harb Protoc. 2014;2014 doi: 10.1101/pdb.prot080408. [DOI] [PubMed] [Google Scholar]
- 91.Ritsma L, Ellenbroek SI, Zomer A, Snippert HJ, de Sauvage FJ, Simons BD, Clevers H, van Rheenen J. Nature. 2014;507:362–365. doi: 10.1038/nature12972. [DOI] [PMC free article] [PubMed] [Google Scholar]
- 92.Lopez-Garcia C, Klein AM, Simons BD, Winton DJ. Science. 2010;330:822–825. doi: 10.1126/science.1196236. [DOI] [PubMed] [Google Scholar]
- 93.Bhatt AS, Freeman SS, Herrera AF, Pedamallu CS, Gevers D, Duke F, Jung J, Michaud M, Walker BJ, Young S, Earl AM, Kostic AD, Ojesina AI, Hasserjian R, Ballen KK, Chen YB, Hobbs G, Antin JH, Soiffer RJ, Baden LR, Garrett WS, Hornick JL, Marty FM, Meyerson M. N Engl J Med. 2013;369:517–528. doi: 10.1056/NEJMoa1211115. [DOI] [PMC free article] [PubMed] [Google Scholar]
- 94.Karlsson FH, Tremaroli V, Nookaew I, Bergstrom G, Behre CJ, Fagerberg B, Nielsen J, Backhed F. Nature. 2013;498:99–103. doi: 10.1038/nature12198. [DOI] [PubMed] [Google Scholar]
- 95.Schulz MD, Atay C, Heringer J, Romrig FK, Schwitalla S, Aydin B, Ziegler PK, Varga J, Reindl W, Pommerenke C, Salinas-Riester G, Bock A, Alpert C, Blaut M, Polson SC, Brandl L, Kirchner T, Greten FR, Polson SW, Arkan MC. Nature. 2014;514:508–512. doi: 10.1038/nature13398. [DOI] [PMC free article] [PubMed] [Google Scholar]
- 96.Koren O, Goodrich JK, Cullender TC, Spor A, Laitinen K, Backhed HK, Gonzalez A, Werner JJ, Angenent LT, Knight R, Backhed F, Isolauri E, Salminen S, Ley RE. Cell. 2012;150:470–480. doi: 10.1016/j.cell.2012.07.008. [DOI] [PMC free article] [PubMed] [Google Scholar]
- 97.Pyndt Jorgensen B, Krych L, Pedersen TB, Plath N, Redrobe JP, Hansen AK, Nielsen DS, Pedersen CS, Larsen C, Sorensen DB. Physiol Behav. 2014;141C:32–39. doi: 10.1016/j.physbeh.2014.12.042. [DOI] [PubMed] [Google Scholar]
- 98.Turnbaugh PJ, Ridaura VK, Faith JJ, Rey FE, Knight R, Gordon JI. Sci Transl Med. 2009;1:6ra14. doi: 10.1126/scitranslmed.3000322. [DOI] [PMC free article] [PubMed] [Google Scholar]
- 99.Martin FP, Wang Y, Sprenger N, Yap IK, Rezzi S, Ramadan Z, Pere-Trepat E, Rochat F, Cherbut C, van Bladeren P, Fay LB, Kochhar S, Lindon JC, Holmes E, Nicholson JK. Mol Syst Biol. 2008;4:205. doi: 10.1038/msb.2008.40. [DOI] [PMC free article] [PubMed] [Google Scholar]
- 100.Chung H, Pamp SJ, Hill JA, Surana NK, Edelman SM, Troy EB, Reading NC, Villablanca EJ, Wang S, Mora JR, Umesaki Y, Mathis D, Benoist C, Relman DA, Kasper DL. Cell. 2012;149:1578–1593. doi: 10.1016/j.cell.2012.04.037. [DOI] [PMC free article] [PubMed] [Google Scholar]
- 101.Huse SM, Welch DM, Morrison HG, Sogin ML. Environ Microbiol. 2010;12:1889–1898. doi: 10.1111/j.1462-2920.2010.02193.x. [DOI] [PMC free article] [PubMed] [Google Scholar]
- 102.Preheim SP, Perrotta AR, Friedman J, Smilie C, Brito I, Smith MB, Alm E. Methods Enzymol. 2013;531:353–370. doi: 10.1016/B978-0-12-407863-5.00018-6. [DOI] [PubMed] [Google Scholar]
- 103.Forney LJ, Zhou X, Brown CJ. Curr Opin Microbiol. 2004;7:210–220. doi: 10.1016/j.mib.2004.04.015. [DOI] [PubMed] [Google Scholar]
- 104.Huttenhower C, Kostic AD, Xavier RJ. Immunity. 2014;40:843–854. doi: 10.1016/j.immuni.2014.05.013. [DOI] [PMC free article] [PubMed] [Google Scholar]
- 105.Smith PM, Howitt MR, Panikov N, Michaud M, Gallini CA, Bohlooly YM, Glickman JN, Garrett WS. Science. 2013;341:569–573. doi: 10.1126/science.1241165. [DOI] [PMC free article] [PubMed] [Google Scholar]
- 106.Suply E, de Vries P, Soret R, Cossais F, Neunlist M. Am J Physiol: Gastrointest Liver Physiol. 2012;302:G1373–G1380. doi: 10.1152/ajpgi.00338.2011. [DOI] [PubMed] [Google Scholar]
- 107.Le Chatelier E, Nielsen T, Qin J, Prifti E, Hildebrand F, Falony G, Almeida M, Arumugam M, Batto JM, Kennedy S, Leonard P, Li J, Burgdorf K, Grarup N, Jorgensen T, Brandslund I, Nielsen HB, Juncker AS, Bertalan M, Levenez F, Pons N, Rasmussen S, Sunagawa S, Tap J, Tims S, Zoetendal EG, Brunak S, Clement K, Dore J, Kleerebezem M, Kristiansen K, Renault P, Sicheritz-Ponten T, de Vos WM, Zucker JD, Raes J, Hansen T, Bork P, Wang J, Ehrlich SD, Pedersen O. Nature. 2013;500:541–546. doi: 10.1038/nature12506. [DOI] [PubMed] [Google Scholar]
- 108.Langille MG, Zaneveld J, Caporaso JG, McDonald D, Knights D, Reyes JA, Clemente JC, Burkepile DE, Vega Thurber RL, Knight R, Beiko RG, Huttenhower C. Nat Biotechnol. 2013;31:814–821. doi: 10.1038/nbt.2676. [DOI] [PMC free article] [PubMed] [Google Scholar]
- 109.Wu GD, Compher C, Chen EZ, Smith SA, Shah RD, Bittinger K, Chehoud C, Albenberg LG, Nessel L, Gilroy E, Star J, Weljie AM, Flint HJ, Metz DC, Bennett MJ, Li H, Bushman FD, Lewis JD. Gut. 2014 doi: 10.1136/gutjnl-2014-308209. [DOI] [PMC free article] [PubMed] [Google Scholar]
- 110.Peer X, An G. J Pharmacokinet Pharmacodyn. 2014;41:493–507. doi: 10.1007/s10928-014-9381-1. [DOI] [PMC free article] [PubMed] [Google Scholar]
- 111.Shankar V, Hamilton MJ, Khoruts A, Kilburn A, Unno T, Paliy O, Sadowsky MJ. Microbiome. 2014;2:13. doi: 10.1186/2049-2618-2-13. [DOI] [PMC free article] [PubMed] [Google Scholar]
- 112.van Nood E, Vrieze A, Nieuwdorp M, Fuentes S, Zoetendal EG, de Vos WM, Visser CE, Kuijper EJ, Bartelsman JF, Tijssen JG, Speelman P, Dijkgraaf MG, Keller JJ. N Engl J Med. 2013;368:407–415. doi: 10.1056/NEJMoa1205037. [DOI] [PubMed] [Google Scholar]
- 113.Gough E, Shaikh H, Manges AR. Clin Infect Dis. 2011;53:994–1002. doi: 10.1093/cid/cir632. [DOI] [PubMed] [Google Scholar]
- 114.Youngster I, Sauk J, Pindar C, Wilson RG, Kaplan JL, Smith MB, Alm EJ, Gevers D, Russell GH, Hohmann EL. Clin Infect Dis. 2014;58:1515–1522. doi: 10.1093/cid/ciu135. [DOI] [PMC free article] [PubMed] [Google Scholar]
- 115.Buffie CG, Bucci V, Stein RR, McKenney PT, Ling L, Gobourne A, No D, Liu H, Kinnebrew M, Viale A, Littmann E, van den Brink MR, Jenq RR, Taur Y, Sander C, Cross JR, Toussaint NC, Xavier JB, Pamer EG. Nature. 2015;517:205–208. doi: 10.1038/nature13828. [DOI] [PMC free article] [PubMed] [Google Scholar]
- 116.Gierut JJ, Jacks TE, Haigis KM. Cold Spring Harb Protoc. 2014;2014:339–349. doi: 10.1101/pdb.top069807. [DOI] [PMC free article] [PubMed] [Google Scholar]
- 117.Beronja S, Janki P, Heller E, Lien WH, Keyes BE, Oshimori N, Fuchs E. Nature. 2013;501:185–190. doi: 10.1038/nature12464. [DOI] [PMC free article] [PubMed] [Google Scholar]
- 118.Zhang L, Zhang T, Wang L, Shao S, Chen Z, Zhang Z. Gene Ther. 2014;21:709–714. doi: 10.1038/gt.2014.50. [DOI] [PMC free article] [PubMed] [Google Scholar]
- 119.Wang H, Yang H, Shivalila CS, Dawlaty MM, Cheng AW, Zhang F, Jaenisch R. Cell. 2013;153:910–918. doi: 10.1016/j.cell.2013.04.025. [DOI] [PMC free article] [PubMed] [Google Scholar]
- 120.Quigley D, Balmain A. Nat Rev Genet. 2009;10:651–657. doi: 10.1038/nrg2617. [DOI] [PubMed] [Google Scholar]
- 121.Peltz G, Zaas AK, Zheng M, Solis NV, Zhang MX, Liu HH, Hu Y, Boxx GM, Phan QT, Dill D, Filler SG. Infect Immun. 2011;79:4472–4479. doi: 10.1128/IAI.05666-11. [DOI] [PMC free article] [PubMed] [Google Scholar]
- 122.Welsh CE, Miller DR, Manly KF, Wang J, McMillan L, Morahan G, Mott R, Iraqi FA, Threadgill DW, de Villena FP. Mamm Genome. 2012;23:706–712. doi: 10.1007/s00335-012-9410-6. [DOI] [PMC free article] [PubMed] [Google Scholar]
- 123.Jolliffe IT. Principal component analysis. 2nd. Springer; New York: 2002. [Google Scholar]
- 124.Janes KA, Albeck JG, Gaudet S, Sorger PK, Lauffenburger DA, Yaffe MB. Science. 2005;310:1646–1653. doi: 10.1126/science.1116598. [DOI] [PubMed] [Google Scholar]
- 125.Janes KA, Gaudet S, Albeck JG, Nielsen UB, Lauffenburger DA, Sorger PK. Cell. 2006;124:1225–1239. doi: 10.1016/j.cell.2006.01.041. [DOI] [PubMed] [Google Scholar]
- 126.Amirel AD, Davis KL, Tadmor MD, Simonds EF, Levine JH, Bendall SC, Shenfeld DK, Krishnaswamy S, Nolan GP, Pe'er D. Nat Biotechnol. 2013;31:545–552. doi: 10.1038/nbt.2594. [DOI] [PMC free article] [PubMed] [Google Scholar]
- 127.Qiu P, Simonds EF, Bendall SC, Gibbs KD, Jr, Bruggner RV, Linderman MD, Sachs K, Nolan GP, Plevritis SK. Nat Biotechnol. 2011;29:886–891. doi: 10.1038/nbt.1991. [DOI] [PMC free article] [PubMed] [Google Scholar]
- 128.Sachs K, Perez O, Pe'er D, Lauffenburger DA, Nolan GP. Science. 2005;308:523–529. doi: 10.1126/science.1105809. [DOI] [PubMed] [Google Scholar]
- 129.Wagner JP, Wolf-Yadlin A, Sevecka M, Grenier JK, Root DE, Lauffenburger DA, MacBeath G. Sci Signaling. 2013;6:ra58. doi: 10.1126/scisignal.2003994. [DOI] [PMC free article] [PubMed] [Google Scholar]
- 130.Brown KS, Sethna JP. Phys Rev E: Stat, Nonlinear, Soft Matter Phys. 2003;68:021904. doi: 10.1103/PhysRevE.68.021904. [DOI] [PubMed] [Google Scholar]
- 131.Vyshemirsky V, Girolami M. Bioinformatics. 2008;24:1933–1934. doi: 10.1093/bioinformatics/btn338. [DOI] [PubMed] [Google Scholar]
- 132.Morris MK, Saez-Rodriguez J, Clarke DC, Sorger PK, Lauffenburger DA. PLoS Comput Biol. 2011;7:e1001099. doi: 10.1371/journal.pcbi.1001099. [DOI] [PMC free article] [PubMed] [Google Scholar]
- 133.Terfve C, Cokelaer T, Henriques D, MacNamara A, Goncalves E, Morris MK, van Iersel M, Lauffenburger DA, Saez-Rodriguez J. BMC Syst Biol. 2012;6:133. doi: 10.1186/1752-0509-6-133. [DOI] [PMC free article] [PubMed] [Google Scholar]
- 134.Schneider A, Hommel G, Blettner M. Dtsch Arztebl Int. 2010;107:776–782. doi: 10.3238/arztebl.2010.0776. [DOI] [PMC free article] [PubMed] [Google Scholar]
- 135.Ding EL, Song Y, Malik VS, Liu S. JAMA, J Am Med Assoc. 2006;295:1288–1299. doi: 10.1001/jama.295.11.1288. [DOI] [PubMed] [Google Scholar]
- 136.Cooke B, Hegstrom CD, Villeneuve LS, Breedlove SM. Front Neuroendocrinol. 1998;19:323–362. doi: 10.1006/frne.1998.0171. [DOI] [PubMed] [Google Scholar]
- 137.Monteggia LM, Luikart B, Barrot M, Theobold D, Malkovska I, Nef S, Parada LF, Nestler EJ. Biol Psychiatry. 2007;61:187–197. doi: 10.1016/j.biopsych.2006.03.021. [DOI] [PubMed] [Google Scholar]
- 138.Montague CT, Prins JB, Sanders L, Digby JE, O'Rahilly S. Diabetes. 1997;46:342–347. doi: 10.2337/diab.46.3.342. [DOI] [PubMed] [Google Scholar]
- 139.Huh WJ, Khurana SS, Geahlen JH, Kohli K, Waller RA, Mills JC. Gastroenterology. 2012;142(21–24):e27. doi: 10.1053/j.gastro.2011.09.050. [DOI] [PMC free article] [PubMed] [Google Scholar]
- 140.Chambers SM, Shaw CA, Gatza C, Fisk CJ, Donehower LA, Goodell MA. PLoS Biol. 2007;5:e201. doi: 10.1371/journal.pbio.0050201. [DOI] [PMC free article] [PubMed] [Google Scholar]
- 141.Sipos F, Leiszter K, Tulassay Z. World J Gastroenterol. 2011;17:2981–2986. doi: 10.3748/wjg.v17.i25.2981. [DOI] [PMC free article] [PubMed] [Google Scholar]
- 142.Drozdowski L, Thomson AB. World J Gastroenterol. 2006;12:7578–7584. doi: 10.3748/wjg.v12.i47.7578. [DOI] [PMC free article] [PubMed] [Google Scholar]
- 143.Shanley DP, Aw D, Manley NR, Palmer DB. Trends Immunol. 2009;30:374–381. doi: 10.1016/j.it.2009.05.001. [DOI] [PubMed] [Google Scholar]
- 144.Franceschi C, Capri M, Monti D, Giunta S, Olivieri F, Sevini F, Panourgia MP, Invidia L, Celani L, Scurti M, Cevenini E, Castellani GC, Salvioli S. Mech Ageing Dev. 2007;128:92–105. doi: 10.1016/j.mad.2006.11.016. [DOI] [PubMed] [Google Scholar]
- 145.Hollister EB, Gao C, Versalovic J. Gastroenterology. 2014;146:1449–1458. doi: 10.1053/j.gastro.2014.01.052. [DOI] [PMC free article] [PubMed] [Google Scholar]
- 146.Yatsunenko T, Rey FE, Manary MJ, Trehan I, Dominguez-Bello MG, Contreras M, Magris M, Hidalgo G, Baldassano RN, Anokhin AP, Heath AC, Warner B, Reeder J, Kuczynski J, Caporaso JG, Lozupone CA, Lauber C, Clemente JC, Knights D, Knight R, Gordon JI. Nature. 2012;486:222–227. doi: 10.1038/nature11053. [DOI] [PMC free article] [PubMed] [Google Scholar]
- 147.Mahler M, Bristol IJ, Leiter EH, Workman AE, Birkenmeier EH, Elson CO, Sundberg JP. Am J Physiol. 1998;274:G544–G551. doi: 10.1152/ajpgi.1998.274.3.G544. [DOI] [PubMed] [Google Scholar]
- 148.Suzuki R, Kohno H, Sugie S, Nakagama H, Tanaka T. Carcinogenesis. 2006;27:162–169. doi: 10.1093/carcin/bgi205. [DOI] [PubMed] [Google Scholar]
- 149.Ivanov II, Frutos Rde L, Manel N, Yoshinaga K, Rifkin DB, Sartor RB, Finlay BB, Littman DR. Cell Host Microbe. 2008;4:337–349. doi: 10.1016/j.chom.2008.09.009. [DOI] [PMC free article] [PubMed] [Google Scholar]
- 150.Palmer C, Bik EM, DiGiulio DB, Relman DA, Brown PO. PLoS Biol. 2007;5:e177. doi: 10.1371/journal.pbio.0050177. [DOI] [PMC free article] [PubMed] [Google Scholar]
- 151.Carmody RN, Gerber GK, Luevano JM, Jr, Gatti DM, Somes L, Svenson KL, Turnbaugh PJ. Cell Host Microbe. 2015;17:72–84. doi: 10.1016/j.chom.2014.11.010. [DOI] [PMC free article] [PubMed] [Google Scholar]
- 152.Hildebrand F, Nguyen TL, Brinkman B, Yunta RG, Cauwe B, Vandenabeele P, Liston A, Raes J. Genome Biol. 2013;14:R4. doi: 10.1186/gb-2013-14-1-r4. [DOI] [PMC free article] [PubMed] [Google Scholar]
- 153.Patton DF, Mistlberger RE. Front Neurosci. 2013;7:185. doi: 10.3389/fnins.2013.00185. [DOI] [PMC free article] [PubMed] [Google Scholar]
- 154.Curtis AM, Bellet MM, Sassone-Corsi P, O'Neill LA. Immunity. 2014;40:178–186. doi: 10.1016/j.immuni.2014.02.002. [DOI] [PubMed] [Google Scholar]
- 155.Nguyen KD, Fentress SJ, Qiu Y, Yun K, Cox JS, Chawla A. Science. 2013;341:1483–1488. doi: 10.1126/science.1240636. [DOI] [PMC free article] [PubMed] [Google Scholar]
- 156.Mukherji A, Kobiita A, Ye T, Chambon P. Cell. 2013;153:812–827. doi: 10.1016/j.cell.2013.04.020. [DOI] [PubMed] [Google Scholar]
- 157.Chapman PB, Hauschild A, Robert C, Haanen JB, Ascierto P, Larkin J, Dummer R, Garbe C, Testori A, Maio M, Hogg D, Lorigan P, Lebbe C, Jouary T, Schadendorf D, Ribas A, O'Day SJ, Sosman JA, Kirkwood JM, Eggermont AM, Dreno B, Nolop K, Li J, Nelson B, Hou J, Lee RJ, Flaherty KT, McArthur GA. N Engl J Med. 2011;364:2507–2516. doi: 10.1056/NEJMoa1103782. [DOI] [PMC free article] [PubMed] [Google Scholar]
- 158.Elliott MJ, Maini RN, Feldmann M, Kalden JR, Antoni C, Smolen JS, Leeb B, Breedveld FC, Macfarlane JD, Bijl H, et al. Lancet. 1994;344:1105–1110. doi: 10.1016/s0140-6736(94)90628-9. [DOI] [PubMed] [Google Scholar]
- 159.Moore RD, Chaisson RE. AIDS. 1999;13:1933–1942. doi: 10.1097/00002030-199910010-00017. [DOI] [PubMed] [Google Scholar]
- 160.Altwegg R, Vincent T. Mediators Inflammation. 2014;2014:172821. doi: 10.1155/2014/172821. [DOI] [PMC free article] [PubMed] [Google Scholar]
- 161.Wang S, Huang J, Lyu H, Cai B, Yang X, Li F, Tan J, Edgerton SM, Thor AD, Lee CK, Liu B. Breast Cancer Res. 2013;15:R101. doi: 10.1186/bcr3563. [DOI] [PMC free article] [PubMed] [Google Scholar]
- 162.Neuert G, Munsky B, Tan RZ, Teytelman L, Khammash M, van Oudenaarden A. Science. 2013;339:584–587. doi: 10.1126/science.1231456. [DOI] [PMC free article] [PubMed] [Google Scholar]
- 163.Hautaniemi S, Kharait S, Iwabu A, Wells A, Lauffenburger DA. Bioinformatics. 2005;21:2027–2035. doi: 10.1093/bioinformatics/bti278. [DOI] [PubMed] [Google Scholar]
- 164.Lau KS, Schrier SB, Gierut J, Lyons J, Lauffenburger DA, Haigis KM. Integr Biol. 2013;5:1355–1365. doi: 10.1039/c3ib40062j. [DOI] [PMC free article] [PubMed] [Google Scholar]
- 165.Okayasu I, Hatakeyama S, Yamada M, Ohkusa T, Inagaki Y, Nakaya R. Gastroenterology. 1990;98:694–702. doi: 10.1016/0016-5085(90)90290-h. [DOI] [PubMed] [Google Scholar]
- 166.Neurath MF, Fuss I, Kelsall BL, Stuber E, Strober W. J Exp Med. 1995;182:1281–1290. doi: 10.1084/jem.182.5.1281. [DOI] [PMC free article] [PubMed] [Google Scholar]
- 167.Ostanin DV, Bao J, Koboziev I, Gray L, Robinson-Jackson SA, Kosloski-Davidson M, Price VH, Grisham MB. Am J Physiol: Gastrointest Liver Physiol. 2009;296:G135–G146. doi: 10.1152/ajpgi.90462.2008. [DOI] [PMC free article] [PubMed] [Google Scholar]
- 168.Kuhn R, Lohler J, Rennick D, Rajewsky K, Muller W. Cell. 1993;75:263–274. doi: 10.1016/0092-8674(93)80068-p. [DOI] [PubMed] [Google Scholar]
- 169.Kontoyiannis D, Boulougouris G, Manoloukos M, Armaka M, Apostolaki M, Pizarro T, Kotlyarov A, Forster I, Flavell R, Gaestel M, Tsichlis P, Cominelli F, Kollias G. J Exp Med. 2002;196:1563–1574. doi: 10.1084/jem.20020281. [DOI] [PMC free article] [PubMed] [Google Scholar]
- 170.Tanaka T, Kohno H, Suzuki R, Yamada Y, Sugie S, Mori H. Cancer Sci. 2003;94:965–973. doi: 10.1111/j.1349-7006.2003.tb01386.x. [DOI] [PMC free article] [PubMed] [Google Scholar]
- 171.Powell AE, Vlacich G, Zhao ZY, McKinley ET, Washington MK, Manning HC, Coffey RJ. Am J Physiol: Gastrointest Liver Physiol. 2014;307:G16–G23. doi: 10.1152/ajpgi.00358.2013. [DOI] [PMC free article] [PubMed] [Google Scholar]
- 172.Su LK, Kinzler KW, Vogelstein B, Preisinger AC, Moser AR, Luongo C, Gould KA, Dove WF. Science. 1992;256:668–670. doi: 10.1126/science.1350108. [DOI] [PubMed] [Google Scholar]
- 173.Haigis KM, Kendall KR, Wang Y, Cheung A, Haigis MC, Glickman JN, Niwa-Kawakita M, Sweet-Cordero A, Sebolt-Leopold J, Shannon KM, Settleman J, Giovannini M, Jacks T. Nat Genet. 2008;40:600–608. doi: 10.1038/ngXXXX. [DOI] [PMC free article] [PubMed] [Google Scholar]
- 174.Hung KE, Maricevich MA, Richard LG, Chen WY, Richardson MP, Kunin A, Bronson RT, Mahmood U, Kucherlapati R. Proc Natl Acad Sci U S A. 2010;107:1565–1570. doi: 10.1073/pnas.0908682107. [DOI] [PMC free article] [PubMed] [Google Scholar]
- 175.Borenshtein D, McBee ME, Schauer DB. Curr Opin Gastroenterol. 2008;24:32–37. doi: 10.1097/MOG.0b013e3282f2b0fb. [DOI] [PubMed] [Google Scholar]
- 176.Que JU, Hentges DJ. Infect Immun. 1985;48:169–174. doi: 10.1128/iai.48.1.169-174.1985. [DOI] [PMC free article] [PubMed] [Google Scholar]
- 177.Qin J, Li Y, Cai Z, Li S, Zhu J, Zhang F, Liang S, Zhang W, Guan Y, Shen D, Peng Y, Zhang D, Jie Z, Wu W, Qin Y, Xue W, Li J, Han L, Lu D, Wu P, Dai Y, Sun X, Li Z, Tang A, Zhong S, Li X, Chen W, Xu R, Wang M, Feng Q, Gong M, Yu J, Zhang Y, Zhang M, Hansen T, Sanchez G, Raes J, Falony G, Okuda S, Almeida M, LeChatelier E, Renault P, Pons N, Batto JM, Zhang Z, Chen H, Yang R, Zheng W, Yang H, Wang J, Ehrlich SD, Nielsen R, Pedersen O, Kristiansen K. Nature. 2012;490:55–60. doi: 10.1038/nature11450. [DOI] [PubMed] [Google Scholar]
- 178.Wilkins CL, Lay JO. Identification of microorganisms by mass spectrometry. John Wiley; Hoboken, NJ: 2006. [Google Scholar]
- 179.Fukuda S, Toh H, Hase K, Oshima K, Nakanishi Y, Yoshimura K, Tobe T, Clarke JM, Topping DL, Suzuki T, Taylor TD, Itoh K, Kikuchi J, Morita H, Hattori M, Ohno H. Nature. 2011;469:543–547. doi: 10.1038/nature09646. [DOI] [PubMed] [Google Scholar]
- 180.Franklin J. Personal communication [Google Scholar]
- 181.Jorgensen C, Sherman A, Chen GI, Pasculescu A, Poliakov A, Hsiung M, Larsen B, Wilkinson DG, Linding R, Pawson T. Science. 2009;326:1502–1509. doi: 10.1126/science.1176615. [DOI] [PubMed] [Google Scholar]
- 182.Akbani R, Becker KF, Carragher N, Goldstein T, de Koning L, Korf U, Liotta L, Mills GB, Nishizuka SS, Pawlak M, Petricoin EF, 3rd, Pollard HB, Serrels B, Zhu J. Mol Cell Proteomics. 2014;13:1625–1643. doi: 10.1074/mcp.O113.034918. [DOI] [PMC free article] [PubMed] [Google Scholar]
- 183.Shalek AK, Satija R, Adiconis X, Gertner RS, Gaublomme JT, Raychowdhury R, Schwartz S, Yosef N, Malboeuf C, Lu D, Trombetta JJ, Gennert D, Gnirke A, Goren A, Hacohen N, Levin JZ, Park H, Regev A. Nature. 2013;498:236–240. doi: 10.1038/nature12172. [DOI] [PMC free article] [PubMed] [Google Scholar]
- 184.Buczacki SJ, Zecchini HI, Nicholson AM, Russell R, Vermeulen L, Kemp R, Winton DJ. Nature. 2013;495:65–69. doi: 10.1038/nature11965. [DOI] [PubMed] [Google Scholar]
- 185.Becher B, Schlitzer A, Chen J, Mair F, Sumatoh HR, Teng KW, Low D, Ruedl C, Riccardi-Castagnoli P, Poidinger M, Greter M, Ginhoux F, Newell EW. Nat Immunol. 2014;15:1181–1189. doi: 10.1038/ni.3006. [DOI] [PubMed] [Google Scholar]
- 186.O'Donnell EA, Ernst DN, Hingorani R. Immune Netw. 2013;13:43–54. doi: 10.4110/in.2013.13.2.43. [DOI] [PMC free article] [PubMed] [Google Scholar]
- 187.Pittet MJ, Weissleder R. Cell. 2011;147:983–991. doi: 10.1016/j.cell.2011.11.004. [DOI] [PMC free article] [PubMed] [Google Scholar]