Abstract
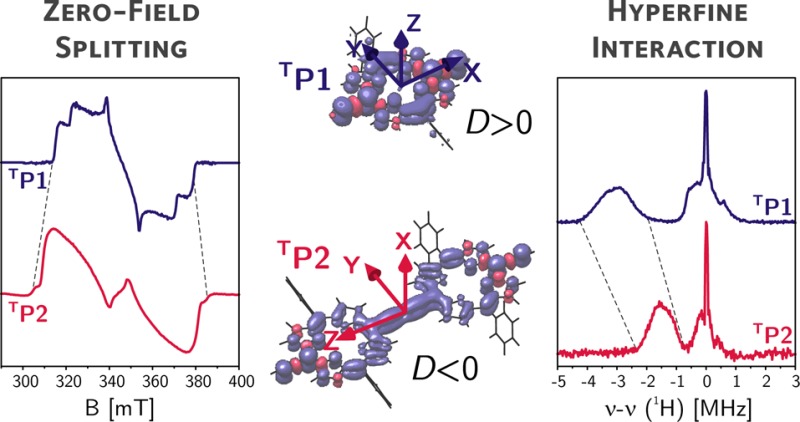
The delocalization of the photoexcited triplet state in a linear butadiyne-linked porphyrin dimer is investigated by time-resolved and pulse electron paramagnetic resonance (EPR) with laser excitation. The transient EPR spectra of the photoexcited triplet states of the porphyrin monomer and dimer are characterized by significantly different spin polarizations and an increase of the zero-field splitting parameter D from monomer to dimer. The proton and nitrogen hyperfine couplings, determined using electron nuclear double resonance (ENDOR) and X- and Q-band HYSCORE, are reduced to about half in the porphyrin dimer. These data unequivocally prove the delocalization of the triplet state over both porphyrin units, in contrast to the conclusions from previous studies on the triplet states of closely related porphyrin dimers. The results presented here demonstrate that the most accurate estimate of the extent of triplet state delocalization can be obtained from the hyperfine couplings, while interpretation of the zero-field splitting parameter D can lead to underestimation of the delocalization length, unless combined with quantum chemical calculations. Furthermore, orientation-selective ENDOR and HYSCORE results, in combination with the results of density functional theory (DFT) calculations, allowed determination of the orientations of the zero-field splitting tensors with respect to the molecular frame in both porphyrin monomer and dimer. The results provide evidence for a reorientation of the zero-field splitting tensor and a change in the sign of the zero-field splitting D value. The direction of maximum dipolar coupling shifts from the out-of-plane direction in the porphyrin monomer to the vector connecting the two porphyrin units in the dimer. This reorientation, leading to an alignment of the principal optical transition moment and the axis of maximum dipolar coupling, is also confirmed by magnetophotoselection experiments.
Introduction
Organic π-conjugated materials inspired by natural photosynthetic antenna complexes and reaction centers are being designed and investigated for applications as molecular wires,1,2 in artificial energy conversion devices3−6 and as nonlinear optical materials.7,8 Porphyrins, which are closely related to the chlorophyll and bacteriochlorophyll molecules found in plants and photosynthetic bacteria, have often been used as building blocks for these materials and have been designed with a wide range of different linkers and linking geometries.9−16 Electronic π-conjugation, the fundamental phenomenon required for most applications, has been investigated in porphyrin chain systems using many different techniques, including electron paramagnetic resonance (EPR).13,14,17−26
Triplet state delocalization and energy transfer have been extensively investigated by EPR in the photosynthetic reaction centers and their model systems27−37 as well as in linear arrays of π-conjugated organic molecules designed as molecular wires.18,22,23,25,38−40 Information on the extent of triplet state delocalization can be obtained from the zero-field splitting (ZFS) interaction or from the hyperfine interaction. The ZFS interaction is often approximated using a point-dipole model and can therefore be used to provide an estimate of the average interelectron distance. The hyperfine interactions provide information on delocalization, as the hyperfine couplings of the larger systems compared to the monomeric unit should be scaled by a factor corresponding to the number of units over which the triplet state is delocalized. The zero-field splitting interaction parameters can be obtained from the EPR spectrum, whereas the hyperfine couplings can most conveniently be measured using pulse EPR techniques such as ENDOR (electron nuclear double resonance) and ESEEM (electron spin echo envelope modulation).
ENDOR investigations have demonstrated triplet state delocalization over the special pair in the bacterial reaction center of Rhodobacter sphaeroides on the basis of a comparison of the ENDOR spectrum recorded on bacteriochlorophyll ain vitro with the spectrum recorded on the photosynthetic reaction center.35 A decrease of the proton hyperfine couplings in the special pair of bacteriochlorophyll molecules to about half that in the bacteriochlorophyll monomer was observed.35 Analogous investigations on plant reaction centers have shown no change in hyperfine couplings, and it has been concluded that in these cases the triplet state is localized on a single chlorophyll unit of the special pair.37 These results led to the conclusion that triplet state delocalization is very sensitive to the relative position, in terms of both distance and relative orientation, of the single units, as has also been shown by further investigations on model systems consisting mainly of face-to-face dimers of porphyrin-type molecules.33,36
In previous studies on triplet state delocalization in linear π-conjugated porphyrins proposed for applications as molecular wires, the changes in zero-field splitting as a function of oligomer chain length were interpreted in terms of the point-dipole approximation and yielded average interelectron distances that did not exceed the dimensions of a single monomeric porphyrin unit.18,22,23,25 This led to the conclusion that the triplet state is localized on a single unit in most of these systems in contrast to the corresponding radical cations, which have typically shown more extensive delocalization.26 Changes in the zero-field splitting parameters D and E in porphyrin dimers with different linkers have prompted the proposal of an oblate-to-prolate spin transition, with a reorientation of the ZFS tensor, from monomers to polymer chains.25,38 The limitations of the point-dipole approximation for the determination of interelectron distances were discussed in a recent paper by Riplinger et al.,41 where it was concluded that in systems with extensive delocalization of the two unpaired electrons, the use of this model can lead to underestimation of the interelectron distance.
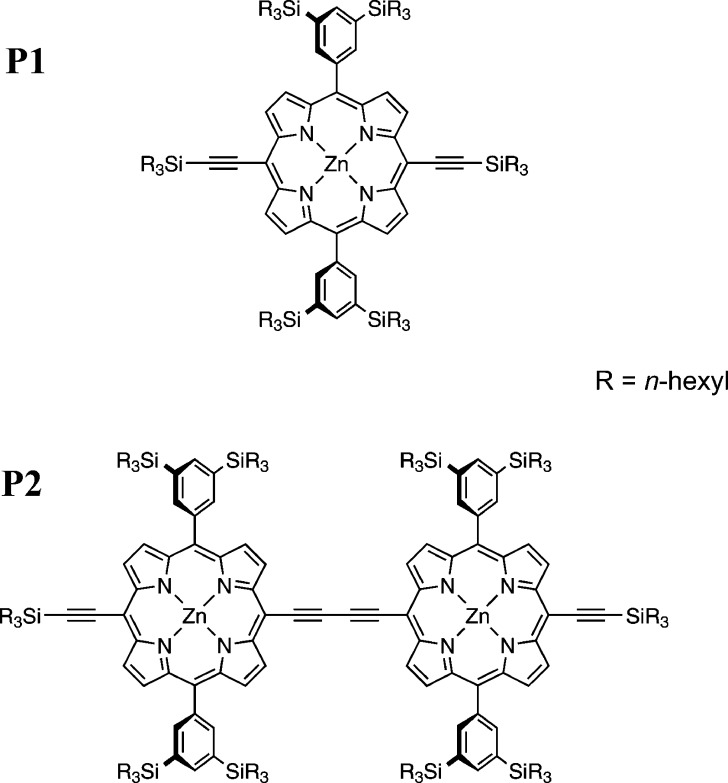
In this paper, we focus on the characterization of the triplet state delocalization in a butadiyne-linked porphyrin dimer, P2, (see Figure 1) using information from the zero-field splitting as well as both proton and nitrogen hyperfine interactions. A thorough understanding of the delocalization of the triplet state in the porphyrin dimer provides the basis for understanding delocalization in larger systems, which are currently being investigated.
Figure 1.
Molecular structures of the porphyrin monomer (P1) and dimer (P2).
Results
Transient EPR
The transient EPR spectra of the porphyrin monomer (P1) and dimer (P2) (see Figure 1 for the molecular structures), recorded as an average up to 2 μs after the excitation with unpolarized light at 532 nm, are shown in Figure 2. The spectra were recorded on frozen solutions in 10:1 MeTHF:pyridine at 20 K, where the triplet state has a lifetime of the order of milliseconds. The spin polarization of the EPR spectra does not change significantly as a function of time.
Figure 2.
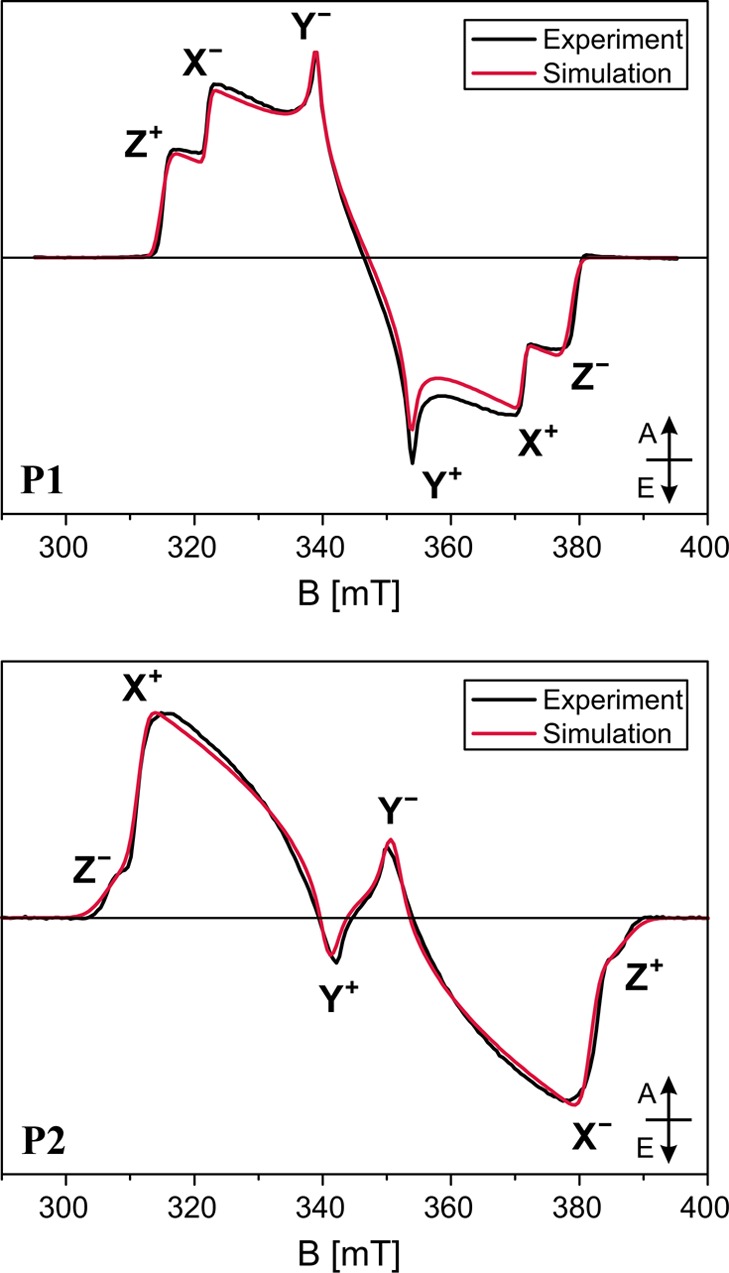
Experimental transient EPR spectra of the porphyrin monomer (top) and dimer (bottom) as average up to 2 μs after the laser pulse with unpolarized light at 532 nm. The spectra were recorded at 20 K on 0.1–0.2 mM solutions of P1 and P2 in 10:1 MeTHF:pyridine. Simulations performed in EasySpin42 with the parameters reported in Table 1 are compared to the experimental data. The energy ordering of the triplet sublevels was chosen as |Z| > |X| > |Y| and the canonical field positions are indicated (A = absorption, E = emission).
The line shapes of the EPR spectra of organic triplet states are dominated by the zero-field splitting interaction (ZFS), consisting of a spin–spin interaction between the magnetic dipoles, and in some cases also a spin–orbit interaction. The spin Hamiltonian in the presence of an external magnetic field can be written as
 |
1 |
where the first term is the electron Zeeman interaction and the second term is the zero-field splitting interaction, which, in the frame of the ZFS tensor, can be rewritten in terms of the two ZFS parameters D and E. The spin–spin contributions to D and E are defined as
 |
2 |
The angular brackets indicate integration over the triplet state wave function. The magnitudes of D and E can be determined from the distances between the turning points in the EPR spectrum, corresponding to the canonical orientations of the zero-field splitting tensor and denoted as X, Y, and Z in Figure 2; the + and – subscripts refer to the mS = 0 → mS = +1 and mS = −1 → mS = 0 transitions, respectively. The sign of D cannot be determined from the EPR spectrum; it is usually positive for oblate spin distributions and negative for prolate spin distributions.
The zero-field splitting parameters and the relative sublevel populations, giving rise to the strongly spin polarized spectral shapes, were obtained by simulation, and the results are summarized in Table 1.
Table 1. Zero-Field Splitting Parameters and Relative Zero-Field Sublevel Populations Used for the Simulations Shown in Figure 2.
| |D| [MHz] | |E | [MHz] | pX:pY:pZa | |
|---|---|---|---|
| P1 | 898 ± 5 | 161 ± 2 | 0.05:0.00:0.95 |
| P2 | 1125 ± 8 | 285 ± 2 | 0.94:0.00:0.06 |
The smallest relative sublevel population was set to zero.
The ZFS parameters determined for P1 are in agreement with the results of previous studies on similar molecules.18,43 The D value for porphyrin-like molecules is typically positive, and the Z axis of the ZFS tensor corresponds to the out-of-plane orientation.44 This has been confirmed in our case by magnetophotoselection experiments (see next section). The spin polarization with the highest population probability for the out-of-plane (Z) triplet sublevel is characteristic for zinc porphyrins and chlorophylls and has been attributed to spin–orbit coupling of the Zn ion.45−47
A comparison of the spectra and simulation parameters for P1 and P2 shows a significant increase in the magnitudes of D and E and a change of the predominantly populated triplet state sublevel from Z to X, as will be discussed in more detail later.
Magnetophotoselection Experiments
Magnetophotoselection experiments were performed by excitation with light polarized parallel or perpendicular to the magnetic field. This leads to an enhancement or an attenuation of the EPR lines corresponding to specific orientations of the molecules in the external field, which can be used to assign the relative orientation of the ZFS tensor axes with respect to the optical transition moment, if one of the two is known.48,49
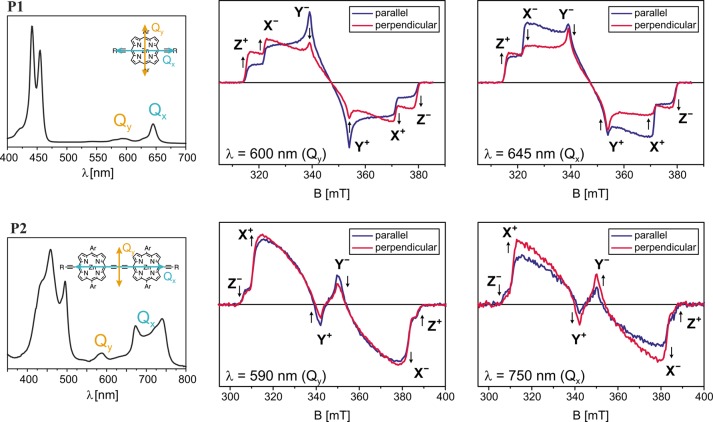
The visible absorption spectrum of P1 is characteristic for porphyrins, with Soret or B-bands around 450 nm and two so-called Q-bands at about 600 and 645 nm.50 There are two perpendicular optical transition moments, Qx and Qy, polarized in the molecular plane, which correspond to the two longest wavelength absorption bands. The EPR results discussed later demonstrate that the lowest energy of these two Q-bands is polarized along the axis of the alkyne units (Qx), which contrasts with the assignment previously deduced by comparison with other related porphyrins lacking the meso-aryl substituents.50−52 The EPR spectra recorded after excitation of P1 with polarized light at 600 nm (Qy) and 645 nm (Qx) are shown in Figure 3. The spectra recorded with light polarized parallel to the magnetic field show enhanced Y triplet transitions at 600 nm and enhanced X triplet transitions at 645 nm. The polarization ratios were calculated as48,49
| 3 |
where Ii∥/⊥ are the intensities of the derivative EPR signal for excitation with light polarized parallel or perpendicular to the magnetic field at the field positions corresponding to the X, Y, or Z orientation of the ZFS tensor. The results are summarized in Table 2. If the optical transition moment is approximately collinear (0–35°) with one of the ZFS tensor axes, the corresponding polarization ratio is expected to be positive, while the polarization ratios for the other two principal orientations are negative.48,49 It thus follows that for P1 the triplet X axis is approximately collinear with the optical transition moment Qx and the triplet axis Y with Qy. No optical transition moment is associated with the triplet Z axis, confirming the assignment of this axis to the out-of-plane direction and the assumption of a positive D value for P1.
Figure 3.
Experimental room temperature UV–vis spectra of P1 and P2 in MeTHF:pyridine 10:1 (left) and transient EPR spectra recorded at 20 K at different wavelengths for light polarized parallel or perpendicular to the magnetic field (averaged from 0 to 2 μs after the laser pulse). The experimental transient EPR spectra are normalized by laser power. The arrows indicate polarization enhancement or reduction on going from parallel to perpendicular excitation at the canonical field positions (labeled in the spectra).
Table 2. Polarization Ratios Pi for the Triplet Transitions X, Y, and Z of P1 and P2 at Different Excitation Wavelengths.
| λ | PX | PY | PZ | |
|---|---|---|---|---|
| P1 | 600 nm | –0.06 ± 0.05 | 0.43 ± 0.06 | –0.36 ± 0.02 |
| 645 nm | 0.38 ± 0.05 | –0.41 ± 0.06 | –0.30 ± 0.03 | |
| P2 | 590 nm | –0.03 ± 0.03 | 0.19 ± 0.03 | 0.08 ± 0.03 |
| 750 nm | –0.30 ± 0.06 | –0.40 ± 0.06 | 0.20 ± 0.18 |
The absorption bands in the visible spectrum of P2 are red-shifted with respect to P1, and the Q-band region consists of a superposition of bands corresponding to different conformations of the porphyrin dimer.53 The optical transition moment for absorption in the Q-band region is now aligned with the long axis of the molecule.50,53 The EPR spectra show enhancement of the Z transitions after excitation with light polarized parallel to the magnetic field in the whole region from about 600 to 760 nm, and the polarization ratios confirm that the triplet Z axis is approximately collinear with the optical transition moment, corresponding to the direction of the vector connecting the two porphyrin units. The observation of increased intensity of the Y transitions after excitation with light at 590 nm polarized parallel to the magnetic field identifies the Y axis as the second in-plane axis of the ZFS tensor with an orientation in the molecular frame analogous to that of the Y axis in the porphyrin monomer.
The results of the magnetophotoselection experiments suggest a reorientation of the ZFS tensor from P1 to P2 with a shift of the Z axis, the axis of maximum dipolar coupling, from the out-of-plane axis in P1 to the long axis in P2.
1H ENDOR
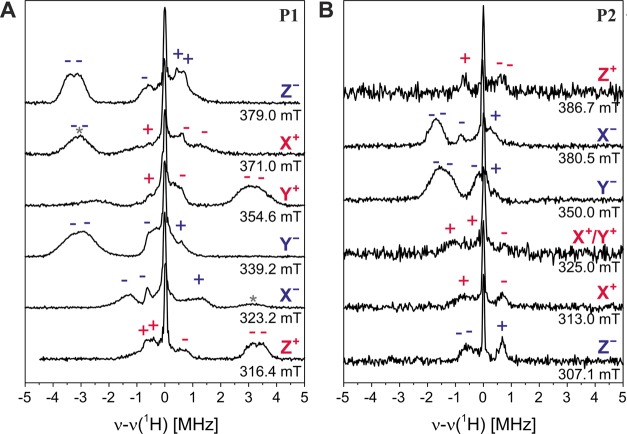
The 1H Mims ENDOR spectra recorded for P1 and P2 at the six canonical field positions are shown in Figure 4A and B.
Figure 4.
Experimental Mims ENDOR spectra of the porphyrin monomer (P1, A) and dimer (P2, B) recorded at the canonical field positions at 20 K. The signs of the hyperfine coupling constants of the mS = 0 → mS = +1 (red) and the mS = −1 → mS = 0 (blue) transitions are shown above the corresponding ENDOR peaks. The asterisks denote ENDOR peaks arising from residual contributions of other orientations (e.g., Z– contribution to X+).
Triplet state ENDOR is characterized by strong orientation selection, and the components of the hyperfine couplings along the ZFS tensor axes can often be determined from ENDOR spectra recorded at the corresponding field positions. Transition selection, that is, selective excitation of the mS = −1 → mS = 0 and the mS = 0 → mS = +1 transitions for each of the orientations, leads to asymmetric ENDOR spectra and provides the further advantage of being able to determine the sign of the hyperfine couplings relative to the sign of the D value.31,54
1H ENDOR of P1
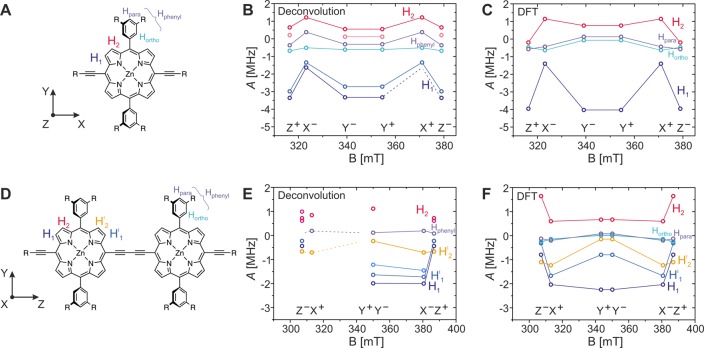
Because the D value for P1 is known to be positive from magnetophotoselection, the signs of the proton hyperfine couplings can be assigned as indicated above the corresponding peaks in Figure 4A. The values of the hyperfine couplings along the different axes of the ZFS tensor were determined through Gaussian deconvolution, and the results are shown in the frequency-field plot in Figure 5B.
Figure 5.
Comparison of frequency-field plots determined by Gaussian deconvolution of the Mims ENDOR spectra shown in Figure 4 with those predicted by B3LYP/EPRII calculations for P1 (A–C) and for P2 (D–F). The hyperfine couplings determined from the positions of the peaks in the ENDOR spectra are plotted as circles in B and E for P1 and P2, respectively. The hyperfine couplings were tentatively assigned to different protons in the molecule (numbered and color coded as indicated in A and D) on the basis of the comparison with predictions from DFT calculations (shown in C and F for P1 and P2, respectively). The orientation of the ZFS tensor with respect to the molecular structure of P1 and P2 is shown next to the molecular structure in A and D, respectively. The solid lines connect hyperfine couplings assigned to the same type of proton. In some cases, not all of the hyperfine peaks expected on the basis of symmetry could be clearly determined by deconvolution of the experimental data, and the known hyperfine couplings are connected to the positions of the expected hyperfine couplings by dashed lines. No definite assignment of the ortho and para protons on the phenyl rings was possible on the basis of the experimental data, and the corresponding experimental hyperfine couplings are simply denoted as Hphenyl.
A comparison with the results of a density functional theory (DFT) calculation at B3LYP/EPRII level on the excited triplet state of P1 allowed assignment of the hyperfine couplings to specific protons and determination of the orientation of the ZFS tensor in the molecular frame. DFT calculations predict a large negative hyperfine coupling in the out-of-plane direction and in the in-plane direction aligned with the phenyl substituents and a smaller coupling in the direction perpendicular to it for the β proton close to the alkyne bonds (H1 in Figure 5A). This is in agreement with a negative hyperfine coupling of about 3 MHz observed experimentally at the field positions corresponding to the Y and Z orientations, while only smaller couplings are observed for the X orientation. Further comparison of the experimental and calculated results allows assignment of the positive hyperfine couplings to the second type of β proton of the porphyrin ring (H2 in Figure 5A). The small hyperfine couplings close to the strong Larmor peak are not sufficiently well resolved for an assignment to the different types of phenyl protons. In general, the trends in the changes of proton hyperfine couplings predicted by DFT are in excellent agreement with those determined experimentally, as can be seen in the frequency-field plots of Figure 5B and C. A comparison confirms the assignment of the Z axis as the out-of-plane axis and allows assignment of the Y axis as the in-plane axis directed along the phenyl rings (see Figure 5A) and of the X axis as the second in-plane axis, directed along the alkyne bonds.
While DFT predicts a single hyperfine coupling for each of the two types of protons on the porphyrin ring (H1 and H2, respectively), experimentally the peaks are found to be split into two, as can be seen most clearly for H1 in the ENDOR spectra corresponding to the Z transitions. A similar behavior has been observed previously in free-base porphyrin, where it has been attributed to specific solvent–solute interactions which render these protons inequivalent.55
1H ENDOR of P2
Analogous ENDOR measurements were performed for P2 and are shown in Figure 4B. Comparison of the two sets of ENDOR spectra leads to the following observations:
-
•
The largest hyperfine coupling for P2 is reduced by a factor of 2 with respect to P1 (from about 3 MHz in P1 to about 1.5 MHz in P2).
-
•
The peaks corresponding to the largest hyperfine coupling are observed for the X and Y transitions in P2, while they correspond to the Z and Y transitions in P1.
-
•
The peaks observed at comparable field positions (e.g., the high field Y transition) are on opposite sides of the Larmor frequency.
The reduction of the hyperfine couplings by a factor of about 2 from P1 to P2 reveals that the triplet state is delocalized over both porphyrin units in P2. This finding is in contrast to previously published results on related porphyrin systems which were interpreted using the point-dipole approximation in the analysis of the continuous wave EPR data alone. Furthermore, upon comparative inspection of Figure 4A and B, a shift of the peaks corresponding to the largest proton couplings from Z and Y to X and Y is observed. This finding is in agreement with a reorientation of the ZFS tensor in P2, as already predicted on the basis of the results of the magnetophotoselection experiments. The ENDOR data allow the assignment of the X triplet axis as the new out-of-plane axis, while Z becomes the axis aligned with the central butadiyne link in P2 (see Figure 5D).
The change in the position of the ENDOR peaks with respect to the Larmor frequency demonstrates that the reorientation of the ZFS tensor occurs with a change of the sign of the D value, which must thus be negative for P2.
Comparison of the hyperfine couplings along the ZFS axes determined by Gaussian deconvolution of the experimental spectra (Figure 5E) with the results of DFT calculations (Figure 5F) again shows a good agreement in the relative changes of hyperfine couplings as a function of field. The widths of the ENDOR peaks suggest the presence of multiple similar hyperfine couplings, which points to a reduction of symmetry for the molecules in solution.
14N HYSCORE and 14N ENDOR
The 14N hyperfine couplings were investigated by X- and Q-band three-pulse ESEEM and HYSCORE and Q-band ENDOR. In this case, the analysis was complicated by the additional presence of the nuclear quadrupole interaction for this I = 1 nucleus. The X-band HYSCORE spectra recorded for P1 and P2 are shown in Figure 6, and the Q-band ENDOR spectra are shown in Figure 7. The three-pulse ESEEM spectra are shown in the Supporting Information along with the corresponding simulations.
Figure 6.
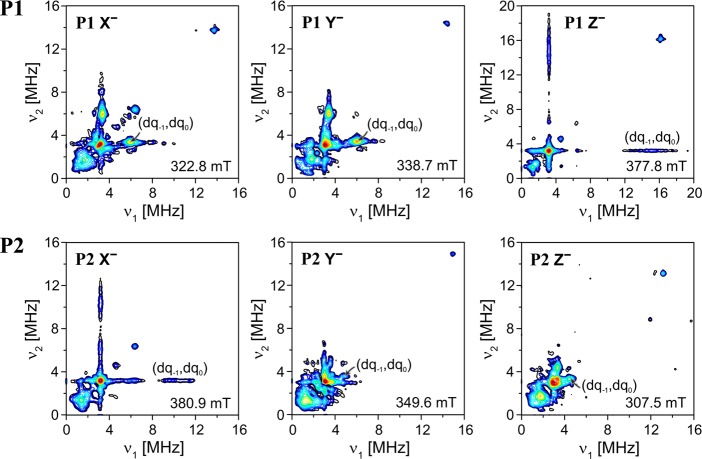
X-band HYSCORE spectra recorded at 20 K at the X–, Y–, and Z– field positions for P1 (top) and P2 (bottom). The Z– spectrum for P1 was recorded using 14N matched HYSCORE. The experimental details are described in the Supporting Information.
Figure 7.
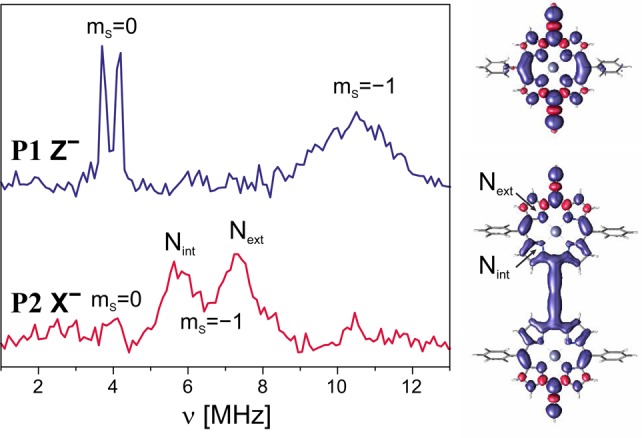
Q-band Davies ENDOR spectrum for P1 and Mims ENDOR spectrum for P2 recorded at the Z– (1233.2 mT) and X– (1235.0 mT) field positions, respectively. The Mims ENDOR spectrum was obtained as the sum of spectra recorded for four different τ values; nevertheless, the presence of blind spots leads to a reduced intensity of the transitions in the mS = 0 manifold centered at about 4 MHz. The B3LYP/EPRII spin density distributions for P1 and P2 are shown on the right.
The characteristics of HYSCORE spectra of triplet states in general and specifically of P1 are discussed in detail in ref. (56). The information on the nitrogen hyperfine couplings can be most easily obtained from the positions of the double quantum (dq) cross peaks in the HYSCORE spectrum, since they do not depend on the nuclear quadrupole interaction to first order.57 The hyperfine coupling can be estimated to approximately half the distance between the dq cross peaks. The dq cross peaks are usually easily identified as they are the strongest cross peaks present in the spectrum for disordered samples.58 In the HYSCORE spectra corresponding to the two in-plane orientations of P1, X and Y, the dq peaks occur at about (3,6) MHz for both (corresponding to a hyperfine coupling of approximately 1.5 MHz). On the other hand, in the spectrum corresponding to the out-of-plane orientation Z, the dq peaks only become clearly visible using 14N matched HYSCORE and consist of broad ridges centered at about (3, 15) MHz (yielding an estimate of about 6 MHz for the out-of-plane hyperfine coupling). This indicates an approximately axial hyperfine interaction tensor with a large hyperfine coupling in the out-of-plane orientation, as also previously observed for a free base porphyrin.59 The broad ridges in the HYSCORE spectrum of the Z orientation are unexpected for a triplet state, where single-crystal-like spectra are usually anticipated because of orientation selection, which is particularly strong for the Z orientation. However, the result is confirmed by Q-band ENDOR (see Figure 7, top graph), where the single-quantum (sq) transitions of the mS = 0 manifold give rise to two sharp lines, with a splitting due to the nuclear quadrupole interaction, while the single-quantum transitions of the mS = −1 manifold give rise to a considerably broadened peak centered at about 11 MHz. A similar broadening of HYSCORE cross peaks was also reported for the out-of-plane nitrogen hyperfine couplings of a cobalt corrin and was attributed to a distribution of hyperfine couplings.60,61
The origin of this distribution of out-of-plane hyperfine couplings is attributed to the influence of pyridine, coordinated to the Zn ion of the porphyrin, on the geometry of the porphyrin plane. A potential energy surface scan performed by DFT for different Zn–pyridine distances shows increasing saddlelike distortions of the porphyrin plane of P1 as the pyridine molecule approaches the zinc ion (see Figure 8). The average Zn–pyridine distance from crystal structures of zinc porphyrins is 2.16 Å,15 in close agreement with the 2.17 Å determined from the DFT calculations. The out-of-plane component of the nitrogen hyperfine interaction was calculated for each of the structures and was found to vary between about 6 and 8 MHz (see Figure 8), leading to a distribution in close agreement with experimental observations.
Figure 8.
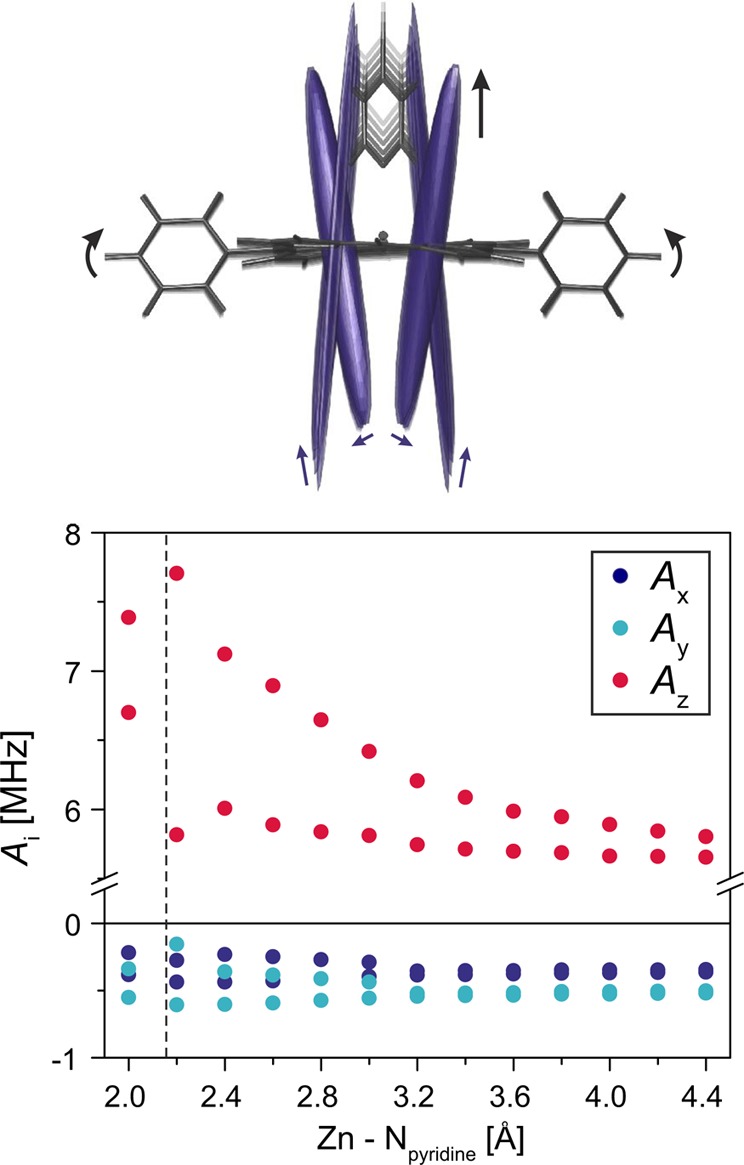
DFT geometries and nitrogen hyperfine tensors calculated for different Zn–pyridine distances in P1 (top) and principal values of the hyperfine coupling tensor as a function of the distance between the Zn ion and the nitrogen of the coordinated pyridine molecule obtained from B3LYP/EPRII calculations (bottom). The dashed line indicates the mean Zn–pyridine distance determined on the basis of the known crystal structures.15 At short Zn–pyridine distances, the 14N nuclei are inequivalent in pairs, leading to two values for the hyperfine couplings in each direction. The arrows indicate changes in geometry and hyperfine tensors for increasing distances between the Zn ion and the pyridine.
The results of X-band HYSCORE measurements at the X–, Y–, and Z– field positions for P2 are shown on the bottom in Figure 6, and the Q-band ENDOR spectrum for the out-of-plane orientation is shown in Figure 7 (bottom graph). The comparison with the results for P1 yields similar observations as reported previously for the proton ENDOR spectra.
The largest nitrogen hyperfine couplings, assigned to the out-of-plane orientation, again shift from the Z orientation in P1 to the X orientation in P2. The sign of the out-of-plane nitrogen hyperfine couplings is positive, as the dq features are observed for the mS = −1 → mS = 0 transitions,56 and the experimental HYSCORE data therefore confirm the sign change of D. The magnitude of the nitrogen hyperfine couplings is reduced by a factor of about 2 from P1 to P2, as can be seen for the two in-plane orientations (X and Y for P1, Z and Y for P2) as the dq peaks shift to lower frequencies and closer to the diagonal.
In addition to a reduction in nitrogen hyperfine couplings from P1 to P2, a splitting of the dq features in the HYSCORE spectrum and of the broad sq peak in the Q-band ENDOR spectrum into two is observed for the out-of-plane orientation (Z in P1 and X in P2). The splitting is indicative of a different spin density distribution around the external and internal nitrogen nuclei in P2 (Next and Nint in Table 3 and Figure 7). This is found to be in agreement with DFT calculations, which predict smaller couplings for the internal nitrogen nuclei and larger couplings for the external nitrogen nuclei; the latter are more similar in terms of hyperfine anisotropy and nuclear quadrupole interaction to those of P1.
Table 3. 14N Hyperfine and Nuclear Quadrupole Interaction Parameters for P1 and P2a.
| Ax [MHz] | Ay [MHz] | Az [MHz] | α | β | γ | Q [MHz] | η | α | β | γ | ||
|---|---|---|---|---|---|---|---|---|---|---|---|---|
| P1 | N | 1.8 ± 0.3 | 2.1 ± 0.3 | 6.8 ± 2.8 | 19° | 9° | –145° | 2.30 ± 0.01 | 0.79 ± 0.18 | 81° | 91° | 135° |
| P2 | Next | 0.8 ± 0.2 | 1.1 ± 0.2 | 3.5 ± 1.4 | 33° | 91° | 180° | 2.25 ± 0.01 | 0.75 ± 0.20 | 93° | 45° | 90° |
| Nint | 0.5 ± 0.2 | 0.6 ± 0.2 | 1.9 ± 1.4 | 30° | 92° | 180° | 2.35 ± 0.01 | 0.80 ± 0.20 | 93° | 45° | 90° |
The hyperfine and nuclear quadrupole couplings were determined by fitting of the experimental data as described in the Supporting Information. The tensor orientations used in the simulations are derived from DFT calculations on the triplet states of P1 and P2 in the absence of pyridine. The standard deviations indicate the distribution of values used in the simulations; there is an additional error on the center of the distribution of about 0.3 MHz for Ax and Ay, of 0.1 MHz for Az, of 0.05 MHz for Q, and of 0.1 on η.
Analysis of the experimental data was complicated by the potential presence of a contribution from the pyridine nitrogen. HYSCORE measurements performed on P1 in MeTHF without pyridine show a significant decrease in intensity of the dq cross peaks in the HYSCORE spectra corresponding to the X and Y orientation. However, no changes were observed for the spectrum corresponding to the Z orientation (see Supporting Information). The conclusion of delocalization in the porphyrin dimer can be drawn independently from the assignment of the dq peaks in the spectra corresponding to the X– and Y– transitions to the porphyrin or pyridine nitrogen nuclei, as the same decrease in hyperfine couplings is expected for both in case of delocalization of the triplet state over the two porphyrin units in P2.
Simultaneous fitting of the experimental ESEEM, HYSCORE, and ENDOR data was performed for two cases, that is, assuming that the dq cross peaks in the HYSCORE spectra are determined by both the porphyrin and the pyridine nitrogen and assuming that the dq cross peaks are solely determined by the pyridine hyperfine couplings. The orientations of the hyperfine and nuclear quadrupole tensors were kept fixed at the values obtained from DFT calculations, which are in agreement with previous findings on similar porphyrin systems.59 In both cases, a satisfactory fit of the experimental data can be obtained, and the differences in fitting parameters are limited to the Ax and Ay values. The simulations are shown in the Supporting Information, and the fitting parameters for the porphyrin nitrogen nuclei are summarized in Table 3 (assuming contribution of porphyrin and pyridine nuclei to the dq cross peaks, full set of fitting parameters in the Supporting Information).
Discussion
In this study, we used a series of different EPR techniques to characterize the triplet state of a porphyrin monomer (P1) and of the corresponding porphyrin dimer (P2), with a butadiyne link at the meso positions. The experimental results provide evidence for complete delocalization of the triplet state in the porphyrin dimer, accompanied by a reorientation of the ZFS tensor and a sign change of the zero-field splitting parameter D.
The proton and nitrogen hyperfine couplings determined from the ENDOR and HYSCORE data were both reduced by a factor of 2 from P1 to P2, unequivocally demonstrating delocalization of the triplet state over both porphyrin units in the porphyrin dimer. While a distinction of a hopping mechanism on the EPR time scale (107−109 s–1) from coherent delocalization is not possible on the basis of the EPR data, the fact that the relaxation behavior does not change significantly from P1 to P2 (data not shown) renders coherent delocalization plausible. The fixed coplanar orientation of the two porphyrin units in P2 in frozen solution, as evidenced by temperature-dependent changes in the UV–vis absorption spectrum (see Supporting Information), prevents assignment of the delocalization mechanism by study of the ZFS parameters and spin polarization.33
The orientational selectivity of the ENDOR and HYSCORE experiments for triplet states, with the aid of the results from DFT calculations, allowed the determination of the ZFS tensor orientation with respect to the molecular frame for both P1 and P2. In the case of the porphyrin monomer, the Z axis corresponds to the out-of-plane axis and the X and Y axes are located in the porphyrin plane, along the alkyne bonds and the phenyl groups, respectively (see Figure 5A and D). In the porphyrin dimer, the triplet X and Z axes were found to be interchanged, making the long axis of the molecule the new Z orientation. This change of the axis of maximum dipolar coupling from the out-of-plane orientation to the vector connecting the two porphyrin units is confirmed by magnetophotoselection experiments, which show that for P2 the triplet Z axis is aligned with the optical transition moment directed along the long axis of the molecule (Qx). This reorientation of the ZFS tensor, accompanied by a sign change of D, corresponds to the transition from an oblate to a prolate spin distribution.37 This transition has been proposed before for similar systems on the basis of changes of the E/D ratio,25,40 but the results shown here provide the first conclusive experimental proof for its occurrence.
The reorientation of the ZFS tensor also explains the changes in spin polarization of the transient EPR spectrum from P1 to P2. The mechanism driving the intersystem crossing in zinc porphyrins is determined by the spin–orbit coupling of the zinc ion and leads to preferential population of the out-of-plane triplet sublevel.45−47 The out-of-plane sublevel corresponds to the Z transition in P1 but to the X transition in P2, and hence, the spin polarization exhibited by the transient EPR spectrum changes accordingly.
The increase of the ZFS D value from P1 to P2 is also qualitatively explained by the transition from an oblate to a prolate spin distribution. In a simplified description of ZFS in terms of the point-dipole approximation, the D value for a prolate spin distribution with the same average interelectron distance as an oblate spin distribution becomes negative and increases by a factor of 2 in magnitude.18,22,23,25 Calculation of the average interelectron distance from the experimental D values of P1 and P2 in the framework of the point-dipole approximation yields estimates of about 3.5 and 4.1 Å for P1 and P2, respectively (the meso-to-meso distance of the porphyrin amounts to about 6.9 Å). As in previously published work,18,22,23,25,40 this could lead to the conclusion that the triplet state is localized on a single porphyrin unit in both P1 and P2. This interpretation is, however, proven to be incorrect for the porphyrin systems studied here by the hyperfine interaction data and the spin polarization of the transient EPR spectrum of P2 which prove delocalization over both units in P2. Therefore, the point-dipole approximation is not applicable to the determination of the extent of triplet state delocalization in these systems, where the spin density is delocalized extensively over the monomeric units and the unsaturated linker. In a study on nitroxide diradicals by Riplinger et al.,41 distributed point-dipole approximations or quantum mechanical calculations were suggested as better methods for the interpretation of ZFS parameters in these cases.
The calculation of ZFS parameters for the triplet states of aromatic molecules with a distributed point−dipole approximation as proposed by Visser and Groenen62 is based on the assumption that the triplet wave function can be described as a linear combination of the atomic p orbitals, modeled by two half-point spins separated by 61 pm from the nucleus. The ZFS D value can then be calculated as a sum of two-center terms with weights given by the coefficients of the molecular orbitals occupied by the two unpaired triplet spins. This method has been refined further and has been modified to include spin polarization effects for the study of fullerene triplet states by van Gastel.63,64 The D values calculated using this method for P1 and P2 with the Mulliken spin populations obtained by DFT for the highest occupied molecular orbital (HOMO) and lowest unoccupied molecular orbital (LUMO) of the corresponding ground states correctly reproduce the change in sign and the increase in magnitude from P1 to P2 (3140 MHz for P1 and −7160 MHz for P2), but the predicted values deviate considerably from the experimental results.
The ZFS interaction parameters of P1 and P2 were also calculated by DFT as described in the Supporting Information. On the basis of the results of time-dependent DFT calculations performed for P1, which assigned the first excited triplet state mainly to the HOMO → LUMO transition, the ZFS interaction was calculated for this electron configuration. The D and E values calculated for P1 at the B3LYP/EPRII level are 492 MHz and −120 MHz. For P2, they are equal to −609 and 72 MHz. DFT correctly predicts the change in sign and orientation of the ZFS tensor, and the calculated E/D ratio is relatively close to the experimental one. The absolute values, however, differ quite significantly, by almost a factor of 2. The reasonable agreement of the calculated and experimental hyperfine couplings provides a validation of the DFT wave function; therefore, the observed disagreement seems to be related to the calculation of the ZFS interaction. A similar discrepancy between experimental and calculated D values was observed for a series of polyacenes65,66 and was attributed to the limitation of DFT to predict ZFS interaction parameters for large aromatic systems accurately. Better agreement was in that case obtained using CASSCF calculations because of the inclusion of static π-electron correlation. Given the multiconfigurational nature of porphyrins, a description at the CASSCF level would certainly be more accurate, but currently the computational cost for performing this type of calculation for the systems investigated here is significant and seems unwarranted given that DFT still correctly predicts the relative changes in ZFS parameters: experimentally, an increase of the magnitude of D by 26% from P1 to P2 is observed and DFT predicts an increase of 24%. DFT calculations thus show an excellent agreement with the trends observed experimentally and would, in our case, be the best suited among the methods described in this paper for the interpretation of ZFS parameters in terms of triplet state delocalization.
Conclusions
Triplet state delocalization in a linear butadiyne-linked porphyrin dimer was investigated using transient EPR to characterize the ZFS interaction and ENDOR and HYSCORE to study the proton and nitrogen hyperfine couplings. A reduction by a factor of 2 of both proton and nitrogen hyperfine couplings was observed and interpreted in terms of complete delocalization of the photoexcited triplet state over both porphyrin units in the dimer. Orientation-selective ENDOR and HYSCORE as well as magnetophotoselection experiments provided evidence for a reorientation of the ZFS tensor characteristic of a transition from an oblate to a prolate spin distribution in the porphyrin dimer.
Previous investigations on triplet state delocalization in multiporphyrin arrays were based on the analysis of the zero-field splitting parameter D in terms of the point-dipole approximation and arrived at the conclusion of localization of the triplet state on a single porphyrin unit.18,22,23,40 Our results suggest delocalization over both porphyrin units in a butadiyne-linked porphyrin dimer. Analysis of the hyperfine couplings was required to conclusively prove triplet state delocalization; determination of the extent of delocalization from the ZFS D value alone using the popular point-dipole approximation would have led to an underestimation of the true delocalization length. DFT was shown to provide a more useful tool for the interpretation of trends in the change of ZFS parameters with regard to triplet state delocalization. Nevertheless, measurement of the hyperfine couplings provides the most accurate information on the extent of delocalization.
The results of this analysis provide the necessary foundation for understanding triplet state delocalization in longer polymer chains, which are currently being investigated in our lab.
Acknowledgments
The Q-band EPR measurements were performed at the National EPR Research Facility at the University of Manchester with the help of Dr. Alistair Fielding. The authors would like to acknowledge the use of the University of Oxford Advanced Research Computing (ARC) facility in carrying out this work. We would like to thank Prof. F. Neese and Dr. J. Harmer for suggestions and helpful discussions. We thank the EPSRC and the ERC (grant 320969) for support. P.N. acknowledges a Feodor Lynen research fellowship from the Alexander von Humboldt foundation and a Marie Curie Individual Fellowship (PIEF-GA-2011-301336).
Supporting Information Available
Experimental details, DFT spin density distributions and tensor orientations, and 14N ESEEM and HYSCORE simulations of the experimental data. The Supporting Information is available free of charge on the ACS Publications website at DOI: 10.1021/jacs.5b03249.
The authors declare no competing financial interest.
Supplementary Material
References
- Anderson H. L. Chem. Commun. 1999, 2323–2330. [Google Scholar]
- James D. K.; Tour J. M.. Molecular Wires. In Molecular Wires: From Design to Properties; DeCola L., Ed.; Springer Verlag: Berlin, 2005; Vol. 257, pp 33–62. [Google Scholar]
- Gust D.; Moore T.; Moore A. Acc. Chem. Res. 2001, 34, 40–48. [DOI] [PubMed] [Google Scholar]
- Choi M.-S.; Yamazaki T.; Yamazaki I.; Aida T. Angew. Chem., Int. Ed. 2004, 43, 150–158. [DOI] [PubMed] [Google Scholar]
- Wasielewski M. J. Org. Chem. 2006, 71, 5051–5066. [DOI] [PubMed] [Google Scholar]
- Fukuzumi S.; Ohkubo K.; Suenobu T. Acc. Chem. Res. 2014, 47, 1455–1464. [DOI] [PubMed] [Google Scholar]
- Anderson H. L.; Martin S. J.; Bradley D. D. C. Angew. Chem., Int. Ed. 1994, 33, 655–657. [Google Scholar]
- Senge M. O.; Fazekas M.; Notaras E. G. a.; Blau W. J.; Zawadzka M.; Locos O. B.; Ni Mhuircheartaigh E. M. Adv. Mater. 2007, 19, 2737–2774. [Google Scholar]
- Brun A. M.; Atherton S. J.; Harriman A.; Heitz V.; Sauvage J.-P. J. Am. Chem. Soc. 1992, 114, 4632–4639. [Google Scholar]
- Anderson H. L. Inorg. Chem. 1994, 33, 972–981. [Google Scholar]
- Lin V. S.-Y.; DiMagno S. G.; Therien M. J. Science 1994, 264, 1105–1111. [DOI] [PubMed] [Google Scholar]
- Cho H. S.; Jeong D. H.; Cho S.; Kim D.; Matsuzaki Y.; Tanaka K.; Tsuda A.; Osuka A. J. Am. Chem. Soc. 2002, 124, 14642–54. [DOI] [PubMed] [Google Scholar]
- Holten D.; Bocian D. F.; Lindsey J. S. Acc. Chem. Res. 2002, 35, 57–69. [DOI] [PubMed] [Google Scholar]
- Kim D.; Osuka A. J. Phys. Chem. A 2003, 107, 8791–8816. [Google Scholar]
- Sprafke J. K.; Kondratuk D. V.; Wykes M.; Thompson A. L.; Hoffmann M.; Drevinskas R.; Chen W.-H.; Yong C. K.; Kärnbratt J.; Bullock J. E.; Malfois M.; Wasielewski M. R.; Albinsson B.; Herz L. M.; Zigmantas D.; Beljonne D.; Anderson H. L. J. Am. Chem. Soc. 2011, 133, 17262–17273. [DOI] [PubMed] [Google Scholar]
- Yang J.; Kim D. Philos. Trans. R. Soc. London, Ser. A 2012, 370, 3802–3818. [DOI] [PubMed] [Google Scholar]
- Seth J.; Palaniappan V.; Johnson T. E.; Prathapan S.; Lindsey J. S.; Bocian D. F. J. Am. Chem. Soc. 1994, 116, 10578–10592. [Google Scholar]
- Angiolillo P. J.; Lin V. S.-Y.; Vanderkooi J. M.; Therien M. J. J. Am. Chem. Soc. 1995, 117, 12514–12527. [Google Scholar]
- Seth J.; Palaniappan V.; Wagner R. W.; Johnson T. E.; Lindsey J. S.; Bocian D. F. J. Am. Chem. Soc. 1996, 118, 11194–11207. [Google Scholar]
- Li J.; Ambroise A.; Yand S. I.; Diers J. R.; Seth J.; Wack C. R.; Bocian D. F.; Holten D.; Lindsey J. S. J. Am. Chem. Soc. 1999, 121, 8927–8940. [Google Scholar]
- Li J.; Diers J. R.; Seth J.; Yang S. I.; Bocian D. F.; Holten D.; Lindsey J. S. J. Org. Chem. 1999, 64, 9090–9100. [Google Scholar]
- Shediac R.; Gray M. H. B.; Uyeda H. T.; Johnson R. C.; Hupp J. T.; Angiolillo P. J.; Therien M. J. J. Am. Chem. Soc. 2000, 122, 7017–7033. [Google Scholar]
- Angiolillo P. J.; Susumu K.; Uyeda H. T.; Lin V. S.-Y.; Shediac R.; Therien M. J. Synth. Met. 2001, 116, 247–253. [Google Scholar]
- Kim D.; Osuka A. Acc. Chem. Res. 2004, 37, 735–745. [DOI] [PubMed] [Google Scholar]
- Angiolillo P. J.; Uyeda H. T.; Duncan T. V.; Therien M. J. J. Phys. Chem. B 2004, 108, 11893–11903. [Google Scholar]
- Susumu K.; Frail P. R.; Angiolillo P. J.; Therien M. J. J. Am. Chem. Soc. 2006, 128, 8380–8381. [DOI] [PubMed] [Google Scholar]
- Levanon H.; Norris J. Chem. Rev. 1978, 78, 185–198. [Google Scholar]
- Clarke R. H.; Hobart D. R.; Leenstra W. R. J. Am. Chem. Soc. 1979, 101, 2416–2423. [Google Scholar]
- Chandrashekar T. K.; van Willigen H. Chem. Phys. Lett. 1984, 106, 237–241. [Google Scholar]
- Hoff A. J.; Proskuryakov I. I. Chem. Phys. Lett. 1985, 115, 303–310. [Google Scholar]
- Lendzian F.; van Willigen H.; Sastry S.; Möbius K.; Scheer H.; Feick R. Chem. Phys. Lett. 1985, 118, 145–150. [Google Scholar]
- Budil D.; Thurnauer M. Biochim. Biophys. Acta 1991, 1057, 1–41. [DOI] [PubMed] [Google Scholar]
- Jägermann P.; Plato M.; Von Maltzan B.; Möbius K. Mol. Phys. 1993, 78, 1057–1074. [Google Scholar]
- Huber M.; Doubinskii A. A.; Kay C. W. M.; Möbius K. Appl. Magn. Reson. 1997, 13, 473–485. [Google Scholar]
- Lendzian F.; Bittl R.; Lubitz W. Photosynth. Res. 1998, 55, 189–197. [Google Scholar]
- Andréasson J.; Kajanus J.; Mårtensson J.; Albinsson B. J. Am. Chem. Soc. 2000, 122, 9844–9845. [Google Scholar]
- Lendzian F.; Bittl R.; Telfer A.; Lubitz W. Biochim. Biophys. Acta-Bioenerg. 2003, 1605, 35–46. [DOI] [PubMed] [Google Scholar]
- Bennati M.; Grupp A.; Mehring M.; Bäuerle P. J. Phys. Chem. 1996, 100, 2849–2853. [Google Scholar]
- Bennati M.; Németh K.; Surján P. R.; Mehring M. J. Chem. Phys. 1996, 105, 4441. [Google Scholar]
- Angiolillo P. J.; Rawson J.; Frail P. R.; Therien M. J. Chem. Commun. 2013, 49, 9722–9724. [DOI] [PubMed] [Google Scholar]
- Riplinger C.; Kao J. P. Y.; Rosen G. M.; Kathirvelu V.; Eaton G. R.; Eaton S. S.; Kutateladze A.; Neese F. J. Am. Chem. Soc. 2009, 131, 10092–10106. [DOI] [PMC free article] [PubMed] [Google Scholar]
- Stoll S.; Schweiger A. J. Magn. Reson. 2006, 178, 42–55. [DOI] [PubMed] [Google Scholar]
- Gonen O.; Levanon H. J. Phys. Chem. 1985, 89, 1637–1643. [Google Scholar]
- Thurnauer M. C. Rev. Chem. Intermed. 1979, 3, 197–230. [Google Scholar]
- Clarke R. H.; Connors R. E.; Schaafsma T. J.; Kleibeuker J. F.; Platenkamp R. J. J. Am. Chem. Soc. 1976, 98, 3674–3677. [Google Scholar]
- Ake R. L.; Gouterman M. Theor. Chim. Acta 1969, 42, 20–42. [Google Scholar]
- Van Dorp W. G.; Schoemaker W. H.; Soma M.; Van der Waals J. H. Mol. Phys. 1975, 30, 1701–1721. [Google Scholar]
- Siegel S.; Judeikis H. S. J. Phys. Chem. 1966, 70, 2205–2211. [Google Scholar]
- Thurnauer M. C.; Norris J. R. Chem. Phys. Lett. 1977, 47, 100–105. [Google Scholar]
- Drobizhev M.; Stepanenko Y.; Dzenis Y.; Karotki A.; Rebane A.; Taylor P. N.; Anderson H. L. J. Phys. Chem. B 2005, 109, 7223–7236. [DOI] [PubMed] [Google Scholar]
- Beljonne D.; O’Keefe G. E.; Hamer P. J.; Friend R. H.; Anderson H. L. J. Chem. Phys. 1997, 106, 9439–9460. [Google Scholar]
- TD-DFT calculations using Gaussian09/D.01 at the B3LYP/6-31G*/LANL2DZ level of theory support the conclusion that the longest-wavelength and most intense component of the Q-band in porphyrin monomer P1 is polarized along the axis of the alkyne bonds (x-axis). We thank Martin D. Peeks for carrying out these calculations.
- Winters M. U.; Kärnbratt J.; Eng M.; Wilson C. J.; Anderson H. L.; Albinsson B. J. Phys. Chem. C 2007, 111, 7192–7199. [Google Scholar]
- Kay C. W. M.; Di Valentin M.; Möbius K. Sol. Energy Mater. Sol. Cells 1995, 38, 111–118. [Google Scholar]
- Kay C. W. M. J. Am. Chem. Soc. 2003, 125, 13861–13867. [DOI] [PubMed] [Google Scholar]
- Tait C. E.; Neuhaus P.; Anderson H. L.; Timmel C. R.; Carbonera D.; Di Valentin M. Appl. Magn. Reson. 2015, 46, 389–409. [Google Scholar]
- Harmer J.; Mitrikas G.; Schweiger A.. Advanced Pulse EPR Methods for the Characterization of Metalloproteins. In High Resolution EPR; Hanson G., Berliner L., Eds.; Springer Science: New York, 2009; Vol. 28, pp 13–61. [Google Scholar]
- van Doorslaer S. EPR newsletter 2008, 17, 9–12. [Google Scholar]
- Singel D. J.; van der Poel W. A. J. A.; Schmidt J.; van der Waals J. H.; De Beer R. J. Chem. Phys. 1984, 81, 5453–5461. [Google Scholar]
- Harmer J.; Van Doorslaer S.; Gromov I.; Schweiger A. Chem. Phys. Lett. 2002, 358, 8–16. [Google Scholar]
- Van Doorslaer S.; Jeschke G.; Epel B.; Goldfarb D.; Eichel R.-A.; Kräutler B.; Schweiger A. J. Am. Chem. Soc. 2003, 125, 5915–5927. [DOI] [PubMed] [Google Scholar]
- Visser J.; Groenen E. J. J. Chem. Phys. Lett. 2002, 356, 43–48. [Google Scholar]
- van Gastel M. J. Chem. Phys. 2009, 131, 124111. [DOI] [PubMed] [Google Scholar]
- van Gastel M. J. Phys. Chem. A 2010, 114, 10864–10870. [DOI] [PubMed] [Google Scholar]
- Loboda O.; Minaev B.; Vahtras O.; Schimmelpfennig B.; Agren H.; Ruud K.; Jonsson D. Chem. Phys. 2003, 286, 127–137. [Google Scholar]
- Sinnecker S.; Neese F. J. Phys. Chem. A 2006, 110, 12267–12275. [DOI] [PubMed] [Google Scholar]
Associated Data
This section collects any data citations, data availability statements, or supplementary materials included in this article.


