Abstract
Objective:
In this study, it is aimed to compare the distribution of stress on periodontal and peri-implant bone tissues in 3- and 5-unit-dental and implant-supported zirconia restorations using finite element analysis.
Materials and Methods:
Stress distribution formed in periodontal and peri-implant bone tissues as a result of chewing forces was analyzed in dental and implant-supported three-dimensional (3D) finite element models of zirconia restoration with 5-unit placed on the numbers of 43, 44, 45, 46, and 47 and with 3-unit placed on the number of 45, 46, and 47. Four different loading conditions were used. 200 N force was applied in 30° from the buccal inclination of number 43, 45, and 47 restorations separately and totally 850 N force was applied in 30° from the buccal inclination of whole restoration. The study was performed through static nonlinear analysis with the 3D finite element analysis method.
Results:
Stress accumulation in bone tissues in the tooth-supported model was found less than in implant-supported models. Stress accumulation was observed in the cervical portion of the implant in implant-supported models, and stress accumulation was observed surrounding bone of roots in tooth-supported models. The highest stress values were occurred in 5 unit implant-supported model in all loadings.
Conclusion:
In posterior restorations increased in the number of supported teeth and implant can reduce the destructive forces on periodontal and peri-implant bone tissues and may allow longer period retention of the restorations in the mouth.
Keywords: Finite element analysis, implant-supported prosthesis, peri-implant and periodontal bone, tooth-supported prosthesis, zirconia restorations
INTRODUCTION
Since the osseointegration was defined as the directly structural and functional connection, without having a fibrous tissue between the living bone tissue and implant surface under loading in 1960s, the dental implant-supported prosthesis have been scientifically accepted and a common treatment choice in the case reconstructing of partial or total tooth loss.[1,2]
Full ceramic restorations have been developed instead of metal ceramic restorations owing to disadvantages aesthetically and biologically in the prosthetic treatment of tooth loss.[3,4] Full ceramic restorations are also used in the construction of large restorations on the posterior region with the development of high-resistant oxide ceramics. Especially zirconia (zirconiumdioksit) began to be commonly used nowadays among full ceramic restorations.[5,6]
Zirconia gathers almost all the advantages of dental materials in one single material. These excellent durability and elasticity values allow the upper structures to be done very precisely.[7,8] In addition, the surface of zirconia is very clean because zirconia (unlike metal alloys) does not have any static load. This enables the making of upper structures with an optimal entrance way, with less plaque accumulation and plaque retention force.[7,8] Furthermore, zirconia oxide ceramic is a material that has proven itself in medical technology.[7,8] Zirconia is similar to metals in terms of the mechanical properties and to the teeth in terms of color characteristics.[7,8] When used the appropriate connector in accordance with the studies, zirconia restorations are expected to be successful for a long-time in the mouth.[7,8]
Although numerous advantages of zirconia oxide, considerable amount of work has been devoted to the characterization of a less appealing characteristic of zirconia: Its susceptibility to low temperature degradation.[9] This phenomenon was first reported by Kobayashi et al. and some other authors mentioned about this situation.[10,11,12,13] A high operating temperature of ≈1000°C is necessary for zirconia to achieve the high level of ionic conductivity required for efficient operation.[14] Full stabilization is purposefully not achieved in the yttria-stabilized tetragonal zirconia polycrystals material.[9,15] For zirconia, spontaneous phase changes can occur in the crystalline structure. This occurs at higher temperatures. This situation limits mass transport and thus raises the temperature when the critical particle size is reached.[16,17]
Finite Elements Analysis Method (FEA) is a numerical method used to analyze the stress and deformations occurring in the structure of a geometric model. Not only is FEA used to evaluate and analyze root-formed implants and the forces from the bone implant interface, but also it took its place in dental technology as a method for evaluation of the various clinical situations and prosthetic options. This method aims to solve the complicated problems through mathematical methods by separating them into interrelated simpler and small structures.[18]
While the basic reason of early term loss of implant in endosseous dental implantation is the infection of peri-implant tissues, the basic reason of implant-loss after the loading and osseointegration is the loss of bone which occurs on the implant neck region. The occurrence of loss of peri-implant bone after loading derives from the excessive stress that comes along the long axis of implant and/or having a wrong direction. The type of stress, the features of materials of which the implants and prosthesis are made, the implant geometry and it's surface structure, the quality and the quantity of bones around implant, the structure between bone and implant are the factors that determine the stress which affect the bones around implants.[19]
Determining the reasons of the loss of implants, the analysis of the mechanic relations between bone and implant are important for planning of an effective, useful and dependable implant system.[18] FEA has taken part in literature as being a useful method to determine the tensions that occur on bone-implant intersurface during mechanic loading. Using FEA, it has suggested that the highest stress rate in endosseous dental implantation occurs in the occlusal part of cortical bone around implant.[18] Many researchers have done lots of studies to increase the contact area on between the bone and implant intersurface and to lessen the crestal bone loss by diminishing the stress which affects the cortical alveolar bone.[18,19,20,21] The studies which aim to increase the connection fields on the bone and implant intersurface concentrate on the size of implants, the implant geometry and/or the length of the implants.
The aim of this study, in implant and teeth-supported designs placed into the mandibular region, is to evaluate stress values of fixed partial prosthesis with 3- and 5-unit zirconia occurring perimplant bone structure by the three-dimensional (3D) FEA.
MATERIALS AND METHODS
In separate tooth-supported and implant-supported designs in this study, we examined the stress distribution and values of chewing forces that occurred on teeth and implant in 3-unit zirconia restoration in areas 45–47 and in 5-unit zirconia restoration in areas 43–47. The research was conducted by a 3D finite elements stress analysis method and by static nonlinear analysis. By specifying boundary conditions for this method, four tooth-supported and implant-supported models involving areas 45–47 and only the areas 43–47 were used [Figure 1a–d].
Figure 1.
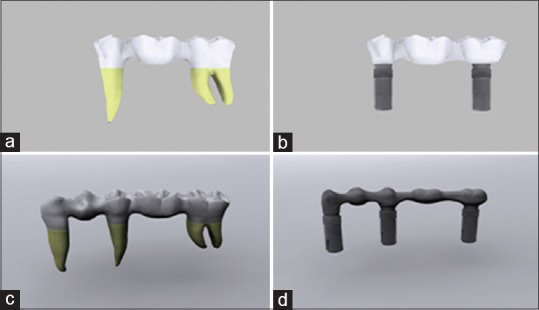
(a) 3 unit tooth-supported model (model 1). (b) 3 unit implant-supported model (model 2). (c) 5 unit tooth -supported model (model 3). (d) 5 unit implant-supported model (model 4)
Modeling
Teeth 43, 45, and 47 were used in our research. For this purpose, the front, side, upper, and lower images of the related tooth from the wheeler atlas were obtained. The same atlas was also used for the tooth sizes.[22] The tooth was modeled, based on these images by using Rhinoceros software (USA) and scaled. In this way, an anatomically realistic tooth model was constructed [Figure 2a].
Figure 2.
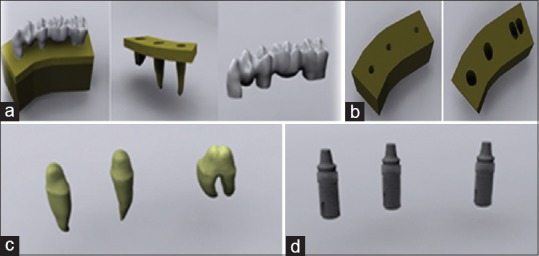
(a) The modeling of the bone and teeth. (b) Tooth and implant slots opened on computer aided designed bone models. (c) Preparations are modeled in computer. (d) Implant are modeled in computer
After modeling the teeth, the bone tissue surrounding the teeth models in at least 1 cm thickness with stress analysis was initiated. For this purpose, a 40 mm × 30 mm × 20 mm bone was modeled. A 2 mm thick cortical bone was constructed in the bone by using the offset method. The interior surface in the cortical bone was defined as a spongious bone. After characterizing cortical and spongious bone, the modeled teeth were extracted from the bone tissues by using a Boolean method while the teeth were in their original positions. While these procedures were followed, the Boolean method was not used for teeth 44 and 46. In this way, missing teeth were created for teeth 44 and 46. Because of this stage, the structure of the teeth in the bones was modeled [Figure 2b]. The thickness of the periodontal ligament (PDL) surrounding the teeth was defined as 100 μ. The preparatory procedure was defined as 2 mm from the occlusal surface in teeth 43, 45, and 47. It ended in the shape of a knife edge in the margins and was performed by using a computer program [Figure 2c]. Using the upper structure of the accomplished digital preparation, a cement layer of 100 μ thickness was modeled with a shell method.[23]
The zirconia framework was modeled by using the upper part of the cement layer. The connector area was created in the size of 3 mm × 3 mm × 3 mm.
The veneer layer was modeled by extracting the zirconia lower model with the Boolean method from the crown part that was created with the cutting of the tooth in the preparation border.
The implant–implant-supported model in the study was obtained by locating a 4.0 mm × 13 mm dental implant (Astra Tech Microthread OsseoSpeed 4.0, Sweden) to area 47 and locating a 4.0 mm × 11 mm dental implant (Astra Tech Microthread OsseoSpeed 4.0) to areas 43, 45, and 47 [Figure 2d].
Implants that were used in this study were scanned in 3D by the “Next Engine” scanner (USA, Santa Monica, CA) set in the macro mode. The point cloud that was acquired was saved in “.stl” format. The documents that were saved in this format were opened in Rhinoceros software and the adjustification of the implants with other sets were ensured. Modelings that were performed in Rhinoceros software were transferred to Fempro software (USA) by preserving the 3D coordinates.
The models that were obtained were converted to the concrete model as bricks and tetrahedra elements. Elements with 8 nodes were used in the bricks and tetrahedra concrete modeling system to the extent that they could be created in the Fempro model. The abutment and implant angle was determined as 0° in all created models.
Before analysis, the contact fixation was defined in the mergence sections of implant-abutment-screw mergence in the model. The friction coefficient in these areas was calculated as 0.5.[24]
The structure of the PDL in this study was accepted as nonlinear and was analyzed by using the following formula: σ = 1.498246 × 10⁻² ε3 where, σ is stress, and ε is a strain.
The thickness of the cortical bone (from which the modeling was made) was prepared at 2 mm. It was homogenous throughout. As with all other materials, the cortical and trabecular bone linear structures were regarded as homogenous and isotropic materials. In this study, we acknowledge that the implant was fully combined with bone and no other material on the surface of the bone implant was defined.[25]
Material features
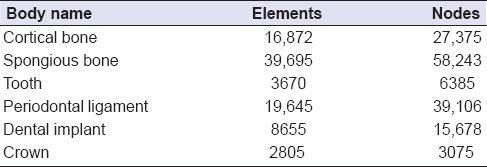
The features of the material significantly affect the stress and strain distribution inside the structure that will be used. Homogenous, linear, and elastic forms of the materials that are used in FEA are characterized with two material fixations: The elasticity module (i.e., Young's module) and the Poisson ratio. Table 1 shows the Poisson ratio and elasticity module values of the materials that were used in this study. Our value for the PDL's elastic modulus was close to correctly documented values from original studies.[26] Table 2 shows the element assignments in the finite element models.
Table 1.
Poisson ratio and elasticity modulus values of materials used in the study
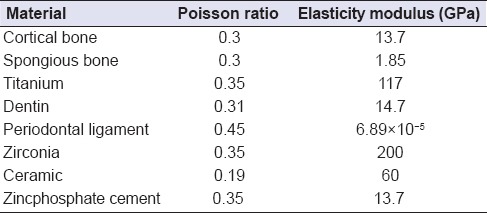
Table 2.
Element assignments in the finite element models
Boundary conditions
The models we obtained were fixed in such a way that it would have 0 movement ability in every degree of freedom from the lower and side areas of the cortical bone and the trabecular bone.
Loading conditions
The nonlinear static analysis in four different loading conditions was used on 3D concrete models that we prepared.
Loading condition 1
100 N force was applied in 30° from the buccal inclination of number 43 restorations' buccal cusp to far axis.[18,27,28]
Loading condition 2
200 N force was applied in 30° from the buccal inclination of number 45 restorations' buccal cusp to far axis.[18,27,28]
Loading condition 3
200 N force was applied in 30° from the buccal inclination of number 47 restorations' buccal cusp to far axis.[18,27,28]
Loading condition 4
100 N force over number 43 restoration, 150 N force over number 44 restoration, and 200 N from the each of the rest of the units, as a result, 850 N force was applied in 30° from buccal inclination of numbers 43, 44, 45, 46, and 47 restorations’ buccal cusp to far axis.[18,27,28]
Implementation of measurements
In this study, loading was applied to 3-unit and 5-unit teeth and implant-supported zirconium-based fixed bridge prostheses. Only the highest von Mises stress values from the teeth and implants as part of the findings resulting from loading were compared by and among themselves. The examination was performed to determine which condition and which location had the greatest stress values. The “X” coordinate system in the Figures is expressed as “lingual;” the “Y” coordinate system, as “distal;” and the “Z” coordinate system, as the “maxillary upper structure.”
Statistical analyses could not be performed because the values obtained by using finite elements stress analysis resulted from nonvariational mathematical calculations. The purpose was to carefully examine and interpret the values and stress distributions obtained from the analyses.[18]
RESULTS
Minimum principal stress evaluation
The highest compression stress values occurring in 3 and 5 unit implant-supported models (model 2 and model 4) [Figure 3d–f] were found to be more when compared to the those highest compression stress values occurring in 3 and 5 unit tooth-supported models (model 1 and model 3) [Figures 3a–c, 4a–d and Tables 3 and 4].
Figure 3.
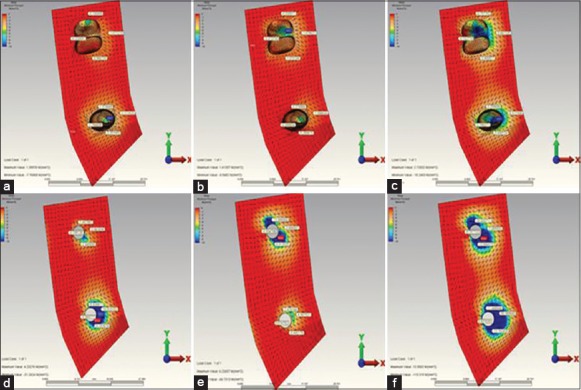
(a) When installing over the second premolar restoration, the highest minimum principal stress occurring in the in reference point in model 1. (b) When installing over the 2. molar restoration, the highest minimum principal stress occurring in the in reference point in model 1. (c) When installing over the complete restoration, the highest minimum principal stress occurring in the in reference point in model 1. (d) When installing over the second premolar restoration, the highest minimum principal stress occurring in the in reference point in model 2. (e) When installing over the 2. molar restoration, the highest minimum principal stress occurring in the in reference point in model 2. (f) When installing over the complete restoration, the highest minimum principal stress occurring in the in reference point in model 2
Figure 4.
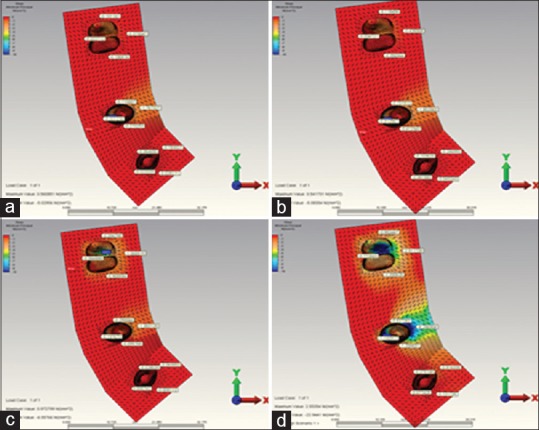
(a) When installing over the canine restoration, the highest minimum principal stress occurring in the in reference point in model 3. (b) When installing over the second premolar restoration, the highest minimum principal stress occurring in the in reference point in model 3. (c) When installing over the molar restoration, the highest minimum principal stress occurring in the in reference point in model 3. (d) When installing over the complete restoration, the highest minimum principal stress occurring in the in reference point in model 3
Table 3.
The highest minimum principal stress values regions observed in model 1, 2, 3 and 4

Table 4.
The highest maximum principal stress values regions observed in model 1, 2, 3, and 4

In 5 unit tooth-supported model (model 3) [Figure 4], the highest compression stress values occurring during the 2. premolar and 2. molar loading were found to be less than the highest compression stress values occurring during the second premolar and 2. molar loading in 3 unit tooth-supported model (model 1) [Figure 3a–c and Table 3].
The highest compression stress occurred at the end of the complete loading in 5 unit implant-supported model (model 4) [Figure 5a–d and Table 3].
Figure 5.
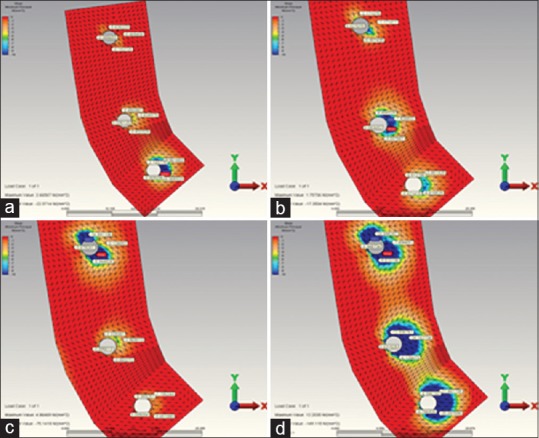
(a) When installing over the canine restoration, the highest minimum principal stress occurring in the in reference point in model 4. (b) When installing over the second premolar restoration, the highest minimum principal stress occurring in the in reference point in model 4. (c) When installing over the molar restoration, the highest minimum principal stress occurring in the in reference point in model 4. (d) When installing over the complete restoration, the highest minimum principal stress occurring in the in reference point in model 4
The highest compression stress occurring in all loading individually made in abutment teeth and implants revealed on the bone surface of the root or surrounding of that support. Only 5 unit tooth-supported model (model 3) departs from this rule [Figure 4a–d and Table 3]. In this model did the highest compression stress reveal as a result of canine loading. But the highest compression value revealed at the end of the canine loading was seen not on the canine tooth, but on the buccal root bone surface of the second premolar tooth.
In all other models except for model 4 (5 unit implant-supported model), the highest compression stress occurring as a result of complete-loading revealed on the bone surface of the root or surrounding of the second premolar tooth or implant. Whereas in model 4, it was seen on the distal bone surface of the 2. molar implant [Figure 5a–d and Table 3].
The highest compression stress occurring as a result of the second premolar loading was observed in 3 unit implant-supported model (model 2) [Figure 3d–f and Table 3].
The highest compression stress occurring as a result of the 2. molar loading was indicated in 5 unit implant-supported (model 4) model [Figure 5a–d and Table 3].
The highest compression stress occurring as a result of the canine loading was indicated in 5 unit implant-supported model (model 2) [Figure 5a–d and Table 3].
The stress toward the bone in implant-supported restorations is much more than the tooth-supported ones. The highest stress values in bone in tooth-supported models were indicated on the bone surface surrounding the root. In implant-supported models, it was seen on implant neck region near the top level of the bone. This indicates that tooth-supported models distribute the occurring stress better [Figures 3–5 and Tables 3 and 4].
Maximum principal stress evaluation
The highest compression stress values occurring in 3 and 5 unit implant-supported models (model 2 and model 4) [Figure 6d–f] were found to be more when compared with the highest compression stress values occurring in 3 and 5 unit tooth-supported models (model 1 and model 3) [Figure 6, 7 and Table 4].
Figure 6.
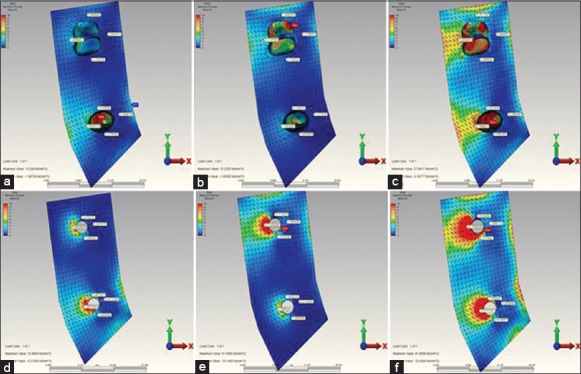
(a) When installing over the second premolar restoration the highest maximum principal stress occurring in the in reference point in model 1. (b) When installing over the second molar restoration the highest maximum principal stress occurring in the in reference point in model 1. (c) When installing over the complete restoration the highest maximum principal stress occurring in the in reference point in model 1. (d) When installing over the second premolar restoration the highest maximum principal stress occurring in the in reference point in model 2. (e) When installing over the second molar restoration the highest maximum principal stress occurring in the in reference point in model 2. (f) When installing over the complete restoration the highest maximum principal stress occurring in the in reference point in model 2
Figure 7.
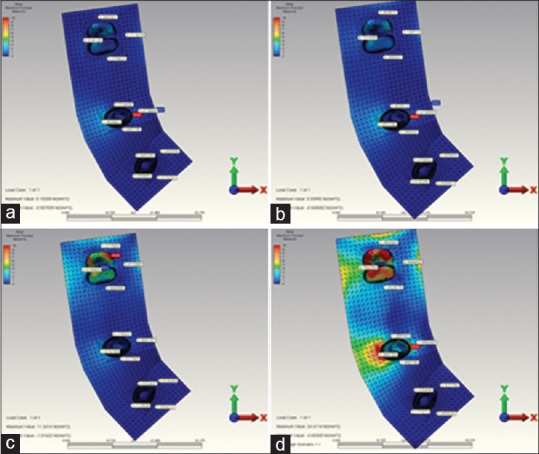
(a) When installing over the canine restoration, the highest maximum principal stress occurring in the in reference point in model 3. (b) When installing over the 2. premolar restoration, the highest maximum principal stress occurring in the in reference point in model 3. (c) When installing over the 2. molar restoration, the highest maximum principal stress occurring in the in reference point in model 3. (d) When installing over the complete restoration, the highest maximum principal stress occurring in the in reference point in model 3
The highest compression stress values occurring during the second premolar and molar loading in 5 unit tooth-supported model (model 3) [Figure 7a–d] were found to be less when compared to the highest compression stress values occurring during the second premolar and molar loading in 3 tooth-supported model (model 1) [Figure 6a–c and Table 4].
The highest compression stress came out in the open as a result of complete loading in 5 unit implant-supported model (model 4) [Figure 8a–d and Table 4].
Figure 8.
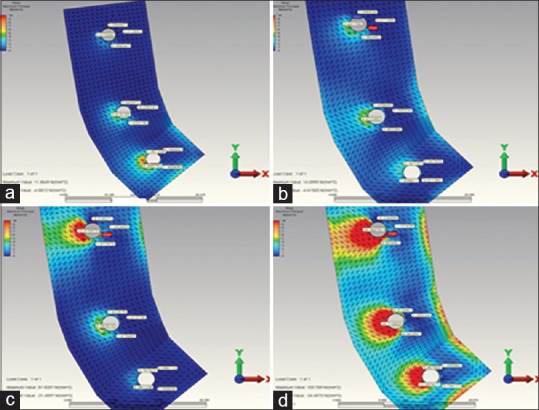
(a) When installing over the canine restoration, the highest maximum principal stress occurring in the in reference point in model 4. (b) When installing over the second premolar restoration, the highest maximum principal stress occurring in the in reference point in model 4. (c) When installing over the second molar restoration, the highest maximum principal stress occurring in the in reference point in model 4. (d) When installing over the complete restoration, the highest maximum principal stress occurring in the in reference point in model 4
The highest compression stress occurring in all loading individually made in abutment teeth and implants revealed on the bone surface of the root or surrounding of that support. Only 5 unit tooth-supported model (model 3) [Figure 7a–d] departs from this rule. In this model did the highest compression stress reveal as a result of canine loading. But the highest compression value revealed at the end of the canine loading was seen not on the canine tooth, but on the buccal root bone surface of the second premolar tooth [Table 4].
The highest compression stress occurred in model 1 [Figure 6a–c] (3 unit tooth-supported model) and model 3 (5 unit tooth-supported model) [Figure 7a–d] as a result of complete-loading came out in the bone surface of root surrounding of the second premolar tooth [Table 4]. In model 2 (3 tooth-supported model) [Figure 6a–c] and in model 4 (5 unit implant-supported model) [Figure 8a–d] was it seen on bone surface near the 2. molar implant [Table 4]. The highest compression stress revealed at the end of the second premolar loading was observed in 3 unit implant-supported model (model 2) [Figure 6d–f]. The highest compression stress revealed at the end of the 2. molar loading was observed in 3 (model 2) [Figure 6d–f] and 5 unit implant-supported model (model 4) [Figure 8a–d]. The highest compression stress revealed at the end of the canine loading was indicated in 5 unit implant-supported model (Model 4) [Figure 8a–d and Table 4].
DISCUSSION
The result obtained from the clinical and histomorphometric study is that bone loss occurred in the implant neck is an important parameter in implant loss during the postloading period.[29,30,31] A possible reason for this result is an uneven distribution of stress in the bone socket and exposure to maximum stress in the bone implant neck.[31] In this study, we aimed to compare the stress distribution on the perimplant bone tissues in dental and implant-supported fixed zirconia restorations by FEA. On the 4 models that laser-scanned and transferred to the computer, we aimed to observe the highest and the lowest stress values formed on the surrounding bone tissue and where they occurred. According to the results obtained from this study in which zirconia infrastructure is used, more stress accumulation occurs on implant-supported models than dental-supported ones in bone tissues. In addition to this in this study, according to literature, stress accumulation was found to be more in the neck region of implants on all implant-supported models, on tooth-supported models, stress accumulation was generally found to be more in the surrounding bone of the root.[29,30,31,32,33]
To perform stress analysis of living tissues like bones, teeth and periodontium using in vivo and in vitro methods is difficult; sometimes even impossible. For this reason, it is preferred to do stress analysis of living tissues by modeling by a number of programs on the computer. Finite element analysis is a very suitable method for stress analysis of structures with complex geometry.[29] In order to evaluate the stress occurring on all models in this study, FEA was used in compliance with literature. At the same time, there are some drawbacks for mathematical models. Mathematical models cannot simulate living tissues one to one. Mathematical models can be used only to explain experimental results, in science their predictive power is used for comparisons.[34,35]
Ismail et al.,[36] in their study to compare two and 3D finite element analysis using the blade implants, pointed out that 2D analysis did not reflect the normal stress distributions in details; but they were only sufficient when examined principal stress distributions. By taking this information into account, 3D finite element method was preferred in this study to obtain more realistic results and make more realistic modeling. Meijer et al.,[37] in their study, reported that 3D model of region examined could be sufficient and modeling the region studied on instead of modeling the entire lower jaw would be sufficient to take less time and be easier. For this reason in this study, we only used 3D image of what we want to examine instead of all the mandible.
Principal stresses (compressive and tensile stresses) values are used to evaluate the brittle materials such as bone. If the compression stress in bone is equal to or more than the highest compression stress, then failure occurs. For this reason, principal stress ensures to be able to carry out the evaluation by determining the difference between the tensile and compressive stresses. Von Mises stress values are used in the analysis of materials having metal-like flexible features. Hence, principal stresses were used in this study in the analysis of stress values available in bone.[38] While the highest tensile strength of the cortical bone was 121 Mpa, maximum compression strength was 167 Mpa.[39] In this study, when examined stress values occurring on bone, the highest tensile stress values were measured as 100,007 Mpa on bone surface between mesial and lingual of implant placed in the 2. molar region in case of loading over the entire structure in 5 unit implant-supported model. This value is lower than the highest tensile strength of bone. The highest compression stress values obtained were measured as 143,757 Mpa on the distal bone surface of the implant placed in the 2. molar area in case of loading over the entire structure in 5 unit implant-supported model. This value is lower than the maximum compression strength of bone. These results support the results of Zarb and Mericske-Stern's study reporting maximum occlusal forces to be below 300 N in the second premolars and below 200 N in the first premolars and molars in the patients treated with implant-supported fixed partial dentures.[40] 5- unit 3-implant-supported dentures can be used in clinics in terms of peri-implant bone health. In addition to this, less stress accumulation in other models in peri-implant and periodontal bones than 5 implant-supported model make us think that these models can be clinically used.
In this study, the highest stress values formed on the implant-supported models were found quite a lot when compared to the stress values formed on the tooth-supported models. This result is consistent with the literature.[32] The highest stress values formed on the 5 unit implant-supported model in all loadings in peri-implant tissues. The highest stress values formed in the bone in implant-supported models were typically measured in the cervical portion of the implants. In FEA studies on titanium implants, it is informed that stress intensity occurs in implant neck region.[29] This result accordance with the literature too.[29,30,32] Based on data in the literature, the forces on the implants is compensated by cortical bone.[30] In addition, dental implants are more inclined to excessive occlusal forces than the natural teeth. This results from a lack of an important part of periodontium like PDL that can absorb shock has touch sensitivity and is capable of proprioceptive feedback like the natural teeth in dental implants.[32] In the results we obtained from this study, less accumulation of stress in dental-supported prostheses than in implant-supported prostheses can be evaluated from this angle as in the literature. This showed that the stress spread through the root end due to PDL in the tooth. These results are consistent with studies in literature pointing out the difference between the teeth and implants.[32,33] In addition in this study stress in all implants under vertical loads were formed in high and variable amounts in peri-implant bone tissues. When compared to forces generated in the cancellous and cortical bone, forces occurring as a result of loading were found to be higher in the cortical bone in all implants. This indicates that the cortical bone has a majority of the force formed because of the high elastic modulus. But, cancellous bone compensates the forces occurred owing to low elastic modulus.[31,41] This may be a result emphasizing the importance of containing a certain amount of cancellous bone in cortical bone.
Rangert et al.,[42] in their study about the implant fractures of patients, they reported that %90 of implant fractures occurred on the posterior region, and these implants were those one or two implant-supported prostheses. Increased occlusal forces may both cause the loss of implants leading to crestal bone loss and cause the abutment and/or implant loss leading to loosening of the abutment and/or screw connection.[25,43] This study was carried out in the mandibular posterior region. The long-term success of dental implants was indicated to change depending on the presence of bacterial infection, protecting the quality of surrounding tissue bone and overload upon the bone and biomaterials interface.[2,22,44] The highest stress values in this study on 3- and 5-implant-supported models was found to occur in cervical parts of 47 and 45 number implants after loading all ones in peri-implant bone tissues. And then highest stress value in this study on 5-implant-supported model was found after loading all ones in 2. molar peri-implant bone tissues. And the highest stress values formed in 2. molar peri-implant bone tissues in 2. molar loading in 5 implant supported model. These results are consistent with the literature.[42]
According to this study, stress amount in periodontal bone tissues affecting abutment teeth on 5-unit fixed partial denture significantly contrary to the 3-unit fixed partial denture in the tooth-supported prosthetic model in second premolar and 2. molar loadings. This may indicate that an increase in the number of abutment teeth in 5-unit tooth-supported model can provide further stress compensation of masticatory forces on the restoration.[45] In addition, in the prosthesis with an implant-supported fixed partial denture, stress amount on abutment implants increased as the number of the unit increased unlike prosthesis with a tooth-supported fixed partial denture. The highest stress values formed on the 5 unit implant-supported model in all loadings in peri-implant tissues. And the highest stress values formed on the 3 unit implant-supported model in second premolar loadings in peri-implant tissues. This result is consistent with the studies pointing out that increased implant support would decrease stress on implants.[46,47,48] Many researchers put forward that reduction in the number of implants supporting prosthesis increases distribution of the forces occurring in the implant and surrounding tissues.[46,47,48] When evaluated from this point, for this study, increasing numbers of abutment implants may influence the long-term success of prosthesis in an implant-supported prosthesis made in the posterior region.
This study has some limitations:
In this study were not any other materials except for zirconia evaluated in all models
Only one implant model in this study could be analyzed in two different lengths implants in different lengths and diameters could not be assessed
In this study, two types of prosthetic options were evaluated in four different ways, but more prosthetic options were not evaluated in this study
The finite element models outlined here unfortunately cannot be able to omit all important features of living tissues. To be able to simulate all important features of living tissues, using in vivo studies will be able to give more successful results. And using magnetic resonance imaging scans to obtain geometric information will be better to estimate tissue conductivities.[49]
CONCLUSION
The highest values of tensile and compressive stress in the bone in tooth-supported models were seen on the bone surface surrounding the root. But in implant-supported models was it seen in cortical bone implant neck area near the top level of the bone. Bone loss seen in the neck area of the implant occurring as a result of oblique forces may affect the long-term implant success. The increased number of abutment implants may backup restorations to stay longer period in the mouth reducing the peri-implant bone loss on the long bridges in the posterior region exposed to the oblique forces. In addition to this, the increased number of abutment teeth in the restorations applied in posterior regions may backup restoration to stay longer period in the mouth leading to the homogeneous distribution of forces towards dentures.
Financial support and sponsorship
The Scientific Research Project Fund of Dicle University (DÜBAP) under the project number 09-DH-36.
Conflicts of interest
There are no conflicts of interest.
Acknowlegments
This work is supported by the Scientific Research Project Fund of Dicle University (DÜBAP) under the project number 09-DH-36. We thank Dr. Emre Ari for his helpful advice on the finite element analysis.
REFERENCES
- 1.Brånemark PI, Adell R, Breine U, Hansson BO, Lindström J, Ohlsson A. Intra-osseous anchorage of dental prostheses. I. Experimental studies. Scand J Plast Reconstr Surg. 1969;3:81–100. doi: 10.3109/02844316909036699. [DOI] [PubMed] [Google Scholar]
- 2.Moreira W, Hermann C, Pereira JT, Balbinoti JA, Tiossi R. A three-dimensional finite element study on the stress distribution pattern of two prosthetic abutments for external hexagon implants. Eur J Dent. 2013;7:484–91. doi: 10.4103/1305-7456.120642. [DOI] [PMC free article] [PubMed] [Google Scholar]
- 3.Christensen GJ. Ceramic vs. porcelain-fused-to-metal crowns: Give your patients a choice. J Am Dent Assoc. 1994;125:311–2. doi: 10.14219/jada.archive.1994.0027. 314. [DOI] [PubMed] [Google Scholar]
- 4.Malkoc MA, Sevimay M, Yaprak E. The use of zirconium and feldspathic porcelain in the management of the severely worn dentition: A case report. Eur J Dent. 2009;3:75–80. [PMC free article] [PubMed] [Google Scholar]
- 5.Vult von Steyern P, Carlson P, Nilner K. All-ceramic fixed partial dentures designed according to the DC-Zirkon technique. A 2-year clinical study. J Oral Rehabil. 2005;32:180–7. doi: 10.1111/j.1365-2842.2004.01437.x. [DOI] [PubMed] [Google Scholar]
- 6.Piwowarczyk A, Ottl P, Lauer HC, Kuretzky T. A clinical report and overview of scientific studies and clinical procedures conducted on the 3M ESPE Lava All-Ceramic System. J Prosthodont. 2005;14:39–45. doi: 10.1111/j.1532-849X.2005.00003.x. [DOI] [PubMed] [Google Scholar]
- 7.Studart AR, Filser F, Kocher P, Lüthy H, Gauckler LJ. Cyclic fatigue in water of veneer-framework composites for all-ceramic dental bridges. Dent Mater. 2007;23:177–85. doi: 10.1016/j.dental.2006.01.011. [DOI] [PubMed] [Google Scholar]
- 8.Rismanchian M, Shafiei S, Nourbakhshian F, Davoudi A. Flexural strengths of implant-supported zirconia based bridges in posterior regions. J Adv Prosthodont. 2014;6:346–50. doi: 10.4047/jap.2014.6.5.346. [DOI] [PMC free article] [PubMed] [Google Scholar]
- 9.Kelly JR, Denry I. Stabilized zirconia as a structural ceramic: An overview. Dent Mater. 2008;24:289–98. doi: 10.1016/j.dental.2007.05.005. [DOI] [PubMed] [Google Scholar]
- 10.Kobayashi K, Kuwajima H, Masaki T. Phase change and mechanical properties of ZrO2-Y2O3 solid electrolyte after aging. Solid State Ionics. 1981;3:489–95. [Google Scholar]
- 11.Sato TM. Transformation of yttria-doped tetragonal ZrO2 polycrystals by annealing in water. J Am Ceram Soc. 1985;68:356–9. [Google Scholar]
- 12.Sato T, Shimada M. Crystalline phase-change in yttria-partially stabilized zirconia by low-temperature annealing. J Am Ceram Soc. 1984;67:212–23. [Google Scholar]
- 13.Cales B, Stefani Y, Lilley E. Long-term in vivo and in vitro aging of a zirconia ceramic used in orthopaedy. J Biomed Mater Res. 1994;28:619–24. doi: 10.1002/jbm.820280512. [DOI] [PubMed] [Google Scholar]
- 14.Luo J, Ball RJ, Stevens R. Gadolinia doped ceria/yttria stabilised zirconia electrolytes for solid oxide fuel cell applications. J Mater Sci. 2004;39:235–40. [Google Scholar]
- 15.Heuer AH. Transformation toughening in ZrO2 - containing ceramics. J Am Ceram Soc. 1987;70:689–8. [Google Scholar]
- 16.Reidy DJ, Holmes JD, Morris MA. Preparation of a highly thermally stable titania anatase phase by addition of mixed zirconia and silica dopants. Ceram Int. 2006;32:235–9. [Google Scholar]
- 17.Kingery WD, Bowen HK, Uhlmann DR. 2nd ed. New York: Wiley and Sons; 1976. Introduction to Ceramics; p. 58. [Google Scholar]
- 18.Petrie CS, Williams JL. Comparative evaluation of implant designs: Influence of diameter, length, and taper on strains in the alveolar crest. A three-dimensional finite-element analysis. Clin Oral Implants Res. 2005;16:486–94. doi: 10.1111/j.1600-0501.2005.01132.x. [DOI] [PubMed] [Google Scholar]
- 19.Bozkaya D, Muftu S, Muftu A. Evaluation of load transfer characteristics of five different implants in compact bone at different load levels by finite elements analysis. J Prosthet Dent. 2004;92:523–30. doi: 10.1016/j.prosdent.2004.07.024. [DOI] [PubMed] [Google Scholar]
- 20.Chun HJ, Cheong SY, Han JH, Heo SJ, Chung JP, Rhyu IC, et al. Evaluation of design parameters of osseointegrated dental implants using finite element analysis. J Oral Rehabil. 2002;29:565–74. doi: 10.1046/j.1365-2842.2002.00891.x. [DOI] [PubMed] [Google Scholar]
- 21.Tada S, Stegaroiu R, Kitamura E, Miyakawa O, Kusakari H. Influence of implant design and bone quality on stress/strain distribution in bone around implants: A 3-dimensional finite element analysis. Int J Oral Maxillofac Implants. 2003;18:357–68. [PubMed] [Google Scholar]
- 22.Wheeler RC. Toronto: Harcourt, Canada; 1969. An Atlas of Tooth Form. [Google Scholar]
- 23.Heravi F, Salari S, Tanbakuchi B, Loh S, Amiri M. Effects of crown-root angle on stress distribution in the maxillary central incisors' PDL during application of intrusive and retraction forces: A three-dimensional finite element analysis. Prog Orthod. 2013:14–26. doi: 10.1186/2196-1042-14-26. [DOI] [PMC free article] [PubMed] [Google Scholar]
- 24.Covani U, Ricci M, Tonelli P, Barone A. An evaluation of new designs in implant-abutment connections: A finite element method assessment. Implant Dent. 2013;22:263–7. doi: 10.1097/ID.0b013e318292625f. [DOI] [PubMed] [Google Scholar]
- 25.Baggi L, Cappelloni I, Di Girolamo M, Maceri F, Vairo G. The influence of implant diameter and length on stress distribution of osseointegrated implants related to crestal bone geometry: A three-dimensional finite element analysis. J Prosthet Dent. 2008;100:422–31. doi: 10.1016/S0022-3913(08)60259-0. [DOI] [PubMed] [Google Scholar]
- 26.Ruse ND. Propagation of erroneous data for the modulus of elasticity of periodontal ligament and gutta percha in FEM/FEA papers: A story of broken links. Dent Mater. 2008;24:1717–9. doi: 10.1016/j.dental.2008.04.006. [DOI] [PubMed] [Google Scholar]
- 27.Iplikçioglu H, Akça K. Comparative evaluation of the effect of diameter, length and number of implants supporting three-unit fixed partial prostheses on stress distribution in the bone. J Dent. 2002;30:41–6. doi: 10.1016/s0300-5712(01)00057-4. [DOI] [PubMed] [Google Scholar]
- 28.I-Chiang C, Shyh-Yuan L, Ming-Chang W, Sun CW, Jiang CP. Finite element modelling of implant designs and cortical bone thickness on stress distribution in maxillary type IV bone. Comput Methods Biomech Biomed Engin. 2014;17:516–26. doi: 10.1080/10255842.2012.697556. [DOI] [PubMed] [Google Scholar]
- 29.Geng JP, Tan KB, Liu GR. Application of finite element analysis in implant dentistry: A review of the literature. J Prosthet Dent. 2001;85:585–98. doi: 10.1067/mpr.2001.115251. [DOI] [PubMed] [Google Scholar]
- 30.Wiskott HW, Belser UC. Lack of integration of smooth titanium surfaces: A working hypothesis based on strains generated in the surrounding bone. Clin Oral Implants Res. 1999;10:429–44. doi: 10.1034/j.1600-0501.1999.100601.x. [DOI] [PubMed] [Google Scholar]
- 31.Himmlová L, Dostálová T, Kácovský A, Konvicková S. Influence of implant length and diameter on stress distribution: A finite element analysis. J Prosthet Dent. 2004;91:20–5. doi: 10.1016/j.prosdent.2003.08.008. [DOI] [PubMed] [Google Scholar]
- 32.Koyano K, Esaki D. Occlusion on oral implants: Current clinical guidelines. J Oral Rehabil. 2015;42:153–61. doi: 10.1111/joor.12239. [DOI] [PubMed] [Google Scholar]
- 33.Svensson KG, Trulsson M. Impaired force control during food holding and biting in subjects with tooth- or implant-supported fixed prostheses. J Clin Periodontol. 2011;38:1137–46. doi: 10.1111/j.1600-051X.2011.01781.x. [DOI] [PubMed] [Google Scholar]
- 34.Adams MA. Mechanical testing of the spine. An appraisal of methodology, results, and conclusions. Spine (Phila Pa 1976) 1995;20:2151–6. doi: 10.1097/00007632-199510000-00015. [DOI] [PubMed] [Google Scholar]
- 35.Arkın H, Xu LX, Holmes KR. Recent developments in modeling heat transfer in blood perfused tissues. Biomed Eng. 1994;41:97–107. doi: 10.1109/10.284920. [DOI] [PubMed] [Google Scholar]
- 36.Ismail YH, Pahountis LN, Fleming JF. Comparison of two-dimensional and three-dimensional finite element analysis of a blade implant. Int J Oral Implantol. 1987;4:25–31. [PubMed] [Google Scholar]
- 37.Meijer HJ, Starmans FJ, Bosman F, Steen WH. A comparison of three finite element models of an edentulous mandible provided with implants. J Oral Rehabil. 1993;20:147–57. doi: 10.1111/j.1365-2842.1993.tb01598.x. [DOI] [PubMed] [Google Scholar]
- 38.Akça K, İplikçioğlu H. Finite element stress analysis of the influence of staggered versus straight placement of dental implants. Int J Oral Maxillofac Implants. 2001;16:722–30. [PubMed] [Google Scholar]
- 39.Brunski JB, Puleo DA, Nanci A. Biomaterials and biomechanics of oral and maxillofacial implants: Current status and future developments. Int J Oral Maxillofac Implants. 2000;15:15–46. [PubMed] [Google Scholar]
- 40.Mericske-Stern R, Zarb GA. In vivo measurements of some functional aspects with mandibular fixed prostheses supported by implants. Clin Oral Implants Res. 1996;7:153–61. doi: 10.1034/j.1600-0501.1996.070209.x. [DOI] [PubMed] [Google Scholar]
- 41.Yamanishi Y, Yamaguchi S, Imazato S, Nakano T, Yatani H. Influences of implant neck design and implant-abutment joint type on peri-implant bone stress and abutment micro movement: Three-dimensional finite element analysis. Dent Mater. 2012;28:1126–33. doi: 10.1016/j.dental.2012.07.160. [DOI] [PubMed] [Google Scholar]
- 42.Rangert B, Krogh PH, Langer B, Van Roekel N. Bending overload and implant fracture: A retrospective clinical analysis. Int J Oral Maxillofac Implants. 1995;10:326–34. [PubMed] [Google Scholar]
- 43.Misch CE. 3rd ed. St. Louis: Mosby Elsevier; 2008. Contemporaray Implant Dentisrty; p. 337. [Google Scholar]
- 44.Winkler S, Morris HF, Ochi S. Implant survival to 36 months as related to length and diameter. Ann Periodontol. 2000;5:22–31. doi: 10.1902/annals.2000.5.1.22. [DOI] [PubMed] [Google Scholar]
- 45.de Baat C, van Loveren C, van der Maarel-Wierink CD, Witter DJ, Creugers NH. Aftercare for durability and profitability of single-unit and multi-unit fixed dental prostheses. Ned Tijdschr Tandheelkd. 2013;120:411–20. [PubMed] [Google Scholar]
- 46.Ogawa T, Dhaliwal S, Naert I, Mine A, Kronstrom M, Sasaki K, et al. Impact of implant number, distribution and prosthesis material on loading on implants supporting fixed prostheses. J Oral Rehabil. 2010;37:525–31. doi: 10.1111/j.1365-2842.2010.02076.x. [DOI] [PubMed] [Google Scholar]
- 47.Sahin S, Cehreli MC, Yalçin E. The influence of functional forces on the biomechanics of implant-supported prostheses – A review. J Dent. 2002;30:271–82. doi: 10.1016/s0300-5712(02)00065-9. [DOI] [PubMed] [Google Scholar]
- 48.Duyck J, Van Oosterwyck H, Vander Sloten J, De Cooman M, Puers R, Naert I. Magnitude and distribution of occlusal forces on oral implants supporting fixed prostheses: An in vivo study. Clin Oral Implants Res. 2000;11:465–75. doi: 10.1034/j.1600-0501.2000.011005465.x. [DOI] [PubMed] [Google Scholar]
- 49.Yan Y, Nunez PL, Hart RT. Finite-element model of the human head: Scalp potentials due to dipole sources. Med Biol Eng Comput. 1991;29:475–81. doi: 10.1007/BF02442317. [DOI] [PubMed] [Google Scholar]


