Abstract
Objective:
The aim of the present study was to assess the expression of E-cad in oral precancerous lesions and conditions and oral carcinomas in comparison with normal mucosa.
Materials and Methods:
Total of 50 samples were selected for the study and were categorized into five groups and 10 samples in each group as Group I-oral leukoplakia (OL), Group II-oral lichen planus (OLP), Group III-oral submucous fibrosis (OSMF), Group IV-oral squamous cell carcinoma (OSCC) and Group V-normal oral mucosa (NOM) as control group. All the samples were assessed for the expression of E-cad by immunohistochemical study.
Results:
Upon assessing the expression of E-cad in OL, OSMF, OLP and OSCC, as majority of the samples with OSCC (90%), OL (80%), OLP (70%) and OSMF (60%) showed mild to moderate expression of E-cad staining, which was suggestive of reduction in dysplastic cells on comparison to NOM cells. This difference in expression and variation of E-cad upon comparison with normal mucosa was statistically significant (P < 0.001).
Conclusion:
There is significant (P < 0.001) variation of expression of E-cad with the histopathological dysplasia of the oral precancerous lesions and conditions, and the tumor differentiation of the oral cancers. However, there was no correlation of the degree of loss of expression of E-cad with the degree of dysplasia or the tumor differentiation of oral cancers. We conclude with our study that, there is a variation in the expression of E-cad but its value as a prognostic marker is questionable.
Keywords: E-cadherin, immunohistochemistry, oral carcinoma, oral precancerous lesions
INTRODUCTION
Oral cancer is the 11th most common cancer in the world, and death due to it ranks 6th globally.[1] In India, particularly it has the highest incidence of oral cancer globally and accounts for approximately 30–40% of all other cancers.[2] Most invasive oral carcinomas are generally preceded by preinvasive stage of oral precancerous lesions. Malignant transformation of oral leukoplakia (OL) is 1–20% over 1–30 years while oral lichen planus (OLP) and oral submucous fibrosis (OSMF) have malignant transformation of 0.2%/year and 7–13% respectively.[3]
Progression of these oral potentially malignant disorders to carcinoma is multi-stage process and is preprogrammed temporarily in the genome. Many molecular studies have explored a number of genes that are altered, amplified, dysregulated in expression or deleted in head and neck tumorigenesis.[4]
Beyond prevention, the quench for early detection of the lesion and its progression is necessary as it increases the possibility of favorable treatment outcome and better prognosis. Recently, various tumor markers have received more attention and one among them is cell to cell adhesion molecule, E-cadherin (E-cad), tumor suppressor gene that is expressed in epithelial tissues. E-cad, 120-kDa glycoprotein, a calcium-dependent cell-surface adhesion molecule that works as an intercellular adhesion molecule between epithelial cells and is also involved in the transduction of signals controlling various cellular events, including polarity, differentiation, growth and cell migration. In addition, E-cad has the ability to inhibit cell proliferation by up-regulating the p27 via epidermal growth factor receptor. Therefore, E-cad described as major growth or proliferation suppressor biomarker. It is encoded by the gene CDH1 located on chromosome 16q-22 and the loss in E-cad expression has been correlated with cancer progression.[4,5]
E-cadherin is also known to express in various carcinomas of head and neck, esophagus, prostrate, pancreas, stomach and uterine cervix and its reduced expression has been correlated with aggressive behavior, high proliferation, invasion, metastasis and poor prognosis of cancer.[6]
Several researchers hypothesized that E-cad expression is reduced with increase in grade of dysplasia. The reduced expression of E-cad may be a reliable indicator of increase in invasiveness of oral carcinomas. Therefore, it indicates the prognostic value during therapeutic intervention.[1,5] Therefore, the objective of the present study is to evaluate the expression of E-cad in oral precancerous lesions and oral carcinomas in comparison with normal oral mucosa (NOM) by immunohistochemical method, so as to unravel its role in progression and invasion of these conditions.
MATERIALS AND METHODS
Study setting
The study was conducted in the Department of Oral Medicine and Radiology, Sri Sai College of Dental Surgery, Vikarabad following the ethical committee clearance. A total sample size of 50 subjects was chosen, with study group consisting of 10 patients in each group diagnosed with OL, OSMF, OLP and oral squamous cell carcinoma (OSCC). The control group consisted of 10 individuals, without any systemic or oral condition. Any subject with systemic disease (e.g.: Diabetes mellitus, thyroid disorders and liver dysfunction) was excluded. Samples of these study groups were selected after the lesions were confirmed both clinically and histopathologically following informed consent of the patient. Clinically, all the samples of OL demonstrated homogenous type of leukoplakia, criteria proposed by WHO (1980),[7] the histological degree of epithelial dysplasia was based on the proportion of the height of the epithelial layer that presents the dysplastic changes with mild to severe dysplastic changes.[8] Clinicopathological criteria proposed by Kumar et al. were used for OSMF classification, all the subjects belong to stage 2 clinically.[9] In this present study, 6 subjects were of reticulate type of OLP, two were of atrophic type and two were of erosive type according to Andreasen et al. (1968),[10] and histopathological correlation was done according to Nippelberg et al.[11] Classification criteria as proposed by Robbins et al.[12] were considered for OSCC in which 2 subjects were well-differentiated, six were of moderately differentiated and remaining two were of poorly differientiated.
Expression of E-cad was done by immunohistochemistry, and antibodies and reagents used for immunohistochemistry technique were obtained from Envision kit, Dako, Denmark and Dako, Carpinteria, CA, (USA).
Primary antibody-mouse anti-human E-cad
Secondary antibody-anti-mouse IgG
Peroxidase block
Conjugate-horse radish peroxidase (HRP)
Chromogen substrate – Diaminobenzidine tetra hydrochloride (DAB).
Four micron thick sections were taken onto poly-L-lysine adhesive coated slides and incubated for 3 h at 50–60° centigrade and procedure of E-cad staining was performed following dewaxing and antigen retrieval procedure by immersing in 10 mM ethylenediaminetetraacetic acid. Following which dipped in freshly prepared 3% H2O2 for 10 min, to block endogenous peroxidase activity. The sections were then washed in Tris-wash buffer for two changes for 5 min each. Then sections were incubated with prediluted primary antibody E-cad (clone NCH-38, 1:200 dilution, Dako, Carpinteria, CA, USA) at room temperature for 24 h in a humid chamber. Sections were then washed in Tris-wash buffer thoroughly for 2–4 min. Super enhancer of the secondary antibody was added for 30 min and then washed in Tris-wash buffer thoroughly for 2–4 min. Then DAB (1 drop) + wash buffer (1 ml) was added for 10 min. For visualization, sections were incubated with HRP for 15 min. The sections were then lightly counterstained using Mayer's hematoxylin for 10 s, after which sections were gently washed in running tap water for 60 s. Mounting was done in DPX mounting media (glycerol).
Evaluation of the staining for E-cadherin
Assessment of E-cad positive cells was performed using double headed light microscope at ×10 and ×40. The criteria used to define E-cad antigen positive cells were brown staining in dysplastic cell membrane; the pattern was described as normal when staining was exclusively membranous and of similar intensity to adjacent normal epithelium. Abnormal staining included discontinuous or absent membranous staining, with or without cytoplasmic staining. Presence of immunostaining in the cell membrane of various layers of epithelium was evaluated in randomized six fields/intensity of positively stained cells as percentage expression at 40x and graded as 0 (under 10% positively stained cells), 1+ (10–25% positively stained cells: Weak expression), 2+ (25–50% positively stained cells: Mild to moderate expression), 3+ (50–75% positive cells: Moderate to strong expression) and 4+ (over 75% of intensity of positively stained cells: Very strong expression). The current grading criteria were chosen as defined by Simionescu et al.[13] in their study, as grade of dysplasia increased, expression of E-cad was reduced in OSCC patients.
Statistical analysis
The expression of E-cad was interpreted by an experienced pathologist who was blinded as to which group the patient belonged, to eliminate bias. Interpretation of E-cad expression was done by two independent observers, and the results were tabulated. The inter-examiner reliability in recording expression of E-cad was found to be 0.96 (intraclass correlation coefficient) implying a good agreement between the two observers. Hence, the study was preceded with a single examiner.
Following the tabulation of the data, all calculations were performed using IBM SPSS Statistical Software Package (SPSS 14.0 for Windows, SPSS Inc., Chicago, IL, USA). The obtained data were analyzed by Pearson Chi-square test. The P < 0.05 was considered to be statistically significant.
RESULTS
The data obtained from the study were compiled, tabulated and subjected to statistical analysis. The results that were obtained are presented in the following manner:
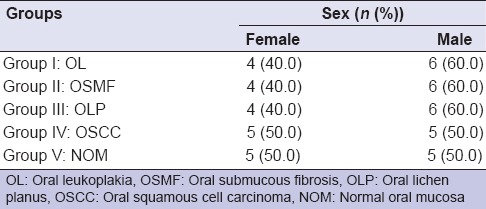
Table 1 shows the general information of sex-wise distribution in the five groups. Each group consisted of 10 subjects, which comprised of 6 (60%) males and 4 (40%) females in OL group, OLP group and OSMF group whereas in OSCC group and control group, it comprised of 5 males (50%) and 5 females (50%) [Graph 1].
Table 1.
Sex-wise distribution of the groups
Graph 1.
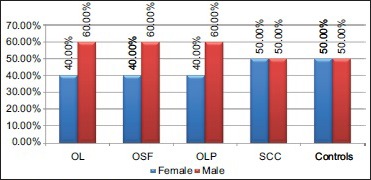
Sex-Wise distribution of the groups
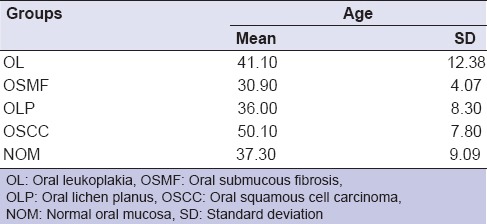
Table 2 shows the general age distribution of all five groups. The age range for all the five groups ranged from 20 to 60 years. The mean age and standard deviation (SD) of OL was 41.10 ± 12.38, in OSMF 30.90 ± 4.07, in OLP 36.00 ± 8.30, in OSCC 50.10 ± 7.80 and in control group 37.30 ± 9.09 [Graph 2].
Table 2.
Age-wise distribution of the groups
Graph 2.
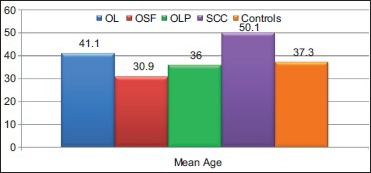
Mean age
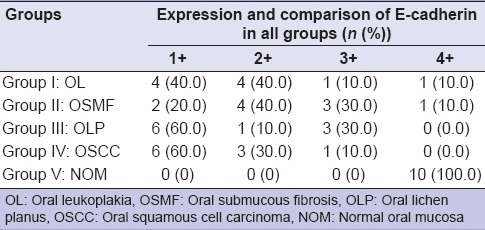
Expression of E-cadherin in normal tissue [Table 3, Graph 3]
Table 3.
Expression of E-cadherin in OL, OSF, OLP, OSCC and normal tissue [Graph 3]
Graph 3.
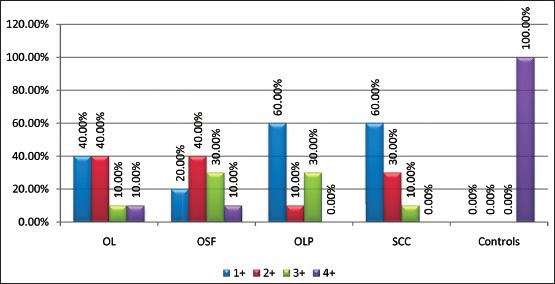
Expression and comparison of E-cadherin in all groups
All 10 subjects of normal tissue expressed 4+ (very strong expression). Intense staining of E-cad is seen in the spinous layer and basal cell layer, but not at the basal surface of basal cells and superficial layer as a phenomenon of natural desquamation.
Expression of E-cadherin in oral leukoplakia [Table 3, Graph 3]
In 10 subjects of leukoplakia group (all of were homogenous type), 4 subjects scored as 1+ (weak expression), 4 subjects showed as 2+ (mild to moderate expression), 1 subject scored as 3+ (moderate to strong expression) and remaining 1 subject scored as 4+ (very strong expression) [Figures 1 and 2].
Figure 1.
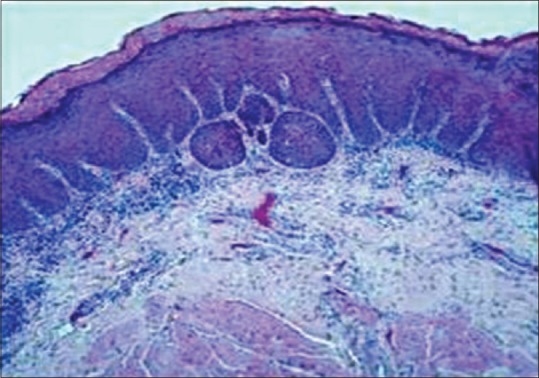
Histopathological expression of oral leukoplakia using H and E, ×10
Figure 2.

Immunohistochemical expression of E-cadherin in oral leukoplakia at, ×40
In 10 subjects of OL, 50% of lesion showed mild dysplasia, of which 1 subject scored as 4+ (very strong expression), 3 subjects scored as 2+ (mild to moderate expression) and remaining 1 subject showed as 1+ (weak expression). About 30% of lesions showed moderate dysplasia, in which 1 subject scored as 3+ (moderate to strong expression) and 2 subjects scored as 1+ (weak expression). Remaining 20% of lesions showed severe dysplasia, in which 1 subject scored as 2+ (mild to moderate expression) and another scored as 1+ (weak expression).
Expression of E-cadherin in oral submucous fibrosis [Table 3, Graph 3]
In 10 subjects of OSMF group (all of were stage 2), 2 subjects (20%) scored as 1+ (weak expression), 4 subjects (40%) scored as 2+ (mild to moderate expression), 3 subjects (30%) scored as 3+ (moderate to strong expression) and remaining 1 (10%) subject showed as 4+ (very strong expression) [Figures 3 and 4].
Figure 3.

Histopathological expression of oral submucous fibrosis using H and E, ×10
Figure 4.
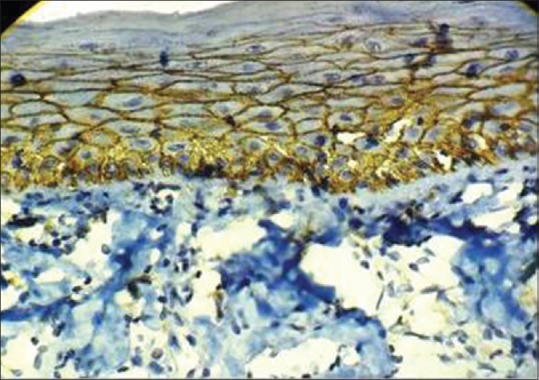
Immunohistochemical expression of E-cadherin in oral submucous fibrosis at, ×40
Of 10 OSMF subjects, 5 (50%) subjects showed mild stage histopathologically, in which 1 subject scored as 1+ (weak expression), 3 subjects showed as 2+ (mild to moderate expression) and 1 subject scored as 4+ (strong expression) and remaining 5 (50%) subjects showed moderate stage, in which 1 subject showed as 1+ (weak expression), 1 subject showed as 2+ (mild to moderate expression) and other 3 subjects scored as 3+ (moderate to strong expression).
Expression of E-cadherin in oral lichen planus [Table 3, Graph 3]
In 10 subjects of OLP group, 6 subjects (60%) showed 1+ (weak expression), 1 subjects (10%) scored as 2+ (mild to moderate expression) and remaining 3 subjects (30%) scored as 3+ (moderate to strong expression) [Figures 5 and 6].
Figure 5.

Histopathological expression of oral lichen planus using H and E, ×10
Figure 6.
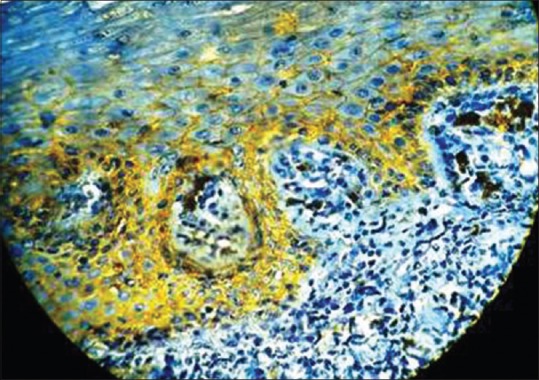
Immunohistochemical expression of E-cadherin in oral lichen planus at, ×40
In correlation with clinical types, of 6 reticular types of OLP, 3 subjects (30%) scored as 3+ (moderate to strong expression), 1 subject (10%) scored as 2+ (mild to moderate expression) and 2 subjects (20%) showed 1+ (weak expression). Of the remaining 4 subjects, 2 subjects demonstrated atrophic type and 2 subjects as erosive type, both types expressed as 1+ (weak expression).
Expression of E-cadherin in oral squamous cell carcinoma [Table 3, Graph 3]
In 10 subjects of OSCC group, 6 subjects (60%) scored as 1+ (weak expression), 3 subjects (30%) scored as 2+ (mild to moderate expression) and remaining 1 subject (10%) scored as 3+ (moderate to strong expression) [Figures 7 and 8].
Figure 7.
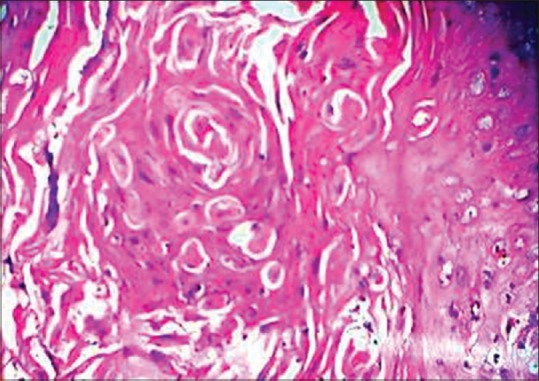
Histopathological expression of oral squamous cell carcinoma using H and E, ×40
Figure 8.
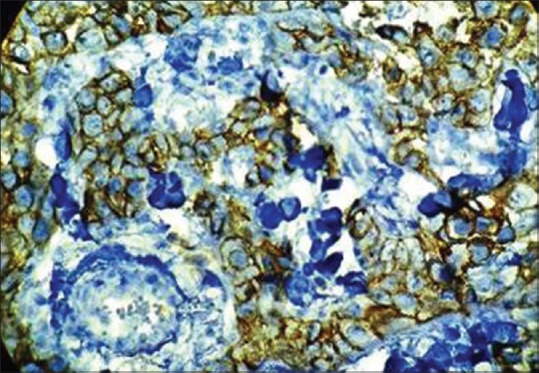
Immunohistochemical expression of E-cadherin in oral squamous cell carcinoma at, ×40
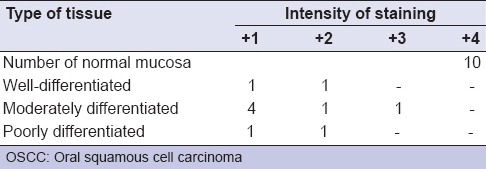
Among 10 subjects of OSCC, 6 (60%) subjects showed moderately differentiated OSCC in which 4 subjects scored as 1+ (weak expression), 1 subject showed as 2+ (mild to moderate expression), 1 subject showed as 3+ (moderate to strong expression). About 20% of OSCC are of well-differentiated and another 20% are of poorly differentiated carcinoma in which 1 subject scored as 1+ (weak expression) and 1 subject scored as 2+ (mild to moderate expression).
Altogether, majority of the subjects with OSCC (n = 90%) and OLP (n = 80%) had grade 1+ expression, while majority of OL (n = 70%) scored 1+ and 2+ expression and majority of OSMF (n = 60%) scored 2+ expression. All the controls showed 4 + expression. This difference in expression of E-cad was statistically significant in comparison with normal control groups with P ≤ 0.001.
DISCUSSION
The shift in cancer research from the histopathological to the molecular and genetic levels was brought about by many new technologies, one among them is immunohistochemical study and is believed that understanding the molecular basis of cancer will lead to precise diagnosis and better treatment.[14]
In the oral mucosa, epithelium shows adaption to different mechanical demands and maintains its structure by a process of continuous cell renewal and a lot of factors are involved in maintaining the balance between proliferation and differentiation. One among them is E-cad, localized on the surface of epithelial cells in regions of cell-cell contact known as adherens junctions and regulates the cell aggregations. E-cad is also involved in transduction of signals controlling various cellular events, including polarity, differentiation, growth and cellular migration. In normal epithelium, E-cad is expressed in spinous and basal layer expect for the basal surface of the basal layers and superficial layers as a process of continuous renewal of cells.[15]
Oral cancer is the most prevalent group of malignancies in Indian subcontinent and the development of it is a multistep process, where in involving interactions between several factors such as tobacco-associated carcinogens, areca nut, betel quid and alcohol consumption, and/or viral infections and is a multi-stage process which requires modulation of cell-cell and cell-stromal interactions. Loss of E-cad expression has been noted with poorly differentiated morphology in a large number of malignancies such as cervix, esophagus, including head and neck.[16]
Hence, the present study was conducted to assess the expression of E-cad in OL, OSMF, OLP and OSCC patients in comparison to NOM by immunohistochemistry.
In the present study, 10 samples of NOM as control group were taken with average mean age and SD of 37.30 ± 9.09. All of them have expressed 4+ (very strong expression). These control tissues showed intense continuous membranous staining of E-cad in all the epithelial cells of spinous layer and to less extent staining is seen in basal cells and less staining or complete absence in superficial layers of cells which is suggestive of normal desquamation.
The present study group consists of 10 OL samples. Of 10 OL samples, 6 males (60%) and 4 females (40%) were present. This was consistent with the reported annual age incidence rate of 2.1/1000 in men and 1.3/1000 in women by Rajendran and Shivapathasundaram[17] in their study.
Most of the previous studies on OL were also of the opinion that the common site of occurrence is buccal mucosa 76%, then alveolar sulcus 19% followed by tongue 5% by Raina et al.,[18] which is consistent to our present study where 9 subjects (90%) of OL lesion are on buccal mucosa; of these, majority of the subjects that is, 40% showed 2+ (mild to moderate expression). Remaining 1 subject (10%) are on tongue that expressed as 1+ (weak expression).
In the present study, all the samples were of homogenous type of leukoplakia, with showing mild to severe dysplastic changes. These samples, as shown in Table 3a, inferences that, there is no significant association between the degree of dysplasia with down-regulation of E-cad expression. This observation of our study was not consistent to various previous studies conducted by Yuwanati et al., Chaw et al.[19,20] who concluded that, reduction in the E-cad expression was seen as the degree of dysplasia increases from mild to severe, as the severity increases.
Table 3a.
Staining intensities of E-cadherin expression between normal and different subgroups of leukoplakia

Overall, the majority of subjects in OL group (n = 80%) showed weak and mild membranous staining of E-cad in suprabasal and spinous layer of cells as shown in Table 3. Hence, there is a reduction in E-cad expression in dysplastic layers of OL. This observation of our study was consistent with the studies conducted by Yogesh et al., Kaur et al.[16,21] who stated that atypical features of dysplasia are strongly correlated to the loss of expression of E-cad.
Yogesh et al.[16] in his study also explained that, there is a variation in the expression of E-cad in the dysplastic epithelium with varying degrees of dysplasia or severity of dysplasia and location of tissue, would suggest that these alterations are the result of the progression of dysplasia and could be a late event, which is suggestive of change toward a cell phenotype with the ability to invade. These explanations are in accordance with our observation in OL group.
The present study consists of 10 OSMF samples in one group. All of the subjects of this group belong to the mean average age with SD of 30.90 ± 4.07, which is in contrast to the previous studies which say that it is a disease of adulthood between the ages of 45–60 years. The possible reason for OSMF occurring at young age could be that the patients were exposed to the irritants from a very young age. This is in accordance with previous studies by Ganapathy et al.,[22] according to them, the mean age is around 30 years.
Of 10 OSMF samples, all the subjects were demonstrated as stage 2 clinically and histopathologically, 50% samples showed mild stage of OSMF in which majority of samples showed mild to moderate expression that scored as 2+ and remaining 50% showed moderate stage, in which majority of the samples showed moderate to strong expression that scored as 3+ as shown in Table 3b. In our study, as in shown Table 3, altogether majority of OSMF samples (n = 60%) showed reduced expression of E-cad with mild to moderate intensity. This finding of our study was consistent with the study conducted by Das et al.[1]
Table 3b.
Staining intensities of E-cadherin expression between normal and different stages of OSMF

The present study consists of 10 OLP samples. Of 10 OLP samples, 6 were males (60%) and 4 were females (40%). In this present study, 6 (60%) of the 10 subjects were of reticulate type, which is the most common type to occur according to many previous studies, 2 (20%) were of atrophic type and 2 (20%) were of erosive type.[4] Buccal mucosa is the most common site for OLP followed by tongue, gingiva that is in consistent with our study where 60% are on buccal mucosa, 20% are on tongue and 20% are on gingiva.
In 10 samples of OLP group, with respect to clinical types, of 6 reticular types of OLP, 3 subjects (30%) scored as 3+ (moderate to strong expression), 1 subject (10%) scored as 2+ (mild to moderate expression) and 2 subjects (20%) showed 1+ (weak expression). Of remaining 4 subjects, 2 subjects demonstrated atrophic type and 2 subjects as erosive type, both types expressed as 1+ (weak expression). As a whole, majority of our OLP samples (n = 70%) as in Table 3 showed reduced or weak expression of E-cad in basal and suprabasal layer of cells, which is in accordance to study conducted by Neppelberg et al.,[11] who stated that, focal loss of E-cad in basal keratinocytes may contribute to loss of cell-to-cell contacts and destruction of basal keratinocytes and thus, this may play a role in the pathogenesis of OLP and also concluded in his another study (2007)[23] that E-cad were not significant sensitive markers to select OLP lesions at risk for development of OSCC.
In another study that was conducted by Ebrahimi et al.,[24] also showed decreased expression of E-cad, this finding is consistent with our findings. The author concluded with their study that, mixed expression pattern of OLP with variably resembling normal as well as tumor tissue and also with the previous data that, it cannot be judged whether OLP lesions are at an increased risk of malignant development.
The present study consists of 10 OSCC samples and of these samples, 5 (50%) were males and 5 (50%) were females.
Among 10 samples of OSCC, majority of samples as shown in Table 3c that has shown no significant association between the degree of differentiation of tumor and expression of E-cad. This observation of our study was consistent with the study conducted by Shinohara et al., Diniz-Freitas et al.,[25,26] whose studies also showed no significant association between the degree of differentiation of tumor and expression of E-cad.
Table 3c.
Staining intensities of E-cadherin expression between normal and different stages of OSCC
Of 10 samples of OSCC groups, altogether majority of samples (n = 90%) showed mild to moderate expression, these observation of our study suggest that, there was overall reduction or lost membranous expression of E-cad in the deep invasive tumor margin of primary tumor. A study conducted by Hung et al.,[27] concluded that immunoreactivity of E-cad was progressively reduced from normal mucosa followed by oral precancerous lesions and significantly decreased in primary OSCC (58%), which was also coinciding with our findings of E-cad expression.
Upon assessing the expression of E-cad in OL, OSMF, OLP and OSCC, as majority of the samples with OSCC (90%), OL (80%), OLP (70%) and OSMF (60%) samples showed mild to moderate expression of E-cad staining, which was suggestive of reduction in dysplastic cells on comparison to NOM cells. This difference in expression and variation of E-cad upon comparison with normal mucosa was statistically significant (P < 0.001).
CONCLUSION
Within the limitation of the study, it could be concluded that there was significant variation of expression of E-cad with the histopathological dysplasia of the oral precancerous lesions and the tumor differentiation of the oral cancers in comparison with NOM. However, there was no correlation of the degree of loss of expression of E-cad with the degree of dysplasia or the tumor differentiation of oral cancers.
Since, there was a variation in the expression of E-cad, but its value as a prognostic marker is questionable. A longitudinal study with more sample size is required to confirm this conclusion.
Footnotes
Source of Support: Nil.
Conflict of Interest: None declared
REFERENCES
- 1.Das RK, Pal M, Barui A, Paul RR, Chakraborty C, Ray AK, et al. Assessment of malignant potential of oral submucous fibrosis through evaluation of p63, E-cadherin and CD105 expression. J Clin Pathol. 2010;63:894–9. doi: 10.1136/jcp.2010.078964. [DOI] [PubMed] [Google Scholar]
- 2.Narayan S. Oral cancer in India: An epidemiologic and clinical review. Oral Surg Oral Med Oral Pathol. 1990;69:325–30. doi: 10.1016/0030-4220(90)90294-3. [DOI] [PubMed] [Google Scholar]
- 3.Greenberg MS, Glick M. 11th ed. Hamilton: BC Decker Inc; 2008. Burket's Oral Medicine. [Google Scholar]
- 4.Jankowski JA, Bruton R, Shepherd N, Sanders SA. Cadherin and catenin biology represents a global mechanism for epithelial cancer mechanism. J Clin Pathol Mol Pathol. 1997;50:289–90. doi: 10.1136/mp.50.6.289. [DOI] [PMC free article] [PubMed] [Google Scholar]
- 5.Wijnhoven BP, Dinjens WN, Pignatelli M. E-cadherin-catenin cell-cell adhesion complex and human cancer. Br J Surg. 2000;87:992–1005. doi: 10.1046/j.1365-2168.2000.01513.x. [DOI] [PubMed] [Google Scholar]
- 6.Lipponen P, Saarelainen E, Ji H, Aaltomaa S, Syrjänen K. Expression of E-cadherin (E-CD) as related to other prognostic factors and survival in breast cancer. J Pathol. 1994;174:101–9. doi: 10.1002/path.1711740206. [DOI] [PubMed] [Google Scholar]
- 7.Rajendran R. Oral leukoplakia. J Oral Maxillofac Pathol. 2004;8:58–68. [Google Scholar]
- 8.van der Waal I. Potentially malignant disorders of the oral and oro-pharyngeal mucosa; terminology, classification and present concepts of management. Oral Oncol. 2009;45:317–23. doi: 10.1016/j.oraloncology.2008.05.016. [DOI] [PubMed] [Google Scholar]
- 9.Kiran Kumar K, Saraswathi TR, Ranganathan K, Uma Devi M, Elizabeth J. Oral submucous fibrosis: A clinico-histopathological study in Chennai. Indian J Dent Res. 2007;18:106–11. doi: 10.4103/0970-9290.33785. [DOI] [PubMed] [Google Scholar]
- 10.Andreasen JO. Oral lichen planus.1. A clinical evaluation of 115 cases. Oral Surg Oral Med Oral Pathol. 1968;25:31–42. doi: 10.1016/0030-4220(68)90194-1. [DOI] [PubMed] [Google Scholar]
- 11.Neppelberg E, Loro LL, Oijordsbakken G, Johannessen AC. Altered CD40 and E-cadherin expression – Putative role in oral lichen planus. J Oral Pathol Med. 2007;36:153–60. doi: 10.1111/j.1600-0714.2007.00511.x. [DOI] [PubMed] [Google Scholar]
- 12.Robbins SL, Kumar V, Cotran RS. Basic Pathology. 7th ed. Philadelphia, U.S: Elsevier Publications; 2003. pp. 165–211. [Google Scholar]
- 13.Simionescu C, Margaritescu C, Surpateanu M, Mogoanta L, Zavoi R, Ciurea R, et al. The study of E-cadherine and CD44 immunoexpression in oral squamous cell carcinoma. Rom J Morphol Embryol. 2008;49:189–93. [PubMed] [Google Scholar]
- 14.Gibbons MD, Manne U, Carroll WR, Peters GE, Weiss HL, Grizzle WE. Molecular differences in mucoepidermoid carcinoma and adenoid cystic carcinoma of the major salivary glands. Laryngoscope. 2001;111:1373–8. doi: 10.1097/00005537-200108000-00011. [DOI] [PubMed] [Google Scholar]
- 15.Downer CS, Speight PM. E-cadherin expression in normal, hyperplastic and malignant oral epithelium. Eur J Cancer B Oral Oncol. 1993;29B:303–5. doi: 10.1016/0964-1955(93)90053-h. [DOI] [PubMed] [Google Scholar]
- 16.Yogesh T, Narayan T, Shreedhar B, Shashidara R, Leekymohanty The expression of E-cadherin and cathepsin-D in normal oral mucosa, oral epithelial dysplasia and oral squamous cell carcinoma: A comparative analysis between immunohistochemistry and routine histopathology. J Oral Maxillofac Pathol. 2011;15:288–94. doi: 10.4103/0973-029X.86689. [DOI] [PMC free article] [PubMed] [Google Scholar]
- 17.Rajendran R, Shivapathasundaram B, editors. Shafer's Textbook of Oral Pathology. 5th ed. New Delhi, India: Reed Elsevier India; 2006. [Google Scholar]
- 18.Raina C, Raizada RM, Chaturvedi VN, Harinath BC, Puttewar MP, Kennedy AK. Clinical profile and serum beta-carotene levels in oral submucous fibrosis. Indian J Otolaryngol Head Neck Surg. 2005;57:191–5. doi: 10.1007/BF03008011. [DOI] [PMC free article] [PubMed] [Google Scholar]
- 19.Yuwanati MB, Tupkari JV, Avadhani A. Expression of E-cadherin in oral epithelial dysplasia and oral squamous cell carcinoma: An in vivo study. J Clin Exp Invest. 2011;2:347–53. [Google Scholar]
- 20.Chaw SY, Majeed AA, Dalley AJ, Chan A, Stein S, Farah CS. Epithelial to mesenchymal transition (EMT) biomarkers – E-cadherin, beta-catenin, APC and Vimentin – In oral squamous cell carcinogenesis and transformation. Oral Oncol. 2012;48:997–1006. doi: 10.1016/j.oraloncology.2012.05.011. [DOI] [PubMed] [Google Scholar]
- 21.Kaur J, Sawhney M, DattaGupta S, Shukla NK, Srivastava A, Walfish PG, et al. Clinical significance of altered expression of ß-catenin and E-cadherin in oral dysplasia and cancer: Potential link with ALCAM expression. PLoS One. 2013:8–e67361. doi: 10.1371/journal.pone.0067361. [DOI] [PMC free article] [PubMed] [Google Scholar]
- 22.Ganapathy KS, Gurudath S, Balikai B, Ballal S, Sujatha D. Role of iron deficiency in oral submucous fibrosis: An initiating or accelerating factor. J Indian Acad Oral Med Radiol. 2011;23:25–8. [Google Scholar]
- 23.Neppelberg E, Johannessen AC. DNA content and Cyclooxygenase-2 as risk markers of cancer development in oral lichen planus. Eur Arch Otorhinolaryngol. 2007;264:1223–30. doi: 10.1007/s00405-007-0346-5. [DOI] [PubMed] [Google Scholar]
- 24.Ebrahimi M, Boldrup L, Wahlin YB, Coates PJ, Nylander K. Decreased expression of the p63 related proteins beta-catenin, E-cadherin and EGFR in oral lichen planus. Oral Oncol. 2008;44:634–8. doi: 10.1016/j.oraloncology.2007.08.001. [DOI] [PubMed] [Google Scholar]
- 25.Shinohara M, Hiraki A, Ikebe T, Nakamura S, Kurahara S, Shirasuna K, et al. Immunohistochemical study of desmosomes in oral squamous cell carcinoma: Correlation with cytokeratin and E-cadherin staining, and with tumour behaviour. J Pathol. 1998;184:369–81. doi: 10.1002/(SICI)1096-9896(199804)184:4<369::AID-PATH1236>3.0.CO;2-L. [DOI] [PubMed] [Google Scholar]
- 26.Diniz-Freitas M, García-Caballero T, Antúnez-López J, Gándara-Rey JM, García-García A. Reduced E-cadherin expression is an indicator of unfavourable prognosis in oral squamous cell carcinoma. Oral Oncol. 2006;42:190–200. doi: 10.1016/j.oraloncology.2005.07.010. [DOI] [PubMed] [Google Scholar]
- 27.Hung KF, Chang CS, Liu CJ, Lui MT, Cheng CY, Kao SY. Differential expression of E-cadherin in metastatic lesions comparing to primary oral squamous cell carcinoma. J Oral Pathol Med. 2006;35:589–94. doi: 10.1111/j.1600-0714.2006.00474.x. [DOI] [PubMed] [Google Scholar]


