

Abstract
Context:
African Americans have a lower total serum 25-hydroxyvitamin D [25(OH)D] but superior bone health. This has been referred to as a paradox. A recent publication found that free serum 25(OH)D is the same in black and white individuals. However, the study was criticized because an indirect method was used to measure free 25(OH)D. A direct method has recently been developed.
Objective:
We hypothesized that although total serum 25(OH)D is lower in African Americans, free serum 25(OH)D measured directly would not differ between races.
Design:
White and black healthy postmenopausal women were matched for age and body mass index. Serum total 25(OH)D, PTH, 1,25-dihydroxyvitamin D, vitamin D binding protein (VDBP), and bone density were measured. Measurement of free 25(OH)D was carried out using an ELISA.
Setting:
The study was conducted at an ambulatory research unit in a teaching hospital.
Outcome:
A cross-racial comparison of serum free 25(OH)D was performed.
Results:
A propensity match resulted in the selection of a total of 164 women. Total 25(OH)D was lower in black women (19.5 ± 4.7 vs 26.9 ± 6.4 ng/mL), but a direct measurement of free 25(OH)D revealed almost identical values (5.25 ± 1.2 vs 5.25 ± 1.3 ng/mL) between races. VDBP was significantly lower in blacks when using a monoclonal-based ELISA but higher with a polyclonal-based ELISA. Serum PTH, 1,25-dihydroxyvitamin D, and bone density were higher in African Americans.
Conclusions:
Free serum 25(OH)D is the same across races despite the lower total serum 25(OH)D in black women. Results comparing VDBP between races using a monoclonal vs a polyclonal assay were discordant.
Americans of African descent have lower levels of serum 25-hydroxyvitamin D [25(OH)D] than European-Americans throughout life (1). The lower levels are believed to be due to reduced absorption of UV light in the melanin-rich skin of black individuals and therefore a reduced ability to generate vitamin D (2). However, despite the lower total serum 25(OH)D (the accepted biomarker of vitamin D nutritional status) African Americans have superior bone health (3–5). Their bone mass is higher from early childhood and increases dramatically during adolescence (6). Most importantly the fracture rate in elderly African American women is only half that of white American women (7). The dichotomy between a low serum 25(OH)D (which is believed to be a risk factor for poor bone health) and the presence of superior bone health in African Americans has been referred to as a paradox (8).
Recently a study of vitamin D-binding protein (VDBP) appeared to offer a partial explanation of the paradox (9). 25(OH)D is synthesized from vitamin D in the liver and is a prohormone. The active hormone, 1,25-dihydroxyvitamin D [1,25(OH)2D], is formed by further hydroxylation in the kidney and is released into the circulation or it may be synthesized within some cells from 25(OH)D. Serum 25(OH)D is transported in blood attached to a protein, VDBP (10). Most serum 25OHD is believed to be transported by VDBP (88%) or albumin (12%), but a small percentage (<1%) is unattached to plasma proteins: free 25(OH)D. It has been proposed that the free 25(OH)D may enter cells to be converted to 1,25(OH)2D, the free hormone hypothesis (11). VDBP may provide a reservoir for serum 25(OH)D: the role of VDBP is believed to be to limit the availability of free 25(OH)D to cells by prolonging the half-life of 25(OH)D.
Powe et al (9) indirectly estimated free 25(OH)D and bioavailable 25(OH)D [the 25(OH)D attached to albumin plus the unbound or free 25(OH)D]. Their estimates suggested that although serum total 25(OH)D was lower in black Americans, their bioavailable 25(OH)D was the same as white Americans. If free 25(OH)D was the same in both races, this could potentially explain the paradox whereby low total 25(OH)D did not adversely affect bone health in African Americans. Powe and others have also elucidated the genetic polymorphisms that may result in lower VDBP in African Americans (9).
There were a number of criticisms of the study by Powe et al including the indirect method to estimate free 25(OH)D used in the study including the assay used to measure VDBP (12–14). The recent availability of a direct method to measure free 25(OH)D led us to compare African Americans to European Americans to answer the question: is free 25(OH)D when measured with a direct assay lower or the same in African Americans compared with European Americans? In addition, we asked how the concentration of total 25(OH)D was related to VDBP and how the total and free 25(OH)D related to biomarkers of vitamin D action.
Materials and Methods
Statistical analysis
Data were gathered from the four clinical trials, three previously conducted by the Winthrop Bone Mineral Research Center from 2008 until the present time and one ongoing (8, 15–17). We used the propensity score-matching technique to get a one-to-one match for black and white participants based on age and body mass index (BMI). This technique resulted in 82 blacks and 82 whites, a total of 164 patients. Propensity score matching entails forming matched sets of study and control subjects who share a similar value of the propensity score (18).
Using the affinity constant Kalb = 6 × 10⁵ M−1 between 25(OH)D and albumin suggested by Powe et al (9), we computed the concentration of albumin-bound 25(OH)D which was then added to free 25(OH)D to get bioavailable 25(OH)D. To calculate total 25(OH)D, we additionally calculated VDBP, which was a function of 25(OH)D, the affinity constant for albumin, and free 25(OH)D. The mathematical forms of the calculations are as follows:
Descriptive statistics (ie, mean, SD, median, interquartile range) of continuous clinical covariates, laboratory markers, and bone density measurements were generated to describe the sample of patients both overall and within black and white groups. Variables were presented as mean ± SD and median (q1-q3). Each variable was examined for normality using histograms and the Smirnov-Kolmogorov test. Tukey's method was used to test for outliers. Differences across the group were examined using the Wilcoxon rank-sum test for the variables that were not normally distributed and the two-sample t test for the normally distributed variables. Relationships between continuous variables were examined via Pearson correlation coefficients for the normally distributed variables. Spearman correlation coefficients were used for the variables that are not normally distributed. Multiple linear regression models for serum PTH, C-terminal telopeptides of type I collagen (CTX), and 1,25(OH)D were examined using race, free 25(OH)D, total 25(OH)D, calcium intake, VDBP (monoclonal and polyclonal assay), and bone mineral density (BMD) as covariates. The final model was selected based on adjusted r2 to evaluate the effect of total 25(OH)D and free 25(OH)D on serum PTH. Linear assumptions were checked using model fit diagnostic and residual plots.
The reference range of free 25(OH)D was calculated using R-package, referenceIntervals (http://CRAN.R-project.org/package=referenceIntervals). Horn's method of outlier detection using Tukey's interquartile fences was used to detect outliers. Monoclonal and polyclonal assays of VDBP were compared both overall and separately in blacks and whites using scatter plots, bar plots with error bar, correlation coefficients, and the Wilcoxon rank-sum test. All calculations were performed using SAS 9.3 (SAS Institute) and R (http://www.Rproject.org). The results were considered significant at P < .05.
Participants
Postmenopausal healthy women from recent studies were matched for age, BMI, and race with a current study of African American women using a propensity score method. Women were deemed to be healthy by history and physical examination as well as routine laboratory testing. They did not take bone-active medications (14–17). This resulted in a matching cohort of 82 women in each group, separated by race but similar in BMI and age. All participants gave informed consent, and the studies were approved by the Winthrop University Hospital Institutional Review Board.
Methods
Values for total 25(OH)D (liquid chromatography-tandem mass spectrometry) were obtained from the Mayo Clinic's Medical Laboratories (Rochester, Minnesota); albumin (Siemens ADVIA 2400) was empirically obtained and free 25(OH)D was calculated using formulae previously published (9). Serum 1,25(OH)2D was measured by using an enzyme immunoassay manufactured by ImmunoDiagnostic System Ltd. The intraassay variability was 10.2%, and the interassay variability was 18.1%. Serum calcium was measured with O-cresolphthalein complex by using automated equipment (Dimension-RXL). Serum PTH was measured with the Immulite 2000 analyzer for the quantitative measurement of intact PTH (Diagnostic Products Corp). Serum CTX was measured with a serum cross-laps ELISA kit made by Nordic Bioscience Diagnostics.
VDBP was measured using two different sandwich-based ELISA kits per the manufacturer's instructions. The R&D Systems quantikine ELISA, human VDBP kit uses a monoclonal antibody with a sensitivity ranging from 0.15 to 3.74 ng/mL. The ALPCO Diagnostics VDBP ELISA kit uses polyclonal anti-VDBP antibodies with a detection limit of 1.23 ng/mL.
Samples were sent to Future Diagnostics (Wijchen, The Netherlands) for free vitamin D testing. The free 25(OH)D ELISA is based on a two-step immunoassay procedure performed in a microtiter plate. During the first incubation step, free 25(OH)D [25(OH)VD2 and D3] is bound to the antivitamin D antibody coated on the wall of the microtiter plate. The in vivo equilibrium between free and bound 25(OH)D is minimally disturbed. After washing, a fixed amount of biotinylated 25(OH)D is added to each well. The nonbound biotinylated 25(OH)D is removed by washing, and a streptavidin peroxidase conjugate is added. In a next step, a 3′, 5, 5′-tetramethylbenzidine chromogenic substrate is added. Finally, the reaction is stopped by the addition of a stop reagent and the absorbance (A450 nm) is measured using a plate spectrophotometer. The concentration of free vitamin D in the sample is inversely proportional to the absorbance in each sample well.
Results
Patient characteristics by race (Table 1)
Table 1.
Clinical Characteristics and Baseline Measurements
| Blacks (n = 82) |
Whites (n = 82) |
Overall (n = 164) |
|||||
|---|---|---|---|---|---|---|---|
| Mean ± SD | Median (q1-q3) | Mean ± SD | Median (q1-q3) | Mean ± SD | Median (q1-q3) | P Valuea | |
| Demographics and intake | |||||||
| Age, yb | 64.89 ± 4.09 | 64 (62–67) | 65.17 ± 5.79 | 65 (61–69) | 65.03 ± 5.00 | 65 (62–68) | .718 |
| BMI, kg/m2 | 28.05 ± 4.40 | 27.4 (24.9–31.5) | 27.78 ± 3.34 | 28.1 (24.9–30.4) | 27.92 ± 3.89 | 27.7 (24.9–30.9) | .655 |
| Calcium intake, mgb | 901 ± 428 | 828 (585–1100) | 978 ± 356 | 885 (728–1171) | 940 ± 394 | 867 (657–1157) | .089 |
| Laboratory | |||||||
| Serum total 25(OH)D, ng/mL | 19.59 ± 4.71 | 20.52 (15–23.5) | 26.93 ± 6.43 | 26.82 (21.34–31.72) | 23.26 ± 6.71 | 22.9 (18.59–26.82) | <.0001 |
| Serum free 25(OH)D, pg/mL | 5.25 ± 1.24 | 5.4 (4.4–4.62) | 5.25 ± 1.27 | 5.2 (4.3–6.2) | 5.25 ± 1.25 | 5.2 (4.35–6.21) | .986 |
| VDBP monoclonal, μg/mLb | 151.4 ± 73.2 | 119.4 (95.8–211.4) | 264.8 ± 95.5 | 270.3 (194.1–323.8) | 207.4 ± 102 | 206.4 (110.9–279) | <.0001 |
| VDBP polyclonal, μg/mLb | 438 ± 248.2 | 379.3 (335.2–452) | 369.9 ± 105.3 | 342.2 (313.1–387.4) | 404.5 ± 194 | 351.7 (320–429) | .009 |
| VDBP polyclonal, μg/mL (excluding outliers)b | 378 ± 82 | 359 (327–428) | 351 ± 66 | 339 (313–382) | 364 ± 75 | 348 (318–403) | .020 |
| Bioavailable 25(OH)D, ng/mL | 1.9 ± 0.5 | 1.9 (1.4–2.2) | 2.0 ± 0.6 | 2.0 (1.6–2.5) | 1.9 ± 0.54 | 2.0 (1.58–2.31) | .155 |
| Albumin, g/dLb | 3.979 ± 0.66 | 4.2 (3.8–4.3) | 4.218 ± 0.58 | 4.3 (3.9–4.6) | 4.092 ± 0.63 | 4.3 (3.8–4.5) | .003 |
| 1,25(OH)2D, pmol/L | 131 ± 37 | 131 (102–156) | 108 ± 36 | 106 (83–125) | 119 ± 38 | 117 (91–148) | <.0001 |
| PTH, pg/mLb | 56.9 ± 23.72 | 54.6 (37.4–69.6) | 38.9 ± 18.58 | 36.2 (26.1–50.4) | 47.9 ± 23.08 | 43.7 (30.5–59.2) | <.0001 |
| CTX, ng/mLb | 0.55 ± 0.25 | 0.500 (0.384–0.666) | 0.48 ± 0.19 | 0.451 (0.322–0.597) | 0.52 ± 0.23 | 0.474 (0.367–0.637) | .101 |
| Serum ca corrected for albumin | 8.7 ± 0.72 | 8.6 (8.3–8.9) | 8.6 ± 0.59 | 8.6 (8.3–8.9) | 8.7 ± 0.66 | 8.6 (8.3–8.9) | .365 |
| Serum P, mg/dL | 3.5 ± 0.38 | 3.5 (3.3–3.8) | 3.6 ± 0.38 | 3.5 (3.4–3.8) | 3.5 ± 0.38 | 3.5 (3.3–3.8) | .454 |
| Fasting urine ca/cr | 0.07 ± 0.06 | 0.06 (0.03–0.09) | 0.11 ± 0.07 | 0.10 (0.06–0.16) | 0.09 ± 0.07 | 0.07 (0.04–0.12) | <.0001 |
| Bone density | |||||||
| Femoral neck BMD, g/cm2 | 0.776 ± 0.11 | 0.756 (0.692–0.877) | 0.722 ± 0.12 | 0.703 (0.627–0.785) | 0.760 ± 0.14 | 0.737 (0.668–0.831) | .006 |
| Wrist one-third BMD, g/cm2 | 0.694 ± 0.06 | 0.694 (0.569–0.730) | 0.632 ± 0.07 | 0.635 (0.586–0.684) | 0.667 ± 0.07 | 0.673 (0.619–0.720) | <.001 |
| Whole-body total BMD, g/cm2 | 1.140 ± 0.11 | 1.144 (1.044–1.213) | 1.024 ± 0.09 | 1.024 (0.961–1.072) | 1.090 ± 0.12 | 1.071 (1.010–1.170) | <.001 |
Abbreviations: ca, calcium; ca/cr, calcium to creatinine ratio; P, phosphate.
P values are from Wilcoxon rank-sum test for nonnormally distributed variables and t test for normally distributed variables.
Not normally distributed.
The propensity match was successful in that there were no significant differences by race in age and BMI. Mean age was 65 years and mean BMI was 27.9 kg/m2. Calcium intake was slightly higher in the white women, but this difference was not statistically significant. In the laboratory values, albumin was slightly higher in the white than black women (4.2 vs 3.9 g/dL). Serum calcium (corrected for albumin) did not differ by race. Bone density of the femur, wrist, and whole body were significantly higher in the black women. Bone density of the spine was not significantly higher. The fasting urine calcium to creatinine ratio was lower in the African Americans.
Total and free serum 25(OH)D
The results for total and free serum 25(OH)D are given in Table 2. Total serum 25(OH)D was significantly lower in black than white women (19.59 ± 4.7 ng/mL vs 26.93 ± 6.4 ng/mL, P < .0001). The distribution of serum total 25(OH)D by race is depicted in Figure 1. The separation between races is evident. Direct measurement of free 25(OH)D was almost identical between races (Table 1). Total and free 25(OH)D were closely correlated (Figure 2). VDBP was significantly lower in blacks using a monoclonal antibody (151.4 ± 73.2 μg/mL vs 264.8 ± 95.5 μg/mL, P < .0001), whereas when a polyclonal antibody assay was used, higher values were found with racial differences in the opposite direction (438 ± 248 μg/mL vs 369.9 ± 105.3 μg/mL, P < .01). The VDBP measured by the two assays was not significantly correlated (r = −0.03, P = .724). Tukey's method found outliers in the VDBP polyclonal assay, so an analysis was performed by excluding outliers. However, the interpretation of this finding did not change compared with the analysis that included outliers (blacks, 378 ± 82 μg/mL, whites, 351 ± 66 μg/mL, P = .02, overall correlation between assays r = −0.05, P = .516). The distribution of VDBP measured by the monoclonal and polyclonal antibodies is given in Figure 3 (the cross-racial separation of VDBP). The calculated bioavailable 25(OH)D, the 25(OH)D that is free plus that attached to albumin, was the same in both races.
Table 2.
Correlations With Total 25(OH) D, Free 25(OH) D and VDBP
| Variables | Overall |
Blacks |
Whites |
|||||||||
|---|---|---|---|---|---|---|---|---|---|---|---|---|
| Serum Free 25(OH)D | Serum Total 25(OH)D | VDBP (mono) | VDBP (poly)a | Serum Free 25(OH)D | Serum Total 25(OH)D | VDBP (mono) | VDBP (poly) | Serum Free 25(OH)D | Serum Total 25(OH)D | VDBP (mono) | VDBP (poly) | |
| Age, y | −0.04 | −0.002 | 0.08 | 0.08 | −0.14 | −0.02 | −0.07 | −0.08 | 0.01 | 0.01 | 0.15 | 0.22b |
| BMI, kg/m2 | 0.02 | 0.01 | −0.12 | 0.01 | −0.0004 | 0.1 | −0.08 | 0.1 | 0.04 | 0.0006 | −0.18 | −0.09 |
| Calcium intake, mg | 0.05 | 0.16b | 0.04 | −0.07 | 0.06 | 0.09 | 0.003 | −0.09 | 0.05 | 0.07 | −0.13 | 0.01 |
| Serum free 25(OH)D, pg/mL | 0.63c | −0.03 | −0.12 | 0.70c | −0.11 | −0.19 | 0.77c | 0.08 | −0.04 | |||
| 0.63d | ||||||||||||
| Serum total 25(OH)D, ng/mL | b | 0.27d | −0.11 | 0.70c | −0.07 | 0.03 | 0.77c | 0.002 | −0.04 | |||
| VDBP monoclonal, μg/mL | −0.03 | 0.27d | −0.03 | −0.11 | −0.07 | 0.11 | 0.08 | 0.002 | 0.11 | |||
| VDBP polyclonal, μg/mLa | −0.12 | −0.11 | −0.03 | −0.19 | 0.03 | 0.11 | −0.04 | −0.03 | 0.11 | |||
| Albumin, g/dL | −0.12 | 0.14 | 0.22b | 0.08 | −0.32b | −0.13 | 0.03 | 0.18 | 0.04 | 0.11 | 0.2 | 0.14 |
| Serum Ca, mg/dL | −0.07 | 0.09 | 0.14 | −0.01 | −0.22b | −0.19 | −0.04 | 0.08 | 0.11 | 0.18 | 0.11 | −0.004 |
| 1,25(OH)D pmol/L | −0.01 | −0.1 | −0.21b | 0.17b | 0.03 | 0.21 | −0.08 | 0.02 | −0.09 | −0.01 | −0.0005 | 0.25b |
| PTH, pg/mL | −0.04 | −0.32c | −0.30c | 0.02 | 0.01 | −0.002 | −0.18 | −0.08 | −0.16 | −0.33b | −0.03 | −0.02 |
| CTX, ng/mL | −0.06 | −0.17b | −0.1 | 0.01 | −0.1 | −0.16 | −0.12 | −0.02 | −0.04 | −0.04 | 0.12 | 0.02 |
| Femoral neck BMD, g/cm2 | 0.15 | 0.01 | −0.38c | 0.11 | 0.12 | 0.2 | −0.22 | 0.28b | 0.14 | 0.07 | −0.32b | −0.2 |
| Wrist one-third BMD, g/cm2 | 0.08 | −0.14 | −0.37b | 0.14 | −0.01 | 0.04 | −0.19 | 0.27b | 0.17 | 0.19 | −0.19 | −0.19 |
Abbreviations: Ca, calcium; mono, monoclonal; poly, polyclonal.
P values are from Spearman correlation.
Correlation coefficients were tested by excluding outliers for VDBP polyclonal assay because they were similar.
P < .05.
P < .0001.
P < .001.
Figure 1.
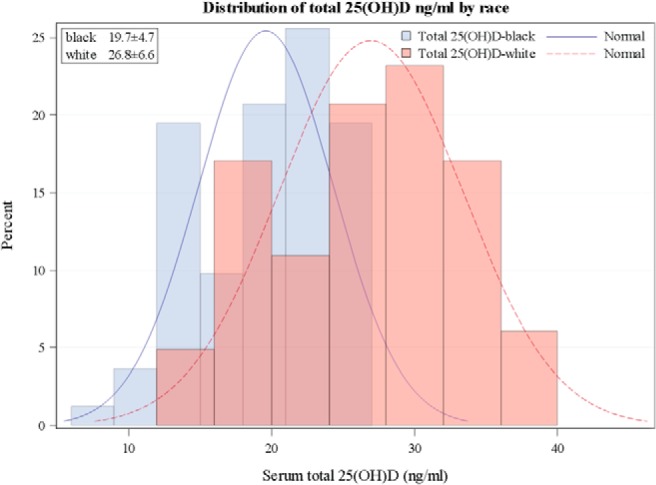
Distribution of total 25(OH)D by race. Mean total 25(OH)D is lower in black than white women. The mean level for this population is near the estimated average requirement (EAR) for the black population and above it for the white population.
Figure 2.
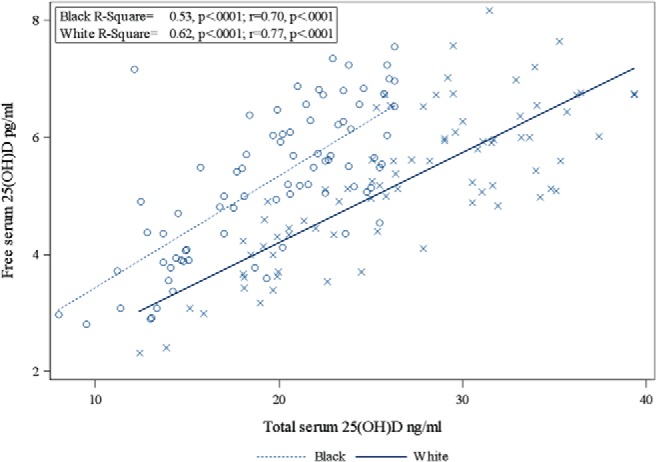
Relationships between total 25(OH)D and free 25(OH)D by race.
Figure 3.
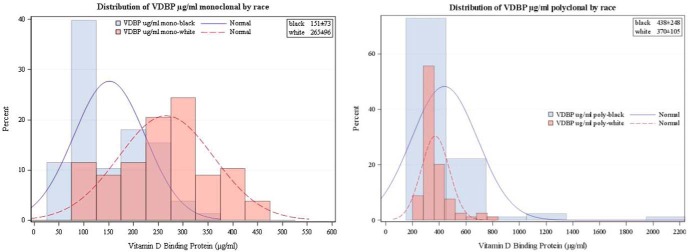
Distribution of VDBP (micrograms per milliliter; both monoclonal and polyclonal antibody) by race. The monoclonal assay is similar to the total 25(OH)D in that the white women clearly had higher values than the African Americans.
Correlations with total 25(OH)D, free 25(OH)D and VDBP (Table 2)
Free 25(OH) D had a close positive correlation (r = 0.63, P < .0001) with total 25(OH)D in the overall sample. Correlations were stronger separately in black and white women (r = 0.70, P < .0001 and r = 0.77, P < .0001, respectively). Total 25(OH)D was positively correlated with VDBP (Spearman r = 0.27, P = .0005) in the overall sample using the monoclonal antibody. Serum 1,25(OH)2D correlated negatively with VDBP (r = −0.19, P = .014) using the monoclonal assay and positively using the polyclonal assay in the overall sample. PTH correlated inversely with total 25(OH)D (r = −0.32, P < .0001) but not free 25(OH)D (r = −0.04, P = .629). BMD measurements did not have a significant correlation with total or free 25(OH)D. Serum CTX correlated negatively with total 25(OH)D (r = −0.17, P < .045). VDBP had an inverse correlation that was statistically significant for total body BMD (r = −0.29, P < .001), femoral neck (r = −.35, P < 001), and wrist BMD (r = −0.40, P < .0001).
Regression models
Race explained 30% of the variation in total 25(OH)D (F = 69.45, P < .0001) in an unadjusted model. A multivariable model was developed for total 25(OH)D using race and free 25(OH)D as the explanatory variables (F = 182.59, P < .0001). This model explained 70% of the variation in total 25(OH)D and revealed that after adjusting for free 25(OH)D, black women have 27% lower total 25(OH)D compared with white women (P < .0001). Models were developed for free 25(OH)D to evaluate how much variability is explained by total 25(OH)D and VDBP. Using the monoclonal assay for VDBP, we found that total 25(OH)D explained 39% of the variation in free 25(OH)D and only 4% of the variation is explained by VDBP. However, a lack-of-fit test revealed that the 4% improvement of this model by VDBP is not statistically significant. Race explained 31% of the variation in VDBP levels in an unadjusted model (F = 71.18, P < .0001). Using the polyclonal assay, we found that total 25(OH)D explained 39% and only 0.13% variation in free 25(OH)D is explained by VDBP. This model using the polyclonal assay was rerun by excluding outliers and the results were very similar. Total 25(OH)D explained 53% of the variation in free 25(OH)D among blacks (F = 89.51, P < .0001), whereas it explained 62% of the variation among whites (F = 125.71, P < .0001).
Multiple linear regression models were developed for PTH, CTX, and 1,25(OH)D using race, free 25(OH)D, total 25(OH)D, and calcium intake as the explanatory variables. PTH and CTX levels were not normally distributed, so these variables were log transformed before incorporation into the regression models. Race and 25(OH)D were found to be independent predictors of PTH (R2 = 0.19, F = 19.89, P < .0001) after an exhaustive search. Holding race constant, 1 U increase in total 25(OH)D results in a 2% decrease in PTH (P = .0169). Also, PTH increases by 34% for blacks compared with whites holding total 25(OH)D constant (P = .0008). In an unadjusted model, PTH decreases by 3% for every 1 U increase in total 25(OH)D (P < .0001). Race alone was a significant predictor of 1,25(OH)2D (R2 = 0.9, F = 16.31, P < .0001). We did not find any significant predictor of CTX in this particular data set.
Calculated vs direct measured free 25(OH)D
Free 25(OH)D was calculated using two different methods: one described by Bikle et al (10) and the other one modified from Vermeulen et al (19). Identical affinity constants were used for both methods (albumin affinity constant for 25(OH)D: 6 × 10⁵ M−1, VDBP affinity constant for 25(OH)D: 0.7 × 10⁹ M−1). Both the methods produced interchangeable estimates (Y = −0.14 + 1.03X), R2 = 1.0, P < .0001). The Spearman correlation coefficient between two measurements was r = 0.99. For blacks, the method of Bikle et al (10) produced 10.8 ± 5.4 pg/mL, and the modified method of Vermeulen et al (19) produced 10.6 ± 5.2 pg/mL of free 25(OH)D. For whites, the mean free 25(OH)D values were 8.8 ± 4.6 pg/mL and 8.6 ± 4.5 pg/mL, respectively, for the two methods. Directly measured free 25(OH)D was 5.3 ± 1.2 and 5.2 ± 1.3 for blacks and whites, respectively. Spearman correlation between direct and calculated measurements was r = 0.41, P < .0001.
Reference intervals
The reference range of the overall sample for free 25(OH)D is 2.79–7.70 pg/mL. In black women this reference range was 2.81–7.69 pg/mL and in white women was 2.76–7.74 pg/mL. In Table 3, values are presented with the 95% reference intervals with 90% confidence limits.
Table 3.
Parametric 95% Reference Range of Free 25(OH)D by race
| Race | n | Mean ± SD | Reference Interval (90% Confidence Interval) |
|
|---|---|---|---|---|
| Lower | Upper | |||
| All | 164 | 5.25 ± 1.25 | 2.79 (2.52–3.07) | 7.70 (7.43–7.98) |
| Blacks | 82 | 5.25 ± 1.24 | 2.81 (2.43–3.20) | 7.69 (7.30–8.07) |
| Whites | 82 | 5.247 ± 1.27 | 2.76 (2.36–3.16) | 7.74 (7.34–8.13) |
Discussion
Our study establishes through a direct measurement that free serum 25(OH)D is comparable in Americans of African descent and Americans of European descent despite a lower total 25(OH)D in African Americans. Thus, in considering the adequacy of vitamin D nutrition, the lower total serum 25(OH)D in African Americans may be misleading. This finding supports the opinion that African Americans may be incorrectly considered vitamin D deficient by a serum assay for total 25(OH)D (9). The paradox of low total serum 25(OH)D not having an adverse effect on bone health appears to have been partially unraveled.
African Americans have a higher bone density from infancy, and a greater skeletal mass is accrued in adolescence when 50% of the skeleton is formed (20). Urinary calcium excretion is lower in African Americans throughout life, as was noted in this sample. Higher intestinal calcium absorption and lower urinary calcium excretion in adolescence are clearly not related to vitamin D status but are responsible for high calcium accrual (21). African Americans are probably genetically programmed to develop a higher skeletal mass, and their greater skeletal accrual during growth does not require higher amounts of vitamin D. However, at very low levels of 25(OH)D (<12.5 ng/mL), African Americans may be more susceptible to develop rickets and osteomalacia. An explanation for this may be gleaned from an examination of VDBP-knockout mice (22). These mice are healthy, but when deprived of vitamin D, they develop mineralization disorders sooner than the wild type. Thus, the lower VDBP may make African Americans more susceptible to very low intakes of vitamin D [or very low 25(OH)D levels], for which we prefer the term deficiency while using inadequacy for higher values that are not sufficient.
We found that VDBP levels were significantly higher when our ELISA used polyclonal vs monoclonal antibodies. It is worth noting that VDBP ELISA values vary greatly, depending on the source of the antibody (23). This discordance poses at least two issues. Because the monoclonal VDBP antibody recognizes only one epitope, it may be too specific and less likely to detect across a range of genetically different VDBP protein isoforms. Polyclonal VDBP antibody is prone to batch-to-batch variability, which may produce large amounts of nonspecific antibody that can sometimes give elevated background signal. Therefore, the calculation of free 25(OH)D based on VDBP is difficult. One solution may be an ELISA using a cocktail of several VDBP monoclonal antibodies. The monoclonal antibody results were more compatible with the free 25(OH)D findings and their relationship with biomarkers. The measurement of VDBP merits further research, and the absence of any correlation between these two assays is disturbing and further supports using a direct assay to measure serum free 25(OH)D.
Schwartz et al (24) used the same direct assay to measure free 25(OH)D in patients with cirrhosis, pregnancy, and a comparison group and observed lower VDBP in African Americans. They noted a weak correlation between direct and calculated free 25(OH)D, with calculated levels being higher. We observed similar findings in our healthy population, with a similar correlation between calculated and free 25(OH)D as observed by Schwartz et al (25). Our findings in a healthy population and the divergent results from different VDBP assays as well as the variability in VDBP concentration associated with obesity, liver disease, renal disease, proteinuria, and pregnancy suggest to us that the direct measurement of free 25(OH)D is preferable to the calculated measurement (26–30). In addition, common genetic polymorphisms in the VDBP gene produce protein variants that differ in their binding affinity for 25(OH)D (9, 31).
The free hormone hypothesis states that it is the unbound, (or free) proportion of circulating hormones that has an effect on extrarenal cells (11). This has been applied to cortisol, T, and T4, and methods are available in clinical laboratories to measure the free constituent of each of these hormones. Their clinical usefulness is established primarily in alterations of protein binding (such as protein synthesis due to liver disease or alteration of binding proteins by exogenous sex steroids) rather than in physiological control mechanisms. Moreover, it is known that in the instance of the synthesis of 1,25(OH)2D (the active form of vitamin D) in the kidney, it is 25(OH)D bound to VDBP that is important, not the free 25(OH)D. Megalin, in conjunction with cubulin, controls the uptake of 25(OH)D bound to VDBP into the kidney, resulting in the conversion to 1,25(OH)2D (32). The significant correlations we observed with total 25(OH)D [for PTH and 1,25(OH)2D] are consistent with this process. Obviously it has been postulated that in some tissues other than the kidney, it is the free form of 25(OH)D that is needed for the cellular transport of vitamin D. Free 25(OH)D may still prove relevant in the extrarenal action of vitamin D.
Comparisons have been made between total and free serum 25(OH)D and their correlations with PTH and bone density as biomarkers of vitamin D effects to see whether free 25(OH)D is more relevant than bound 25(OH)D. Some but not all of these comparisons suggest that free 25(OH)D is a better biomarker of vitamin D effects (9, 24, 32, 33). For our study, we found significant negative correlations of total 25(OH)D with PTH (P < .001) and CTX (P < .05), whereas there were no significant correlations with free 25(OH)D. Our limited data support total 25(OH)D as preferable as a biomarker of vitamin D action.
We provide a reference range for free 25(OH)D, ie, 5.25–7.70 pg/mL. It is of interest to note that the distribution of free 25(OH)D is normal, whereas the distribution of total 25(OH)D is not. Total 25(OH)D explained 39% of the variability in free 25(OH)D, whereas only 4% was explained by VDBP. The mechanism whereby free 25(OH)D is maintained in a fairly narrow range including both races is unclear. Use of a reference range for free 25(OH)D is of interest, but it may not be globally useful: serum free 25(OH)D appears to be more related to vitamin D status rather than acting like a hormone with feedback control. The mechanism for regulation of free 25(OH)D would not be expected to be the same as the tightly regulated feedback loops involving pituitary hormones. Moreover, 25(OH)D is a prohormone [1,25(OH)2D is the hormone].
There are several weaknesses in our study. The sample size is small compared with population-based studies, and the participants were not selected randomly. The results of the measurement of VDBP are conflicted when using two different antibodies. However, the major strength of our study is the direct measurement of free 25(OH)D and the clear demonstration that there is no racial difference in serum values.
It has previously been noted that serum 1,25(OH)2D and PTH are higher in African Americans. The higher serum 1,25(OH)2D levels could be due to the higher levels of PTH. It may also be suggested that the higher PTH [and lower total 25(OH)D] could result from the greater incidence of obesity in African Americans (obesity is associated with a high PTH). However, we deliberately matched our populations for BMI and age, and PTH was still higher. In a previous study matched for BMI, we also observed a higher PTH (34). The skeleton of African Americans is resistant to PTH, so this may result in an elevation of PTH and secondarily increased synthesis of 1,25(OH)2D (35).
In conclusion, we report that although the total serum 25(OH)D is lower in black than white Americans, free 25(OH)D is almost identical. Their superior bone health alone should be sufficient to recognize that at the present time African Americans should not be subjected to targeted screening for low total serum 25(OH)D. The finding of almost identical free 25(OH)D between races confirms the lack of justification for such screening. Our data do not suggest that free 25(OH)D will be a better biomarker for vitamin D status than total 25(OH)D, but this remains to be determined. Moreover, a case could be made for use of free 25(OH)D when vitamin D status is examined in cirrhosis, pregnancy, and other changes in protein binding. The appropriateness of using free 25(OH)D to assess vitamin D status in African Americans merits further study.
Acknowledgments
This work was supported by National Institute for Health Grant RO1-AG032440–01A2.
Disclosure Summary: The authors have nothing to disclose.
Footnotes
- BMD
- bone mineral density
- BMI
- body mass index
- CTX
- C-terminal telopeptides of type I collagen
- 1,25(OH)2D
- 1,25-dihydroxyvitamin D
- 25(OH)D
- 25-hydroxyvitamin D
- VDBP
- vitamin D-binding protein.
References
- 1. Institute of Medicine (US) Committee to Review Dietary. Reference intakes for vitamin D and calcium. Ross AC, Taylor CL, Yaktine AL, Del Valle HB, eds. Dietary Reference Intakes for Calcium and Vitamin D. Washington, DC: National Academies Press; 2011. http://www.ncbi.nlm.nih.gov/books/NBK56070. [PubMed] [Google Scholar]
- 2. Armas LA, Dowell S, Akhter M, et al. Ultraviolet-B radiation increases serum 25-hydroxyvitamin D levels: the effect of UVB dose and skin color. J Am Acad Dermatol. 2007;57(4):588–593. [DOI] [PubMed] [Google Scholar]
- 3. Aloia JF, Vaswani A, Feuerman M, Mikhail M, Ma R. Differences in skeletal and muscle mass with aging in black and white women. Am J Physiol Endocrinol Metab. 2000;278(6):E1153–E1157. [DOI] [PubMed] [Google Scholar]
- 4. Kleerekoper M, Nelson DA, Peterson EL, et al. Reference data for bone mass, calciotropic hormones, and biochemical markers of bone remodeling in older (55–75) postmenopausal white and black women. J Bone Miner Res. 1994;9(8):1267–1276. [DOI] [PubMed] [Google Scholar]
- 5. Aloia JF, Vaswani A, Yeh JK, Flaster E. Risk for osteoporosis in black women. Calcif Tissue Int. 1996;59(6):415–423. [DOI] [PubMed] [Google Scholar]
- 6. Kalkwarf HJ, Zemel BS, Gilsanz V, et al. The bone mineral density in childhood study: bone mineral content and density according to age, sex, and race. J Clin Endocrinol Metab. 2007;92(6):2087–2099. [DOI] [PubMed] [Google Scholar]
- 7. Barrett-Connor E, Siris ES, Wehren LE, et al. Osteoporosis and fracture risk in women of different ethnic groups. J Bone Miner Res. 2005;20(2):185–194. [DOI] [PubMed] [Google Scholar]
- 8. Aloia JF. African Americans, 25-hydroxyvitamin D, and osteoporosis: a paradox. Am J Clin Nutr. 2008;88(2):545S–550S. [DOI] [PMC free article] [PubMed] [Google Scholar]
- 9. Powe CE, Evans MK, Wenger J, et al. Vitamin D-binding protein and vitamin D status of black Americans and white Americans. N Engl J Med. 2013;369(21):1991–2000. [DOI] [PMC free article] [PubMed] [Google Scholar]
- 10. Bikle DD, Gee E, Halloran B, Kowalski MA, Ryzen E, Haddad JG. Assessment of the free fraction of 25-hydroxyvitamin D in serum and its regulation by albumin and the vitamin D-binding protein. J Clin Endocrinol Metab. 1986;63(4):954–959. [DOI] [PubMed] [Google Scholar]
- 11. Chun RF, Peercy BE, Orwoll ES, Nielson CM, Adams JS, Hewison M. Vitamin D and DBP: the free hormone hypothesis revisited. J Steroid Biochem Mol Biol. 2014;144(Pt A):132–137. [DOI] [PMC free article] [PubMed] [Google Scholar]
- 12. Weintraub SJ. Vitamin D-binding protein and vitamin D in blacks and whites. N Engl J Med. 2014;370(9):878. [DOI] [PubMed] [Google Scholar]
- 13. Chen Y. Vitamin D-binding protein and vitamin D in blacks and whites. N Engl J Med. 2014;370(9):878–879. [DOI] [PubMed] [Google Scholar]
- 14. Hollis BW, Bikle DD. Vitamin D-binding protein and vitamin D in blacks and whites. N Engl J Med. 2014;370(9):879–880. [DOI] [PMC free article] [PubMed] [Google Scholar]
- 15. Aloia JF, Patel M, Dimaano R, et al. Vitamin D intake to attain a desired serum 25-hydroxyvitamin D concentration. Am J Clin Nutr. 2008;87(6):1952–1958. [DOI] [PubMed] [Google Scholar]
- 16. Aloia JF, Dhaliwal R, Shieh A, et al. Vitamin D supplementation increases calcium absorption without a threshold effect. Am J Clin Nutr. 2014;99(3):624–631. [DOI] [PubMed] [Google Scholar]
- 17. Alon US, Levy-Olomucki R, Moore WV, Stubbs J, Liu S, Quarles LD. Calcimimetics as an adjuvant treatment for familial hypophosphatemic rickets. Clin J Am Soc Nephrol. 2008;3(3):658–664. [DOI] [PMC free article] [PubMed] [Google Scholar]
- 18. Rosenbaum P, Rubin D. Constructing a control group using multivariate matched sampling methods that incorporate the propensity score. Am Stat. 1985;39(1):33–38. [Google Scholar]
- 19. Vermeulen A, Verdonck L, Kaufman JM. A critical evaluation of simple methods for the estimation of free testosterone in serum. J Clin Endocrinol Metab. 1999;84(10):3666–3672. [DOI] [PubMed] [Google Scholar]
- 20. Gilsanz V, Roe TF, Mora S, Costin G, Goodman WG. Changes in vertebral bone density in black and white girls during childhood and puberty. N Engl J Med. 1991;325:1597–1600. [DOI] [PubMed] [Google Scholar]
- 21. Braun M, Palacios C, Wigertz K, et al. Racial differences in skeletal calcium retention in adolescent girls with varied controlled calcium intakes. Am J Clin Nutr. 2007;85(6):1657–1663. [DOI] [PubMed] [Google Scholar]
- 22. Safadi FF, Thornton P, Magiera H, et al. Osteopathy and resistance to vitamin D toxicity in mice null for vitamin D binding protein. J Clin Invest. 1999;103(2):239–251. [DOI] [PMC free article] [PubMed] [Google Scholar]
- 23. Bouillon R, Jones K, Schoenmakers I. Vitamin D-binding protein and vitamin D in blacks and whites. N Engl J Med. 2014;370(9):879. [DOI] [PubMed] [Google Scholar]
- 24. Schwartz JB, Lai J, Lizaola B, et al. A comparison of measured and calculated free 25(OH) vitamin D levels in clinical populations. J Clin Endocrinol Metab. 2014;99(5):1631–1637. [DOI] [PMC free article] [PubMed] [Google Scholar]
- 25. Schwartz JB, Lai J, Lizaola B, et al. Variability in free 25(OH) vitamin D levels in clinical populations. J Steroid Biochem Mol Biol. 2014;144(Pt A):156–158. [DOI] [PMC free article] [PubMed] [Google Scholar]
- 26. Karlsson T, Osmancevic A, Jansson N, Hulthen L, Holmang A, Larsson I. Increased vitamin D-binding protein and decreased free 25(OH)D in obese women of reproductive age. Eur J Nutr. 2014;53(1):259–267. [DOI] [PubMed] [Google Scholar]
- 27. Bikle DD, Halloran BP, Gee E, Ryzen E, Haddad JG. Free 25-hydroxyvitamin D levels are normal in subjects with liver disease and reduced total 25-hydroxyvitamin D levels. J Clin Invest. 1986;78(3):748–752. [DOI] [PMC free article] [PubMed] [Google Scholar]
- 28. Koenig KG, Lindberg JS, Zerwekh JE, Padalino PK, Cushner HM, Copley JB. Free and total 1,25-dihydroxyvitamin D levels in subjects with renal disease. Kidney Int. 1992;41(1):161–165. [DOI] [PubMed] [Google Scholar]
- 29. Brown AJ, Coyne DW. Bioavailable vitamin D in chronic kidney disease. Kidney Int. 2012;82(1):5–7. [DOI] [PubMed] [Google Scholar]
- 30. Bikle DD, Gee E, Halloran B, Haddad JG. Free 1,25-dihydroxyvitamin D levels in serum from normal subjects, pregnant subjects, and subjects with liver disease. J Clin Invest. 1984;74(6):1966–1971. [DOI] [PMC free article] [PubMed] [Google Scholar]
- 31. Arnaud J, Constans J. Affinity differences for vitamin D metabolites associated with the genetic isoforms of the human serum carrier protein (DBP). Hum Genet. 1993;92(2):183–188. [DOI] [PubMed] [Google Scholar]
- 32. Christensen EI, Birn H. Megalin and cubilin: synergistic endocytic receptors in renal proximal tubule. Am J Physiol Renal Physiol. 2001;280(4):F562–F573. [DOI] [PubMed] [Google Scholar]
- 33. Ponda MP, McGee D, Breslow JL. Vitamin D-binding protein levels do not influence the effect of vitamin D repletion on serum PTH and calcium: data from a randomized, controlled trial. JCEM. 2014;99(7):2494–2499. [DOI] [PMC free article] [PubMed] [Google Scholar]
- 34. Aloia JF, Vaswani A, Yeh JK, McGowan DM, Ross P. Biochemical short-term changes produced by hormonal replacement therapy. J Endocrinol Invest. 1991;14(11):927–934. [DOI] [PubMed] [Google Scholar]
- 35. Cosman F, Morgan DC, Nieves JW, et al. Resistance to bone resorbing effects of PTH in black women. J Bone Miner Res. 1997;12(6):958–969. [DOI] [PubMed] [Google Scholar]