

Abstract
Context:
Growth hormone (GH) treatment increases bone mineral density (BMD) in women with postmenopausal osteoporosis.
Objective:
The objective was to report bone data, fractures, and quality of life (QoL) in a 10-year follow-up of women who had received GH for 3 years and compared with controls followed in parallel.
Design and Setting:
A follow-up of a double-blind, placebo-controlled study conducted at Sahlgrenska University Hospital was performed.
Patients:
Eighty women aged between 50 and 70 years with osteoporosis and estrogen hormone replacement were studied and compared with an age-matched random population sample of women (n = 120) from the World Health Organization Monitoring of Trends and Determinants in Cardiovascular Disease project (Gothenburg, Sweden).
Interventions:
Patients were randomized to GH 1.0 U or GH 2.5 U recombinant human GH or placebo sc daily during 3 years. All received calcium 750 mg and vitamin D 400 U and were followed up during 10 years.
Main Outcome Measures:
BMD and bone mineral content were measured with dual-energy X-ray absorptiometry. QoL was estimated with the 36-item Short Form.
Results:
GH increased BMD and bone mineral content dose dependently in all regions (P = .01, GH 1.0 U, and P = .0006, GH 2.5 U vs placebo). After 10 years the number of fractures decreased from 56% to 28% (P = .0003) in patients evenly distributed between groups. In controls, fractures increased from 8% to 32% (P = .0008). QoL did not change during GH treatment or during the 10-year follow-up and did not differ compared with controls.
Conclusion:
GH treatment was beneficial for bone and fracture outcome after 10 years but did not affect the QoL of the women with postmenopausal osteoporosis.
The prevalence of osteoporosis increases with age in both women and men. Possible reasons are decreased physical activity, muscle mass and body weight as well as low intake of important nutrients (1). Furthermore, the pituitary function, especially the GH secretion, often measured as serum IGF-1, decreases with age, indicating a somatopause (2). In an earlier study, it was found that IGF-1 was lower in postmenopausal women with osteoporosis, and especially in those without estrogen hormone replacement therapy (HRT), than in controls (3). GH has beneficial effects on bone in GH-deficient adults (4, 5), a state known to be associated with an increased fracture incidence (6, 7). In a previous placebo-controlled study women with postmenopausal osteoporosis were treated with GH for 3 years (8). Bone mineral content (BMC) increased 14% on GH (P < .001 vs placebo) 1 year after GH was terminated. It was speculated by Rosen and Wüster (9) in an editorial that previous studies of GH effect on bone might have been stopped too early to have seen any real effect.
The aim of this study was to report bone data and fractures after a 10-year follow-up of women who had received GH for 3 years (8), ie, 7 years after GH was stopped in comparison with a randomly selected age-matched group of women from the population who were followed up in parallel. In addition, quality of life (QoL), was assessed during the same period.
Materials and Methods
Patients
The study was performed at the Center for Endocrinology and Metabolism at Sahlgrenska University Hospital, Gothenburg, Sweden. Patients were recruited during 1994–1995 from the Endocrine Outpatient Clinic, from consultants in the city and via an advertisement in the local newspaper. Altogether, 451 women were screened for osteoporosis, of whom 371 did not meet the inclusion criteria (the majority were not osteoporotic). Seventy-seven patients with osteoporosis according to the World Health Organization (10), were included. Bone mineral density (BMD) was equal to or lower than −2.5 SD of young adults (T-score) from the LUNAR USA Reference Population database of the same gender measured at the lumbar spine using dual-energy X-ray absorptiometry (DXA). Due to difficulties in recruiting 80 women fulfilling this criterion, three patients with BMD of −2 SD and a radius fracture were included. Exclusion criteria were diabetes, ischemic heart disease, heart failure, kidney disease, cancer, any other chronic disease or any disease affecting the skeleton, ongoing treatment with corticosteroids, and/or osteoclast inhibitors. A chest X-ray was performed before the start to exclude any heart enlargement or tumors.
If the women fulfilled the inclusion criteria and had been treated with HRT for at least 9 months, they were included in the study consecutively during 1995–1996. Background data are given in Table 1.
Table 1.
Background Data of the Osteoporotic Women in Comparison With a Random Population Sample of Women From the Same Region
| Variable | Osteoporotic Women (n = 80, Start) | Osteoporotic Women, 10 y | P Value, 10 y vs Start | Controls (n = 120, Start) | Controls at Follow-Up | P Value 10 y vs Start | P Value, Osteoporosis vs Controls at Follow-Up |
|---|---|---|---|---|---|---|---|
| Age, y | 60 ± 6 | 70 ± 6 | .000 | 60 ± 6 | 72 ± 6 | .000 | Ns |
| Height, cm | 163 ± 6 | 163 ± 6 | Ns | 163 ± 6 | 161 ± 6 | <.001 | <.05 |
| Weight, kg | 64 ± 8 | 65 ± 9 | Ns | 69 ± 15 | 71 ± 14 | <.05 | <.01 |
| BMI, kg/m2 | 23.8 ± 3.1 | 24.6 ± 3.2 | Ns | 26.3 ± 4.6 | 27.1 ± 5.1 | <.05 | <.01 |
| Waist to hip ratio | 0.80 ± 0.09 | 0.82 ± 0.09 | Ns | 0.81 ± 0.06 | 0.84 ± 0.07 | <.001 | Ns |
| Lean body mass, kg | 38.7 ± 1.3 | 35.6 ± 3.4 | <.0001 | 47.2 ± 6.2 | 42.4 ± 5.7 | <.0001 | <.0001 |
| Body fat, kg | 23.1 ± 7.8 | 24.1 ± 7.3 | Ns | 31.4 ± 7.6 | 27.4 ± 9.5 | <.001 | <.01 |
| Fractures, % | 56 | 28 | <.0003 | 8 | 31 | <.0008 | Ns |
| HRT, % | 100 | 41 | <.000 | 40 | 8 | <.000 | .000 |
| Smokers, % | 20 | 15 | Ns | 38 | 40 | Ns | <.0001 |
| Leisure time physical activity | |||||||
| Sedentary, % | 38 | 39 | } Ns | 13 | 13 | }<0.03 | }.000 |
| Moderate, % | 43 | 41 | 81 | 73 | |||
| Regular/heavy, % | 19 | 20 | 6 | 14 |
Abbreviations: Ns, not significant. Mean ± SD (range).
Mean L2–L4 BMD T-score at screening was −2.7 SD. Fifty-six percent had suffered from osteoporotic fractures. There were 21 radius, 18 vertebral, seven rib, five ankle, two hip, and two upper-arm fractures in 45 patients. The indication for HRT was mainly postmenopausal symptoms, and less than 10% had started HRT due to osteoporosis. Less than 10% took calcium/vitamin D supplements before the study start. One had treated hypothyroidism and one was treated with vitamin B12. The hypothesis was that GH should increase BMD and BMC in postmenopausal women with osteoporosis. The main outcome of this follow-up was fractures and QoL.
Trial design
A randomized, double-blind, placebo-controlled trial was performed with recombinant human GH (Genotropin; Pharmacia & Upjohn) in 80 postmenopausal women with osteoporosis in addition to ongoing HRT (8). All women received 750 mg calcium and 400 U vitamin D during the trial and follow-up. Two doses of GH were tested: 1.0 U/d (0.33 mg/d or 0.005 mg/kg · d; 28 women) and 2.5 U/d (0.83 mg/d or 0.013 mg/kg · d; 27 women) sc vs similar volumes of placebo (25 women). The double-blind phase was 18 months, and all women who received GH continued the injections for another 18 months, altogether 3 years, whereas those receiving placebo stopped at 18 months. It was not considered possible by the university's ethics committee to continue longer with placebo injections. The same staff instructed the patients in the technique with an autoinjector pen injection, given at 8:00 pmin the thigh. The ampules were counted at every visit. The code was broken at the 18-month visit. There were no dropouts and no code was broken before termination of the double-blind phase. All women were followed up for 10 years, ie, 7 years after GH was stopped at the age of 60–80 years. QoL was recorded twice a year the first 3 years and then annually years 4–10. Six women died during the follow-up period.
Controls
A random population sample of 2400 men and women (participants 1616) aged 25–64 years was recruited from the city census, which is kept up to date within a maximum of 14 days, in 1995. This was the third population screening by the World Health Organization, the Monitoring of Trends and Determinants in Cardiovascular Disease in Gothenburg, Sweden (11).
Hormone, bone measurement, and fracture data were collected in all women aged 55–64 years (n = 223). All were postmenopausal with a median serum follicle stimulating hormone of 60 U/L. The subjects were invited for reevaluation in 2007 after a mean of 12 years of follow-up, at the age of 67–76 years.
Twenty-eight women in the control group died during follow-up and 75 women could not for various reasons participate, giving a participation rate of 120 women (62%).
Body composition
Body height was measured to the nearest centimeter in the standing position and body weight with light clothes to the nearest 0.1 kg. Body mass index (BMI) was calculated as weight divided by height squared (kilograms per square meter). Waist circumference was measured with a soft tape, in the standing position, midway between the rib margin and the iliac crest, hip circumference at the widest part of the gluteal region, and the waist to hip ratio was calculated. Lean body mass (kilograms) and body fat (kilograms) were measured with DXA in patients and with bioimpedance in controls.
Bone measurement, lumbar X-ray, and fractures
BMD (grams per square centimeter), bone area (square centimeters), and BMC (kilograms) were measured with a DXA (LUNAR DPX-L; Lunar Radiation Inc) including total body, lumbar spine (anterior-posterior L2–L4), femoral neck, and distal radius. LUNAR software was used for scanning (version 1.33) and analysis (version 1.33). In-house precision errors on the scanner used (system 7156), as determined from duplicate examinations in 10 healthy subjects, were 1.46% for total body BMD, 0.81% for anterior-posterior spine BMD, 1.25% for femoral neck BMD, and 1.66% for forearm BMD. The corresponding variation for total body BMC was 1.94%. The reference database used was the LUNAR USA Reference Population for the region examined. A quality assurance test with a phantom was performed every day and with a European phantom once a year. The SD for repeated measures was 0.01 g/cm2 (1%) for L2–L4 and 0.015 g/cm2 (1.5%) for the femoral neck during both short- and long-term registrations. The DXA operator was unaware of the treatment. Bone measurements were performed every sixth month until the 48-month-follow-up and then at 60, 72, 96, and 120 months.
Lumbar X-ray was performed in the standing position at the start, after 18 months, and after 3 years. The same observer analyzed all anterior, middle, and posterior vertebral heights in millimeters and was unaware of the treatment. A new vertebral fracture was defined as a decrease greater than 20% of vertebral height (12).
Fractures were derived from the Gothenburg hospital register via the National Board of Health and Welfare (Stockholm, Sweden).
Quantitative ultrasound measurements (QUS)
QUS (LUNAR Achilles) was performed using water-based devices on the right os calcaneus with the subject in the sitting position and described in detail previously (13). Speed of sound and frequency attenuation broadband ultrasound attenuation are combined by the manufacturer to form an index called stiffness, which is expressed as a percentage of the result from young adults (peak bone mass) according to the manufacturer. The same operator performed the ultrasound measurements with the same machine throughout the study and was unaware of the type of treatment.
Lifestyle factors and QoL questionnaire
Physical activity at work and during leisure time was graded from 1 to 4. Grade 1 was defined as mainly sedentary; grade 2 as predominantly walking on one level but no heavy lifting; grade 3 as regular walking, including climbing stairs, or walking uphill or lifting heavy objects; and grade 4 as heavy physical labor. The grading was based on a physiological analysis of exercise demands (14). QoL was assessed by the 36-item Short Form questionnaire (SF-36), which is a multipurpose health survey comprised of 36 questions (15). It yields an eight-scale profile of functional health and well-being scores as well as psychometrically based physical and mental health summary measures, namely a mental component summary and physical component summary. The mental component summary correlates with the subscales for vitality, social functioning, emotional role, and mental health, whereas the physical component summary correlates with subscales for physical functioning, physical role, bodily pain, and general health. The SF-36 questionnaire gives rise to a generic measure, as opposed to one that targets a specific age, disease, or treatment group, and has been proven useful in surveys of general and specific populations, comparing the relative burden of diseases, and in differentiating the health benefits produced by a wide range of different treatments (16).
Biochemical analyses
Venous blood samples from an antecubital vein were drawn between 8:00 amand 10:00 amafter an overnight fast in all women. After centrifugation, serum and plasma aliquots were frozen in 1-mL glass ampoules and stored at −70°C until analyzed, which took place within 1 year for all variables. Serum (S)-IGF-1 was determined by RIA (Nichols Institute Diagnostics) at the start. The coefficient of variation was 8% for IGF-1 at levels of 67 μg/L and 6% at 332 μg/L. In 2008 Siemens Immulite 2500 (Siemens Healthcare Diagnostics) was used, which was 28% lower than the Nichols RIA, which was withdrawn after 1995. The equation was as follows: y = 1995 value × 0.7245 + 12.6245, r = 0.9859 (n = 138).
Serum intact PTH (S-PTH) and S-IGF-binding protein-3 were determined by an immunoradiometric assay (Nichols Institute Diagnostics). Bone turnover was measured with osteocalcin according to International CIS and S-estradiol by a RIA (Sorin Medical). S-25-hydroxyvitamin D and S-1,25-hydroxyvitamin D2 were determined with reagents from Incstar. Blood glucose, S-insulin, and lipids were analyzed routinely by the accredited laboratory of clinical chemistry at the hospital.
Statistical methods
A sample size of at least 25 subjects in each group was needed to achieve a statistical significance of P < .05 for differences in bone measurements between groups. The patients were randomized in blocks, with computerized allocation to treatment groups. Neither the investigator nor the patients were aware of the type of treatment or the serum concentrations of IGF-1, which mainly reflect the GH concentration in the body. Randomization, code break, and data were analyzed by an external statistician according to intention to treat. Intraindividual differences were tested with Wilcoxon's test for paired samples. Differences between groups were tested with an ANOVA. Differences of repeated measurements were tested with a Duncan's ANOVA multiple-range test. Differences between groups at follow-up were analyzed with a Mantel Haenszel's χ2 test for ordered categorical data and with a Student's t test for numerical data.
Ethical considerations
The study was conducted according to the Declaration of Helsinki and approved by the Ethics Committee at University of Gothenburg. All subjects gave their written informed consent.
Results
Compliance and adverse events
All 80 women were followed up through the entire 3-year study period as well as the 10-year follow-up. Six of the oldest women died during the later period, three in placebo, two in GH 1.0 U, and one in GH 2.5 U, of stroke, myocardial infarction, respiratory insufficiency, or pulmonary and kidney cancer.
S-IGF-1 increased in a dose-dependent manner in both GH groups during the trial, indicating good compliance. During treatment, S-IGF-1 concentrations in the placebo and GH in the 1.0 U group were within, and in those in the GH 2.5 U group somewhat above, the 95% confidence interval for the reference levels (2). S-IGF-1 decreased to baseline levels when GH was terminated after 3 years (Figure 1).
Figure 1.

S-IGF-1 during the 3 years of GH treatment and during 10 years of follow-up of the different treatment groups and in comparison with controls. Means are given (P < .001 vs start and within groups). The diagonal lines denote the reference levels ± 95% confidence interval from a random population sample of similar age (2). Arrow indicates treatment stop.
S-PTH decreased during GH 1.0 U treatment but was similar at follow-up as at the start in both patients and controls. S-PTH increased with increasing age in controls (P < .05).
Bone measurements
BMD and BMC increased in a dose-dependent way in the GH-treated groups at years 4 and 5. At 10 years, BMD and BMC had decreased to similar levels as before treatment but were still higher in the 2.5 U GH group than the other two groups (Figure 2, A and B).
Figure 2.

A and B, Total body BMD and total body BMC. The percentage change between treatment groups and controls over time is shown. Arrow indicates treatment stop.
Calcaneal QUS measures decreased similarly to DXA in the osteoporotic patients and in the controls (P < .001). Osteoporosis was found in 25% of the controls at the start and 36% at follow-up.
Fractures
Vertebral height on X-ray did not change in any treatment group, and no new vertebral fractures had occurred during the 3-year treatment period in the osteoporotic patients.
Forty-five of 80 women with osteoporosis (56%) had suffered a fracture before inclusion in the treatment study. At 10 years, ie, 7 years after GH was stopped, 22 (28%) women had suffered from 28 fractures (P = .0003 vs start) (Figure 3). There were five women (nine fractures) in the placebo group, eight women (15 fractures) in the GH 1.0 U group, and nine women (10 fractures) in the GH 2.5 U group (P = NS between groups). There were two vertebral, seven femur neck, one ankle, five upper arm, two rib, and 11 radius fractures, all X-ray verified during follow-up.
Figure 3.
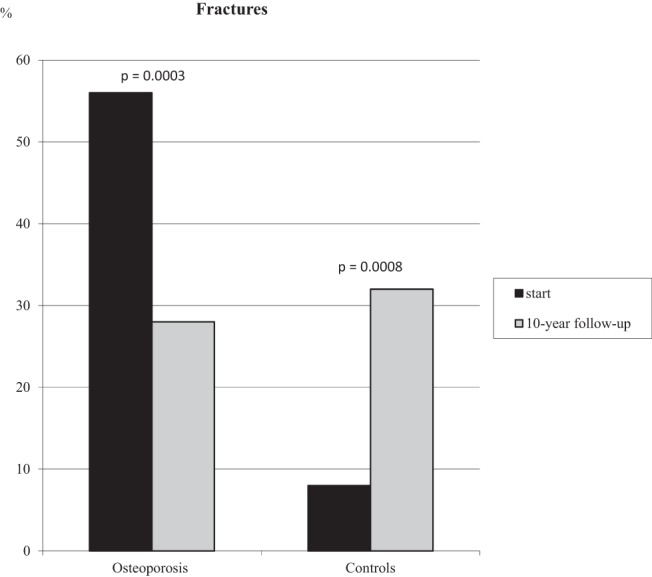
The number of fractures (percentage) in osteoporotic women and controls at the start and at the 10-year follow-up. P values are shown for the difference within groups at the start and at follow-up. There was no difference between the patients and controls at follow-up, even when ankle fractures were excluded.
In controls, 10 of 120 (8%) had suffered a fracture before and 38 of 120 (32%) had suffered from 67 fractures during this 10-year period (P = .0008 vs start, Figure 3). There were eight vertebral, three femur neck, 17 ankle, eight upper arm, nine rib, and 22 radius fractures, all X-ray verified at follow-up.
Biochemical analyses
S-IGF-1 was lower in osteoporotic patients with fractures than in patients without fractures (89 ± 28 μg/L vs 114 ± 41 μg/L, P < .01) at follow-up, irrespective of similar S-IGF-1 levels at the start, HRT, or of a given treatment. No difference in S-IGF-1 was seen among controls with or without fractures, neither at the start nor at follow-up (93 ± 27 μg/L vs 94 ± 28 μg/L, P = NS) at follow-up. IGF-1 increased dose dependently during the treatment study (Figure 1) and returned to similar levels as controls at 10 years.
Serum vitamin D, S-PTH, S-osteocalcin, S-estradiol, B-glucose, S-insulin, and S-lipids are shown in Table 2.
Table 2.
Laboratory Data for Osteoporotic Women (n = 80) at Start and at 10-Year Follow-Up After 3 Years of GH Treatment in Two Different Doses vs Placebo in Addition to Calcium/Vitamin D Supplementation
| Group | Start | 10 Years | P Value, Follow-Up vs Start Within Group | P Value, Follow-Up All Osteoporotic vs Controls | |
|---|---|---|---|---|---|
| S-25-hydroxyvitamin D, ng/mL | Placebo | 37.0 ± 12.8 | 34.4 ± 9.9 | <.001 | |
| GH 1.0 U | 32.0 ± 7.4 | 33.3 ± 9.3 | <.001 | ||
| GH2.5 U | 38.6 ± 13.1 | 38.0 ± 8.9 | |||
| All | 35.7 ± 8.2 | 35.3 ± 9.4 | |||
| Controls | 20.0 ± 5.1 | 26.5 ± 10.2 | |||
| S-1,25-hydroxyvitamin D, pg/mL | Placebo | 27.1 ± 10.3 | 39.5 ± 17.3 | <.001 | <.001 |
| GH 1.0 U | 22.9 ± 7.6 | 35.4 ± 9.9 | |||
| GH 2.5 U | 27.1 ± 10.0 | 47.8 ± 26.3 | |||
| All | 25.8 ± 9.7 | 41.1 ± 19.7 | |||
| Controls | — | 48.0 ± 17.3 | |||
| S-PTH, ng/L | Placebo | 36.4 ± 15.3 | 44.0 ± 18.1 | <.01 | |
| GH 1.0 U | 38.3 ± 13.5 | 40.9 ± 21.3 | |||
| GH 2.5 U | 37.0 ± 17.5 | 42.9 ± 17.1 | |||
| All | 37.2 ± 11.1 | 42.5 ± 18.7 | |||
| Controls | 38.1 ± 13.6 | 50.1 ± 19.3 | |||
| S-Osteocalcin, mg/L | Placebo | 6.4 ± 3.0 | 6.8 ± 4.2 | <.05 | <.001 |
| GH 1.0 U | 6.6 ± 3.0 | 9.0 ± 2.9 | <.001 | ||
| GH 2.5 U | 6.5 ± 2.8 | 7.0 ± 3.1 | |||
| All | 6.5 ± 2.9 | 7.6 ± 3.5 | |||
| Controls | 8.7 ± 2.8 | 19.3 ± 7.1 | |||
| S-IGFBP-3, mg/L | Placebo | 2.7 ± 0.4 | 2.5 ± 0.5 | <.001 | |
| GH 1.0 U | 2.7 ± 0.6 | 2.9 ± 0.6 | |||
| GH 2.5 U | 2.7 ± 0.5 | 2.7 ± 0.4 | |||
| All | 2.7 ± 0.5 | 2.6 ± 0.5 | |||
| Controls | 3.0 ± 0.6 | 3.0 ± 0.7 | |||
| S-Estradiol, pmol/L | Placebo | 0.19 ± 0.19 | 0.07 ± 0.06 | <.001 | |
| GH 1.0 U | 0.15 ± 0.09 | 0.06 ± 0.07 | <.001 | ||
| GH 2.5 U | 0.22 ± 0.15 | 0.07 ± 0.07 | |||
| All | 0.18 ± 0.12 | 0.07 ± 0.07 | |||
| Controls | 0.37 ± 0.45 | 0.05 ± 0.05 | |||
| B-glucose, mmol/L | Placebo | 4.5 ± 0.6 | 5.4 ± 1.5 | <.01 | |
| GH 1.0 U | 4.4 ± 0.6 | 5.0 ± 0.8 | <.01 | ||
| GH 2.5 U | 4.7 ± 0.5 | 4.9 ± 0.6 | <.001 | ||
| All | 4.5 ± 0.6 | 5.1 ± 1.0 | |||
| Controls | — | 5.3 ± 1.3 | |||
| S-Insulin, mU/L | Placebo | 6.6 ± 2.7 | 6.8 ± 3.2 | <.05 | <.05 |
| GH 1.0 U | 6.5 ± 3.8 | 6.4 ± 4.4 | <.01 | ||
| GH 2.5U | 8.7 ± 2.8 | 6.4 ± 4.0 | |||
| All | 7.0 ± 2.3 | 6.5 ± 3.8 | |||
| Controls | 9.8 ± 6.1 | 7.8 ± 4.0 | |||
| S-total cholesterol, mmol/L | Placebo | 5.3 ± 0.8 | 5.2 ± 1.0 | <.001 | |
| GH 1.0 U | 5.6 ± 1.0 | 5.7 ± 0.8 | |||
| GH 2.5 U | 5.7 ± 0.8 | 5.4 ± 0.8 | |||
| All | 5.5 ± 1.1 | 5.5 ± 0.9 | |||
| Controls | 6.5 ± 1.1 | 5.7 ± 1.0 | |||
| S-HDL-cholesterol, mmol/L | Placebo | 1.6 ± 0.4 | 1.8 ± 0.5 | <.001 | |
| GH 1.0 U | 1.6 ± 0.3 | 2.0 ± 0.4 | <.05 | ||
| GH 2.5 U | 1.6 ± 0.4 | 1.9 ± 0.5 | <.001 | ||
| All | 1.6 ± 0.5 | 1.9 ± 0.5 | |||
| Controls | 1.6 ± 0.4 | 1.9 ± 2.7 | |||
| S-triglycerides, mmol/L | Placebo | 1.3 ± 0.7 | 1.2 ± 0.5 | <.01 | <.02 |
| GH 1.0 U | 1.0 ± 0.5 | 1.1 ± 0.6 | |||
| GH 2.5 U | 1.0 ± 0.3 | 1.0 ± 0.5 | |||
| All | 1.1 ± 0.6 | 1.1 ± 0.5 | |||
| Controls | 1.6 ± 0.8 | 1.3 ± 0.6 |
Abbreviation: HDL, high-density lipoprotein; MONICA, Monitoring of Trends and Determinants in Cardiovascular Disease; S-IGFBP-3, S-IGF-binding protein-3. Controls from a random age-matched population sample (the World Health Organization MONICA study, Gothenburg, Sweden, n = 120, followed up simultaneously; age at start, 50–70 y). —, Blood analysis not taken in controls at start.
Body composition
Body composition in patients and controls is given in Table 1. Lean body mass increased markedly during the GH 2.5 U treatment.
At 10 years, there were no differences in height, body weight, BMI, waist to hip ratio, or body fat compared with the start in the patient group, whereas lean body mass declined. Height, lean body mass, and body fat decreased and body weight, BMI, and waist to hip ratio increased in controls at follow-up. The patients were leaner compared with controls both at the start and at follow-up.
Life-style factors and QoL
Lifestyle factors were similar in all osteoporotic groups and unchanged at the 10-year follow-up. Current smoking was less common and the degree of leisure time physical activity was lower in the osteoporotic patients than in the controls at follow-up. Civil status, occupation, sickness pension, and unemployment were similar in patients and controls.
QoL did not change significantly during GH treatment, although the 2.5 U GH dose group had the least oscillations in the scales compared with the 1.0 U GH dose group and compared with placebo, respectively. QoL decreased with increasing age and was similar in patients and controls both at start of the study and after 10 years (Figure 4, A and B).
Figure 4.

A and B, Self-reported QoL assessed by the SF-36 summarized as mental component summary and physical component summary. The graphs show the groups with GH treatment, 1.0 U low dose, 2.5 U high dose, and placebo, respectively, over time. No significant differences could be seen between treatment groups or in comparison with controls at follow-up. Arrow indicates treatment stop.
HRT and other medications
At 10 years, 33 of 80 (41%) had stopped HRT, 18 (23%) had started with bisphosphonates due to fractures, and two (3%) had received teriparatide due to established osteoporosis and side effect of bisphosphonates. Among controls, use of HRT had decreased from 48 (40%) to 10 (8%), and the use of bone-specific agents increased from 0 (0%) at the start to 5 of 120 (4%) at follow-up. The lower use of HRT was also mirrored in the S-estradiol levels in both patients and controls (Table 2).
Discussion
The present study is, to our knowledge, the largest and longest controlled study with GH treatment in postmenopausal osteoporosis. All patients had HRT prior to the start, and all received calcium/vitamin D during the study, ie, the recommended basic treatment for this disease at the time for study start in 1995. The results from the Women's Health Initiative study influenced HRT compliance and prescription after that study was published in 1999 (17). At 10 years only 41% of the patients had HRT compared with 100% at study start and HRT use had declined from 40% to 8% in the population during the same time period.
The main outcome was fracture incidence, which decreased in the patient group from 56% before inclusion to 28% during the 10 years they were followed up. The fracture incidence between the groups was similar at the 10-year follow-up; women in the control group had an increased fracture incidence from 8% to 32%. There was a 4-fold increase in fractures in the population, whereas the treated women with osteoporosis reduced their fracture incidence by 50%. Thus, the patients and controls had similar fracture prevalence at follow-up. This might explain the similar QoL results at follow-up but do not explain the similar QoL result at start of the study. QoL was fairly constant irrespective of GH dose during the 10-year period and did not differ from that of the women in the general population.
A secular trend with increasing fractures since the 1990s has been seen among women in the general population (18). Furthermore, the lower fracture incidence in the treated patients during these 10 years might be due to an increased awareness of fall prevention as well as to the registration and use of bisphosphonates, and later also teriparatide, for the treatment of postmenopausal osteoporosis and fractures. However, the use of bone-specific agents, only 4%, in the general population was very low in relation to the number of women with fracture history (32%), indicating an undertreatment.
We draw the conclusion that manifest osteoporosis with calcium and vitamin D supplementation and HRT at ages 50–70 years was not associated with a lower QoL than in women in general. Furthermore, additional anabolic treatment leading to increased BMD and BMC and a decrease of fractures did not affect QoL in postmenopausal women with osteoporosis aged 60–80 years. Little is known about QoL in relation to treatment in osteoporotic subjects. However, a previous cross-sectional study on QoL showed that subjects with osteoporosis and fractures had lower QoL than those with osteopenia (19).
An extensive questionnaire regarding physical activity did not reveal any changes in the osteoporosis patients during the study, whereas physical activity increased in the control population. Physical activity is beneficial for the bone mass but may also lead to more situations with increased fall risk (1, 18, 20).
The women in the osteoporosis group were leaner than controls. Body weight and body fat increased in the placebo group during 10-year follow-up and might partly, in addition to calcium/vitamin D, explain the maintained BMD and BMC in this group. Low body weight was the most important predictor for low BMD in women (21).
The doses of 1.0 and 2.5 U/d were well tolerated, without influence on the blood glucose or other metabolic variables. Six patients (8%) died from various diseases in the osteoporosis group and 28 of the original cohort of 223 (12%) controls died. No deaths could be attributed to GH treatment. The treatment was therefore safe, and the side effects were transient swelling in the hands and feet commonly seen in other GH studies, irrespective of indication.
A limitation of the study was the small sample size. Another is that the heterogeneous treatment regarding HRT in both the patient group and the controls as well as the addition of bone-specific treatment may have contributed to the fracture prevention in the patients. The control group was a post hoc addition to the original study and the controls differ from the patient group in number of fractures at the start of the study.
A strength of the study is that a placebo-controlled study with GH in postmenopausal osteoporosis has never been performed before with such a long follow-up time in these high ages. Furthermore, a randomly selected population sample as controls followed up simultaneously is unique. It was stated by Rosen and Wüster (9) in an editorial to the main study in 2003 that previous studies with GH treatment in osteoporosis had been too short (mainly 6–12 mo). This study had subjects on GH treatment during 3 years with a continuous increase in BMD up to 1 year thereafter. The lower fracture incidence in the treatment groups compared with the population is most probably due to GH, other bone specific agents, and the counseling of avoiding falls.
Notably, none of the patients dropped out (except for death) during this long follow-up. This may mirror the concern that women with osteoporosis have for their skeletons and their view of osteoporosis as a threatening disease.
Conclusion
GH treatment was beneficial for bone and fracture outcome after 10 years but did not affect self-reported QoL in women with postmenopausal osteoporosis. The QoL was similar to women in the general population. The fracture prevalence decreased in treated women with osteoporosis and increased in the general population at the 10-year follow-up.
Acknowledgments
The excellent help from the staff at the Centre for Endocrinology and Metabolism, especially Sigrid Lindstrand and Stella Nakate, is gratefully acknowledged. The contribution from Matty Hällqvist who performed all DXA is also greatly appreciated.
Authors' roles include the following: study design: K.L.-W.; study conduct: K.L.-W.; data collection: E.K., P.T., K.L.-W.; data analysis: E.K., P.T., K.L.-W.; data interpretation: E.K., P.T., K.L.-W.; drafting manuscript: E.K., P.T., K.L.-W.; revising manuscript content: E.K., P.T., K.L.-W.; and approving final version of manuscript: E.K., P.T., K.L-W. E.K. takes responsibility for the integrity of the data analysis.
This work was supported by the Faculty of Medicine, University of Gothenburg, and the Gothenburg Medical Society. Grants were received from the ALF agreement at the Sahlgrenska University Hospital; the Swedish Board of Health and Welfare; the Swedish Heart-Lung Foundation, and the Swedish Council for Working Life and Social Research.
Disclosure Summary: The authors have nothing to disclose.
Footnotes
- BMC
- bone mineral content
- BMD
- bone mineral density
- BMI
- body mass index
- DXA
- dual-energy X-ray absorptiometry
- HRT
- hormone replacement therapy
- QoL
- quality of life
- QUS
- quantitative ultrasound measurements
- S
- serum
- SF-36
- 36-item Short Form questionnaire
- S-PTH
- serum intact PTH.
References
- 1. Johnell O, Gullberg B, Kanis JA, et al. Risk factors for hip fracture in European women. The MEDOS Study. J Bone Miner Res. 1995;10:1802–1815. [DOI] [PubMed] [Google Scholar]
- 2. Landin-Wilhelmsen K, Wilhelmsen L, Lappas G, et al. Serum insulin-like growth factor I in a random population sample of men and women: relation to age, sex, smoking habits, coffee consumption and physical activity, blood pressure and concentrations of plasma lipids, fibrinogen, parathyroid hormone and osteocalcin. Clin Endocrinol (Oxf). 1994;41:351–357. [DOI] [PubMed] [Google Scholar]
- 3. Turner RT, Riggs BL, Spelsberg TC. Skeletal effects of estrogen. Endocr Rev. 1994;15:275–300. [DOI] [PubMed] [Google Scholar]
- 4. Landin-Wilhelmsen K, Wilhelmsen L, Bengtsson B-Å. Postmenopausal osteoporosis is more related to hormonal aberrations than to lifestyle factors. Clin Endocrinol (Oxf). 1999;51:387–394. [DOI] [PubMed] [Google Scholar]
- 5. Isaksson OGP, Lindahl A, Nilsson A, Isgaard J. Mechanism of the stimulatory effect of growth hormone on longitudinal bone growth. Endocr Rev. 1987;8:426–438. [DOI] [PubMed] [Google Scholar]
- 6. Rosén T, Wilhelmsen L, Landin-Wilhelmsen K, Lappas G, Bengtsson B-Å. Increased fracture frequency in adult patients with hypopituitarism and GH deficiency. Eur J Endocrinol. 1997;137:240–245. [DOI] [PubMed] [Google Scholar]
- 7. Wüster C, Abs R, Bengtsson B-Å, et al. The influence of growth hormone deficiency, growth hormone replacement therapy, and other aspects of hypopituitarism on fracture rate and bone mineral density. J Bone Miner Res. 2001;16:398–405. [DOI] [PubMed] [Google Scholar]
- 8. Landin-Wilhelmsen K, Nilsson A, Bosaeus I, Bengtsson B. Growth hormone increases bone mineral content in postmenopausal osteoporosis: a randomized placebo-controlled study. J Bone Miner Res. 2003;18:393–405. [DOI] [PubMed] [Google Scholar]
- 9. Rosen CJ, Wüster C. Growth hormone rising: did we quit too quickly? J Bone Miner Res. 2003;18:405–409. [DOI] [PubMed] [Google Scholar]
- 10. World Health Organization. Assessment of fracture risk and its application to screening for postmenopausal osteoporosis. Report from a Study Group. WHO Technical Report Series 843. Geneva: World Health Organization; 1994:pp 5–6. [PubMed] [Google Scholar]
- 11. Wilhelmsen L, Johansson S, Rosengren A, Wallin I, Dotevall A, Lappas G. Risk factors for cardiovascular disease during the period 1985–1995 in Goteborg, Sweden. The GOT-MONICA Project. J Intern Med. 1997;242:199–211. [DOI] [PubMed] [Google Scholar]
- 12. Smith-Bindman R, Cummings SR, Steiger P, Genant HK. A comparison of morphometric definitions of vertebral fractures. J Bone Miner Res. 1991;6:25–34. [DOI] [PubMed] [Google Scholar]
- 13. Trimpou T, Bosaeus I, Bengtsson B-Å, Landin-Wilhelmsen K. High correlation between quantitative ultrasound and DXA during 7 years of follow-up. Eur J Radiol. 2010;73:360–364. [DOI] [PubMed] [Google Scholar]
- 14. Saltin B, Grimby G. Physiological analysis of middle-aged and former athletes. Comparison with still active athletes of the same age. Circulation. 1986;38:1104–1115. [DOI] [PubMed] [Google Scholar]
- 15. Sullivan M, Karlsson J, Ware J. The Swedish SF-36 Health Survey-I. Evaluation of data quality, scaling assumptions, reliability and construct validity across general populations in Sweden. Soc Sci Med. 1995;41:1349–1358. [DOI] [PubMed] [Google Scholar]
- 16. Persson L-O, Karlsson J, Bengtsson C, Steen B, Sullivan M. The Swedish SF-36 Health Survey II. Evaluation of clinical validity: Results from population studies of elderly and women in Gothenburg. J Clin Epidemiol. 1998;51:1095–1103. [DOI] [PubMed] [Google Scholar]
- 17. Rossouw JE, Anderson GL, Prentice RL, et al. Risks and benefits of estrogen plus progestin in healthy postmenopausal women: principal results from the Women's Health Initiative randomized controlled trial. JAMA. 2002;288:321–333. [DOI] [PubMed] [Google Scholar]
- 18. Trimpou P, Lindahl A, Lindstedt G, Oleröd G, Wilhelmsen L, Landin-Wilhelmsen K. Secular trends in sex hormones and fractures in men and women. Eur J Endocrinol. 2012;166:887–895. [DOI] [PubMed] [Google Scholar]
- 19. Jahelka B, Dorner T, Terkula R, Quittan M, Bröll H, Erlacher L. Health-related quality of life in patients with osteopenia or osteoporosis with and without fractures in a geriatric rehabilitation department. Wien Med Wochenschr. 2009;159:235–240. [DOI] [PubMed] [Google Scholar]
- 20. Landin-Wilhelmsen K, Johansson S, Rosengren A, et al. Calcaneal ultrasound measurements are determined by age and physical activity. Studies in two Swedish random population samples. J Intern Med. 2000;247:269–278. [DOI] [PubMed] [Google Scholar]
- 21. Omland LM, Tell GS, Ofjord S, Skag A. Risk factors for low bone mineral density among a large group of Norwegian women with fractures. Eur J Epidemiol. 2000;3:223–229. [DOI] [PubMed] [Google Scholar]