Abstract
A review of recent research on structural monitoring in railway industry is proposed in this paper, with a special focus on stress-based solutions. After a brief analysis of the mechanical behaviour of ballasted railway tracks, an overview of the most common monitoring techniques is presented. A special attention is paid on strain gages and accelerometers for which the accurate mounting position on the track is requisite. These types of solution are then compared to another modern approach based on the use of optical fibres. Besides, an in-depth discussion is made on the evolution of numerical models that investigate the interaction between railway vehicles and tracks. These models are used to validate experimental devices and to predict the best location(s) of the sensors. It is hoped that this review article will stimulate further research activities in this continuously expanding field.
Keywords: track safety, strain gage, optical fibre-based sensor, structural health monitoring, strain measurement, track deflection, rail diagnosis, real-time monitoring
1. Introduction
The improvement and modernization of railway networks is a pragmatic solution to congestion issues surrounding larger cities. It represents an interesting modal transfer and, for a long time, multiple studies have been launched with the objective of improving and modernising the rail network. In Europe, various systems have been deployed to adopt a standard in terms of railway traffic (train and embankment adaptation, the European Rail Traffic Management System ERTMS [1], …). Structural health and operation monitoring is one of these continuously developed systems (e.g., [2]). In maintenance, it provides an efficient way to extend the operational life of railway structures. The abnormal state of real structures is predicted using routine measurements and adapted signal processing. In normal operation, it allows detecting the position and kinematics of different trains circulating in a dense network, in order to ensure safe and cost-effective train operations. Current systems, either intrusive or non-intrusive, make use of several sensor technologies. This paper provides a review of recent research investigations about sensors dedicated to the railway traffic and structural monitoring. The focus is made on existing, traditional and proven solutions in addition to the use of fibre-based sensors as a suitable and long-term perspective in the railway sector.
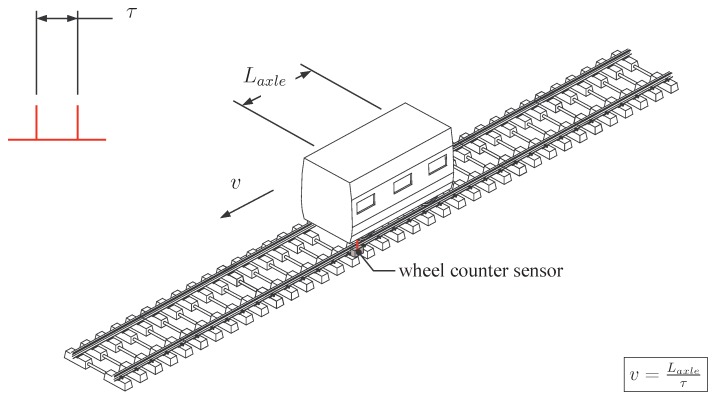
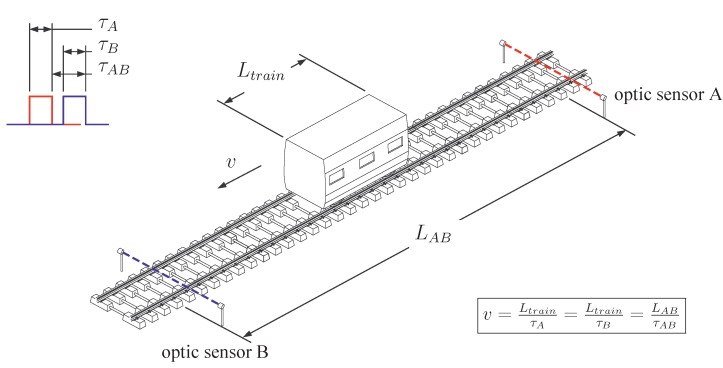
Historically, conventional monitoring systems in railway infrastructures have been used to assess position and speed of a train. The older method is the track circuit (the first track circuit used in railway signalling has been invented by William Robinson in 1872). It is still used at the present time. The basic principle lies in the connection of the two rails by the rolling stock wheelsets to short out an electrical circuit. This circuit is commonly monitored by electrical equipment (often a relay) to detect the absence of the trains. Another well-known system consist of the wheel counter sensors that are fixed to the rail and detect the passage of train wheels. They can also be used to calculate instantaneous train speed v (Figure 1), using the distance between wheels (e.g., the distance inside a bogie). This method therefore needs to specifically know the train type and its geometrical characteristics. The optical photoelectric sensing method is an alternative way to evaluate the train speed. Two devices—a transmitter and a receiver—are placed on both sides of the track, respectively. Using a light beam, the passing of the entire vehicle is detected (Figure 2). The train speed is calculated knowing the train length and the time elapsed to cross the sensor. The use of an additional identical system, placed at a sufficient distance along the track, improves the accuracy of the speed calculation. This alternative was used by Ni et al. [3] to estimate the speed of vehicles passing on bridge systems in Taiwan and to validate an alternative speed evaluation measurement. Other information is also of interest. Track deflection can be measured in various and independent approaches: monitoring with particle image velocimetry [4] or digital image correlation [5] with the purpose to replace various conventional sensors, geophones mounted on various location of a track to calculate displacements (e.g., on sleepers [4]), multi-depth deflectometers (MDD) and linear variable differential transformers (LVDT) for the deformation of track foundation [6]. Optical detection systems can also be used for evaluating the track deflection. For instance, Pinto et al. [7] showed that it is possible to obtain a reasonable accuracy of measuring absolute and relative rail displacements using a position sensitive detector integrated in a continuous monitoring system. A large body of work has been, and continues to be undertaken and this paper will present some interesting and reliable optical fibre-based detection systems.
Figure 1.
Speed evaluation based on wheel counters.
Figure 2.
Speed evaluation based on two optic sensors placed along the track.
More recently, a large amount of research in the structural monitoring domain has been undertaken, particularly since the widespread development of high-speed rail lines. Furthermore, the interest of scientific and technical communities continues to grow, with the development of new techniques. Strain gauge sensors were initially considered as the most accurate way to detect the dynamic load and speed of trains, except of some drawbacks: electromagnetic interference, fragility, excessive size, and high dependence on the temperature. New sensors, including fibre technology, present undeniable advantages: high temperature capacity, multiplexing, no sensitivity to the electromagnetic interferences. Moreover, they proved their efficiency in various civil engineering structures [8,9,10,11] and structural monitoring systems other than railway [12]. However, information about installation conditions and interpretation of results is often missing or scarcely described in railway applications.
The present contribution focuses on the state-of-the-art in structural health and operation monitoring systems installed on tracks. A special attention will be paid on new understandings related to stress-based solutions (the term “stress” is commonly used for describing strain condition, explaining why strain sensors are improperly called stress sensors). As a pre-requisite, an essential section describing the mechanisms that contribute to the track dynamics is included. Modelling approaches for numerical simulation, which is useful to calibrate systems in design and development, are presented as well. Moreover, this paper deals with existing conventional and non-conventional measurement systems showing their advantages and possible limitations.
2. Static and Dynamic Behaviour of Ballasted Railway Tracks
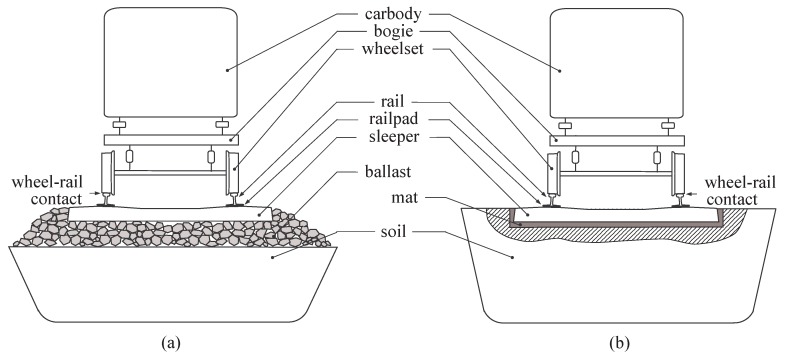
The vehicle/track system can simply be split into several components as illustrated in Figure 3.
Figure 3.
Vehicle/track main components (longitudinal view). (a) Ballasted track; (b) Slab track.
The three main subsystems are the vehicle, the track and the soil, each component playing a different role in the generation of railway dynamics.
Related to the vehicle, the suspensions (primary and secondary), carbody, bogie and wheelset masses play an important role in the vehicle vibration modes.
Related to the track, various rail profiles and types are available in the railway transport, according to the form, the weight and the track nature. It is noticeable that the standard steel used it typically constant (Young’s modulus: and density: ). Additionally the geometry varies according to the application and the country. The role of the railpads is to absorb a part of rail vibrations and to allow the wheel to traverse the rail, without damaging the sleeper. The sleeper is another important constitutive element of the track. It has two main roles: to transfer the loads from the rails to the track ballast (or mat) and the ground underneath, meanwhile maintaining the rail gauge. Ballast is used to facilitate the drainage of water and to distribute the load from the railroad ties/sleepers, without distortion by settlement. Ballasted and non-ballasted tracks present similar vertical dynamic behaviour [13]. Therefore, only ballasted railway tracks are considered in the present study.
Related to the soil, the dynamic response of foundations subjected to dynamic loadings depends on some key parameters (soil profiles, foundation form and geometry, interaction between adjacent foundations, …) with amplifications and/or attenuations as a function of the excitation frequency [14]. influencing the response.
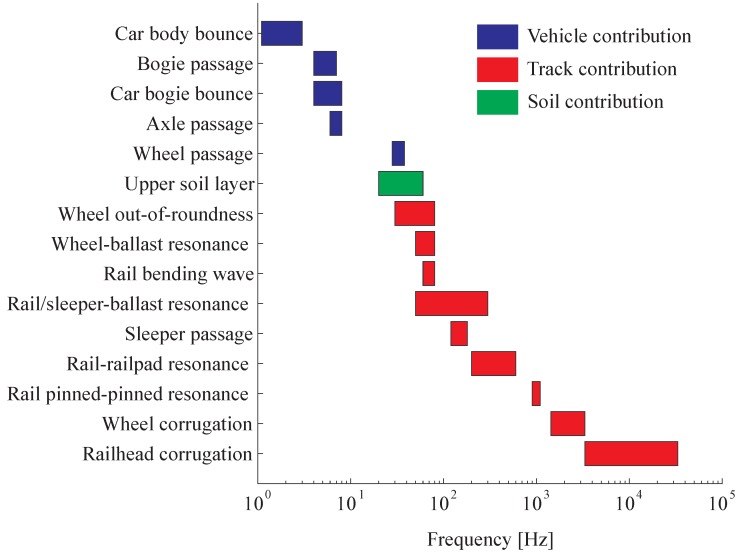
In an attempt to categorize the vibration signatures of the vehicle, the track and the soil in three frequency bands, Alias [15] proposed that they could be divided into frequency ranges with fuzzy limits:
Vehicle dynamics intervene in the low-frequency range (until ) and are efficiently transmitted to the ground if significant defects in the wheel/rail contact excite the vehicle natural modes.
Mid range frequencies (from to ) are due to the track flexibility with possible amplification due to the soil resonance.
High-frequencies (over ) constitute rolling noise due to the wheel/rail sliding and rarely intervene in the ground vibrations because the soil strongly absorbs the vibrations (material and geometrical damping).
To analyse vibration levels, it is first important to be able to understand, and predict vibration levels. Therefore as a first approximation, the passage of a train consists of a number of similar events, each with individual delay times. If a single wheelset moving at speed v is considered, its effect on the track can be represented by
| (1) |
where is the nominal loading of a wheel (considered as constant and often expressed in kN), the Dirac function and with the position of the impulse load. Equation (1) is defined for both time t and distance along the track x since . Its Fourier transform is given by
| (2) |
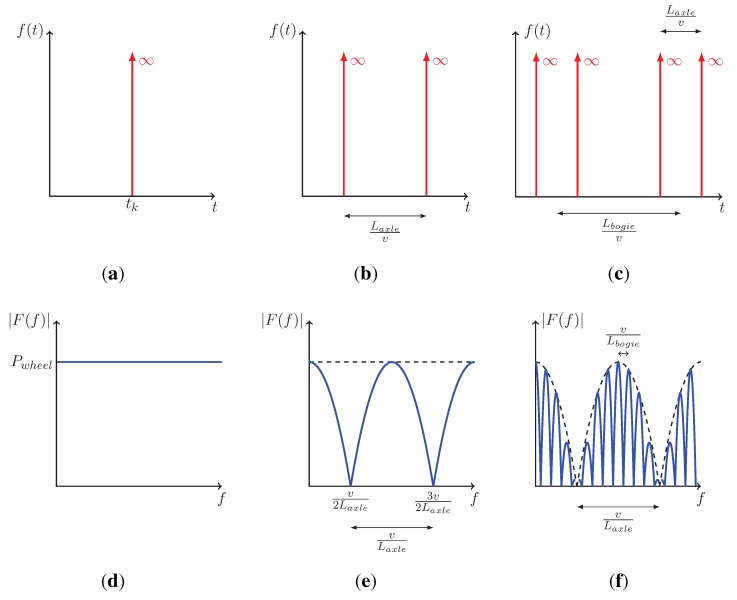
Figure 4a,d display both representations of the Dirac function, showing the expected constant magnitude as a function of the frequency f. If two impulse loads are delayed by a distance (Figure 4), the time effect and the corresponding frequency spectrum are given by
| (3) |
| (4) |
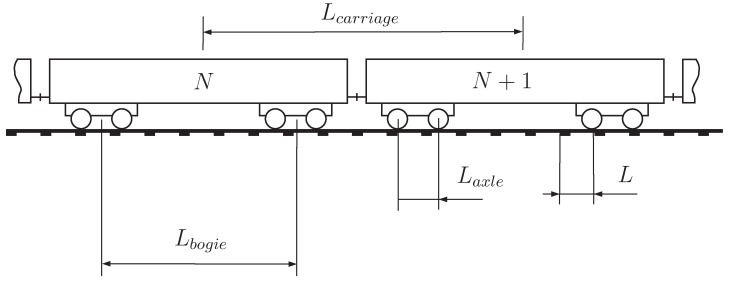
Compared to Equation (2), the result given by Equation (4) and plotted in Figure 4 shows an amplitude modulation with a beating of and zero amplitude at frequencies (). This situation represents the effect of a single bogie (Figure 5) moving at speed v. For a complete carbody, the effect is defined as
| (5) |
with the corresponding Fourier transform
| (6) |
by introducing the bogie distance . Figure 4 illustrates the effect of modulation induced by a second bogie implying that each lobe of width follows the envelope initially defined by Equation (4). By taking into account the number of carriages, Equation (6) becomes
| (7) |
and introduces the carriage excitation frequency corresponding to dominant frequencies where the maximum amplitudes follow the envelope. This evaluation of train loading provides a comprehensive interpretation of track response frequency content, including the amplitude modulation which is complementary to the work of Ju et al. [16].
Figure 4.
Carbody effect with Dirac functions. (a) Single Dirac function—one wheel effect (time history); (b) Double Dirac function—two wheels effect (time history); (c) Quadruple Dirac function—four wheel effects (time history); (d) Single Dirac function—one wheel effect (frequency content); (e) Double Dirac function—two wheels effect (frequency content); (f) Quadruple Dirac function—four wheel effects (frequency content).
Figure 5.
Rudimentary geometrical parameters of the train and the track ([17]).
The aforementioned analysis is based on a perfectly rigid contact between the vehicle and the track. To take into account the track dynamic behaviour, the track receptance is classically calculated (frequency response function between the track deflection and a stationary input force). This mathematical representation describes the propagation of energy through a system for a set range of frequencies. It is used because it provides a useful tool for investigating the flexibility of a track, as a function of natural frequencies and damping attenuation of the track. In other words, the track/foundation flexibility coupled to the vehicle speed plays an important role on the frequency content of the wheel loads: the wheel/rail force is not strictly similar to a Dirac pulse and has a finite duration dependent on the track flexibility and inversely proportional to the vehicle speed [18]. The modulation effect is therefore observable in a limited frequency range where the magnitude is more or less constant.
Knowledge of amplitude modulations and key excitation frequencies makes it more straightforward to understand the track dynamics. Other phenomena can be added to the dominant frequency spectrum [18]:
The vehicle dynamics can amplify the spectrum at low frequencies where the vehicle modes interact with the track when rolling on non-perfect surfaces (distributed unevenness or local defect like turnouts and wheel flats). This may amplify the excitation passages frequencies.
The vertical track dynamics is mainly affected by three resonances: a first resonance where the rail and sleepers vibrate vertically in phase (typically at a frequency around 50–), a second resonance where rail and sleepers vibrate out of phase (at a medium frequency in the range 200–) and a third mode, called the pinned-pinned resonance, where the rail vibrates with a wavelength equal to two sleeper bays (close to 800–).
- The ground provides two kinds of attenuation: geometric damping and material soil damping. This refers to the exponential decrease of vibration magnitude with distance and to an attenuation at high-frequencies, respectively. Moreover, if the ground is considered as a superposition of layers with different dynamic properties, a resonance can appear if the difference in rigidity between the two top layers is significant and the excitation acts in the vertical direction [19]. The corresponding frequency can be approximated by [20]
with the soil longitudinal wave velocity and h the depth of the soil first layer. Practically, this resonance occurs in a frequency range between 20 and depending on the site configuration. This mode is highly damped, meaning that the resonance area covers a large frequency band.(8)
All these phenomena are gathered in Figure 6 in relation to the frequency range of interest, according to [21].
Figure 6.
Main contribution of dynamic vehicle/track and soil interactions (with permission from [21]).
Although a sequence of travelling axle loads is a simplified representation of the effect of a moving vehicle on a track, it is commonly used because it provides general information on the vehicle/track dynamics. When the vehicle speed is lower than critical velocities, and as long as the dynamic vehicle/track interaction is low, the effect of moving loads is very similar to the static contribution. This is why the effect is called “quasi-static”. On the contrary, dynamic effects correspond to the following two situations:
An increased track deflection can appear when the vehicle speed is close to critical track/soil velocities. The physical interpretation of these effects is similar to resonances [13,22].
In practice, rail and wheel surface imperfections (distributed rail and wheel unevenness, roughness of the wheel and rail surface, out-of-roundness of the wheel, wheel flat, wheel seized ball bearing and other singular track defect like switches, crossings and rail joints) shape up the wheel/rail forces, introducing a fluctuation around the static value.
3. Estimation of Rail Stress and Monitoring Assessment Using Numerical Models
Simulating a train passage requires modelling track dynamic stress and vibration propagation through a track structure (Figure 7). The frame orientation is recommended as follows: x for horizontal parallel to the track, y for horizontal perpendicular to the track and z for vertical downward. When attempting to model track vibration, the complex wavefields generated by the three-dimensional track geometries (e.g., sleepers and ballast) can hardly be modelled using direct analytical expressions. To overcome these challenges, analytical and numerical approaches make some assumptions regarding the track geometry and components.
Figure 7.
Track deflection generated by the passing of a train.
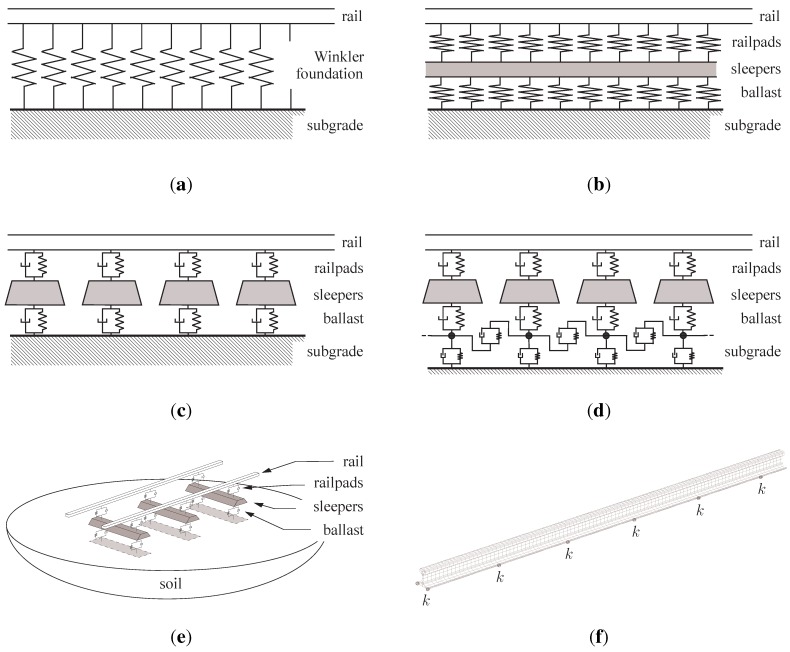
Figure 8 presents various track models used in analytical and numerical solutions to compute track dynamics. As the vertical loading dominates the dynamic track response, the simplified track structure is most often defined as a bi-dimensional model in the vertical plane along the track (a similar classification can be done in the horizontal plane for lateral loading). Two categories of tracks are proposed, depending on whether the rail is assumed to be continuously or discretely supported. This distinction is imposed by the discrete nature of sleepers along the track direction. Continuously supported models are intended to simulate the entire track and neglect the effect of sleepers. On the contrary, sleeper effects can be modelled using a discontinuous support, which increases the accuracy at higher frequencies. In both cases, the rail is considered as a flexible beam which is either finite (the problem is solved in the time domain) or infinite (in the frequency/wavenumber domain). One of the most straightforward approaches to rail modelling is to use an Euler beam (this modelling approach allows calculating the load-carrying and the small deflection characteristics of a beam). However, Grassie et al. [22] concluded that this model is deficient in several aspects in the high frequency range (>100). This was confirmed by [23] by comparing several numerical models. An alternative approach is the Timoshenko beam, a more general theory including shear deflection and rotational inertia of the rail [24] (Euler beam theory is a special case of Timoshenko beam theory). Several layers are used in the model to distinguish the masses of each component (sleeper, rail, ballast, foundation). It is well admitted by the scientific community that the dynamic behaviour of the elastic elements (railpads and ballast) is complex but they can be generally assumed to be massless and are introduced as elastic components, with linear stiffness and damping properties in many applications. Alternatively, the ballast may be included by introducing an additional layer by volume continuity models where the ballast is considered as elastic linear, using discrete element modelling approaches [25] or with additional mass, spring and damper elements [26].
Figure 8.
Track modelling: a review. (a) 2D single layer track model (continuously supported); (b) 2D two layer track model (continuously supported); (c) 2D two layer track model (discretely supported); (d) 2D three layer track model (discretely supported); (e) 3D three layer track/soil model (discretely supported); (f) 3D model for the rail (discretely supported).
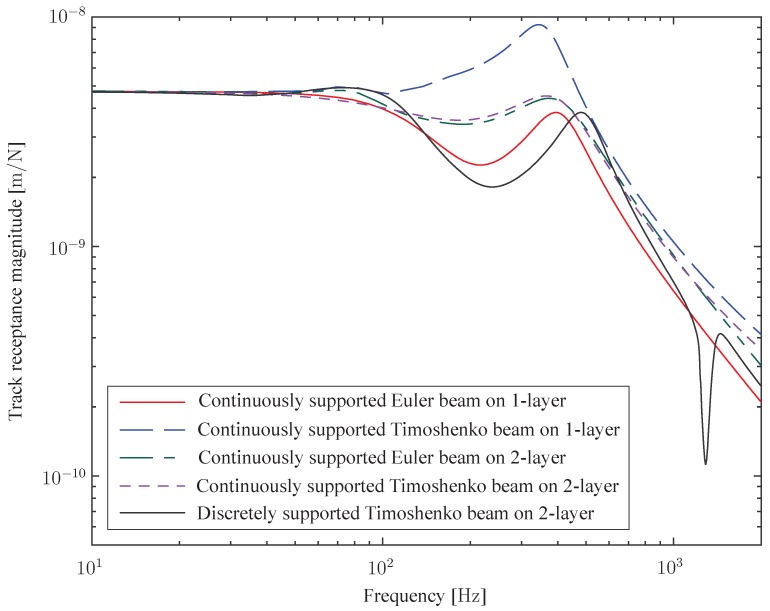
The simplest model to predict the track deflection is based on an Euler elastic beam resting on a Winkler foundation, which represents a linear stiffness distributed below the rail, taking into account the overall stiffness of the railpads, ballast and foundation (Figure 8a). Although this representation is a drastic simplification, it yields a correct dynamic response of track at low and medium frequencies [27,28]. To overcome this, the next level of refinement consists in modelling the effect of sleeper mass, either using a continuous support (Figure 8b) or a discrete support (Figure 8c). The latter offers the possibility to take into account a different track flexibility above a sleeper or in between two sleepers [29]. Multiple layer models are considered as an improvement over single layer models, as the ballast is modelling in greater detail [26] or the foundation effect on the track response at low frequencies is included [30,31] using either a condensed form for the soil (Figure 8d) or a complete half-space medium (Figure 8e). For some application cases where the stress or strain field are needed in the entire rail, a complete 3D model of the rails is unavoidable or, at the very least, a rail model must be employed providing the stress/strain distribution along the rail height and length. The discrete supports can be modelled by simple equivalent springs in order to reduce the computational cost (time and hardware) imposed by the high number of rail elements. Figure 9 plots typical vertical track receptances for various models. The three aforementioned track modes are seen in this figure: in-phase rail and sleepers mode around (highly damped), in-opposite rail and sleepers mode around (less damped) and the pinned–pinned mode at ; it should be noted that a discretely supported model is the one that provides an accurate description of this last mode (the curve on display is related to a response above a sleeper, explaining the prominent anti-resonance).
Figure 9.
Track receptances calculated using numerical codes.
Another challenge is to model the dynamic effect of the vehicle, in addition to the dominant frequency excitation imposed by the vehicle geometry configuration. As an alternative to a moving mass load, the multibody approach, which considers some vehicle parts as rigid, offers an elegant solution and the best compromise between accuracy and computational time. It is able to capture the large scale vehicle modes since this simulation allows large displacements and rotations between individual bodies. The main difficulty resides in coupling the vehicle (through the contact elements, the wheels) with the track. Works of Nielsen and Abrahamsson [32], Zhai et al. [26] and Oscarsson, Andersson and Dahlberg [29,33] efficiently describe the interaction between the track and the vehicle, in order to establish accurate models, and are still considered an accurate coupling solution for vehicle and track subsystems. These models are suitable for the study of wheel/rail impact forces at local defects, either on the wheel surface (e.g., wheel flat [34]) or on the rail (e.g., rail joint [35] or squat [36]). They also evaluate the resulting dynamic track response under different rolling speeds and under different track configurations, including train–bridge interaction [37,38].
4. Typical Sensor Configurations
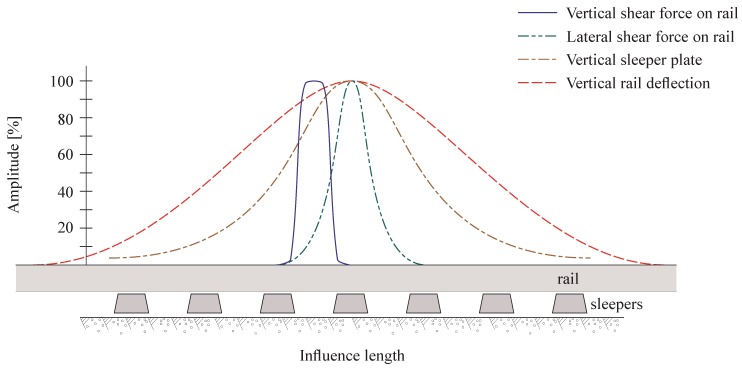
This section is strictly limited to typical and existing solutions dedicated to the wayside track monitoring. Other methods, such as embarked sensors (vehicle-side methods, e.g., [39]), represent also an alternative but are off topic and are not addressed by the present review. Due to the variety of available sensor types, only accelerometers and strain gages are discussed while the next section is devoted to optical-based sensors. A brief description is however given on other sensors. The desired information limits also the use of these transducers: only track dynamics data are evaluated and characterised (vehicle position, speed and acceleration, wheel/rail forces and track deformation). These data are primarily derived from wheel/rail load data provided by the track environment. Figure 10 illustrates the positive effect of these available measurements along the track length.
Figure 10.
Qualitative influence of load measurement on track (adapted from [40]).
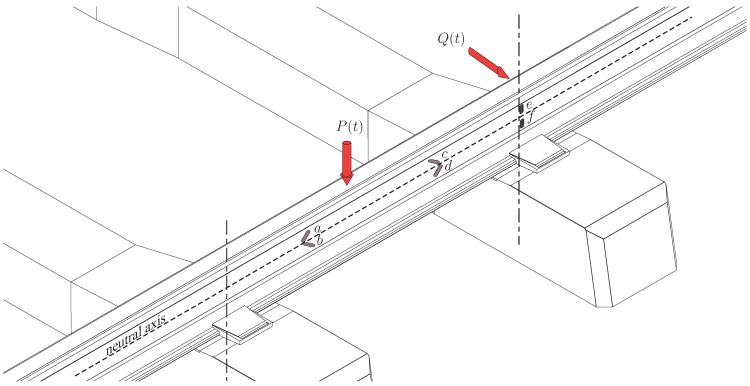
Wheel/rail forces are a primary indicator of the vehicle effect. Typically, strain gages are used to estimate this measurand and are placed on the rail (web and foot, the head being sometimes critical for measurement). Knowing the dynamic parameters of the rail (Young’s modulus E, Poisson’s ratio ν, …) and its geometrical characteristics (web thickness t, geometrical moment of inertia I, first moment of area H, …), the link between stress and strain is easily obtained. This implies that track properties must be defined in sufficient detail to generate accurate parameter values. There are a variety of strain gage circuits that have been used in the context of rail measurements. A complex sensors configuration is shown in Figure 11 where four gages (a – b – c – d oriented at 45) are placed in the track web on the neutral axis to determine the vertical loading P. If possible, the same configuration is used on the other side of the track. If is the strain measured by a sensor (or the sum of the strains measured by this sensor and its adjacent counterpart) and if there is no support (sleeper) under the rail within this gaged region, the vertical wheel/rail force is calculated using
| (9) |
where n is related to the sensors configuration (on one side , or on both sides of the rail ). The placement of these sensors on the neutral axis is the best compromise between sensitivity, cross talk and influence length to have an accurate description of the shear strain (or ). One (two) full bridge set-ups made with the four (eight) sensors easily leads to the desired output between brackets in Equation (9). If there is a sleeper within the test zone, the estimated force is equal to the difference between the wheel/rail force and the sleeper reaction. The proposed configuration provides satisfactory results in many cases. Askarinejad et al. [41] used strain gage sensors to detect train dynamic loads and adopted this method to examine the track responses at an insulated rail joint, as well as the response of the continuously welded rail. The gaged area was chosen around the joint in order to measure the wheel loads. Palo et al. [42] used the rail force as condition indicators of wheel wear and selected it as a parameter for the condition monitoring of wheel health.
Figure 11.
Wheel/rail vertical and lateral forces estimation using strain gage circuits.
Another configuration is also proposed in Figure 11, based on a lateral shear force circuit (gages e and f). It utilizes the principle that the shear force in a cantilever beam is proportional to the variation in the bending moment. A calibration is however necessary, using the relationship
| (10) |
since the lateral force depends on the whole track configuration. To be suitable and accurate, the gages should be placed over the centre of a sleeper, which constitutes a fixed boundary condition. The first application of this approach was the determination of lateral wheel/rail forces due to the rail flange. The purpose is to prevent for example derailment accidents and abnormal wear (the derailment coefficient must be kept under the safety limit). Milković et al. [43] combined these vertical and lateral configurations in order to estimate the wheel/rail contact forces. Several test cases generated by using finite element analysis were studied using the principle of independent component analysis for successful separation of vertical and lateral contact forces from recorded strain signals. Track buckling can also be monitored by using longitudinal strain gages which allow quantifying rail creep [44]. Dedicated sensors, called MPQY (Multi-Purpose Q and Y load detector) which consists of strain gages directly glued to an intermediary device, can be installed on the rail web and offer the possibility to measure simultaneously the vertical, lateral and longitudinal forces acting on the rail [45]. Conventional methods and the MPQY method for strain measurements on the rail have been compared using finite element analyses [46]. This last work shows the importance of numerical data to calibrate the sensors and to position them properly. Ryjác̆ek and M. Vokác̆ [47] give another example of a combined numerical/experimental assessment, with added value from a sensitivity analysis of several track parameters (notably the ballast stiffness).
A variety of motion transducers are suitable to make track deflection measurements. Although displacement transducers yield only to relative displacement measurements, accelerometers represent nowadays the most used absolute motion transducer type due to their easy mounting and their large dynamic and frequency ranges. The use of geophones as an alternative seismic sensor presents some merits: measurement of large displacement amplitudes, no power supply, low cost device, … at the expense of a limited bandwidth (cut-off low-frequency relatively high, typically at 4– and limited high-frequency, up to maximum ) and phase errors. Since the cut-off low-frequency is proportional to the inverse root of the seismic mass, geophones with low corner frequencies can be obtained electronically (using an electronic and powered equipment) or numerically (using an appropriate signal filtering, e.g., [48]) correcting the low frequency sensitivity, at the price of higher noise and cost. The corresponding track deflection is then obtained through successive integrations (2 for an accelerometer, 1 for a geophone). This is illustrated in Figure 12. However, robust signal processing techniques are required to avoid non-physical signals associated with the integration constant inherent to the original noisy signal and to the sampling rate. Typical solutions include algorithms that extract the noise considered as a Gaussian distribution [49], methods based on a frequency domain criterion applied on a velocity reconstruction [50] or removing the low-frequency content using adequate digital filtering [51,52]. Alternatively, laser Doppler velocimetry and high-speed video camera can be used to monitor the rail surface motion and to evaluate the rail defection [4,53] but they are dependent on the environmental condition and they cost is relatively high, compared to seismic sensors.
Figure 12.
Track deflection due to the passing of a single bogie. (a) Acceleration; (b) Velocity; (c) Displacement.
The maximum vertical rail deflection can be determined using the theory of a beam continuously supported by a Winkler foundation [54]
| (11) |
where is introduced, representing the ratio of flexibility between the foundation and the rail. is the foundation stiffness per unit of length. This formula does not take into account the influence of adjacent wheel (e.g., in a bogie, as illustrated in Figure 12). Equation (11) is also an approximation of the whole vertical track displacement.
Several relative and absolute displacements are of interest in the characterisation of the dynamic response of a track: the rail vertical absolute deflection, the rail head and foot lateral deflection, the sleeper lateral and vertical deflections, the rail rotation (difference of rail head and foot lateral deflections) and the dynamic gage (difference of left and right head displacements). When possible, direct displacement measurements are preferable, especially for long-term installations, but they are subject to some drawbacks:
Contacting displacement transducers like LVDT yield a relative motion because of how they are mounted. They have a limited frequency bandwidth (modern LVDTs have a usable bandwidth from 0 to [49]) and may be not suitable for some applications where the frequencies of interest are outside this range. They also need to be calibrated during installation.
Non-contacting transducers like capacitance-type transducers present excellent stability and repeatability and require little maintenance. However, a particular attention should be paid to their calibration to assure proper linearity and sensitivity. They are also sensitive to electrical noise and to temperature.
Most often, a specific and dedicated mounting arrangement is necessary, which complicates installation.
The use of accelerometers, combined with efficient signal processing, offer an elegant alternative to continuous displacement measurement. In addition, accelerometers can detect impending adverse changes in a structure under service conditions. In association with anti-aliasing filters, they provide an accurate assessment of frequency content and vibration levels. Kouroussis et al. [55] showed that a continuous measurement of train-generated vibrations using accelerometers on the track and even on the ground provides a semi-remote and non-invasive monitoring of train velocities. The proposed speed calculation method is based on the vibration spectrum and on the knowledge of the main dimensions of trains (knowing the modulation effects presented in Section 2). Table 1 summarizes the metrological performances of typical transducers.
Table 1.
Performances of typical transducers for railway monitoring.
| Contributing Parameters | Requirements/Limitations | |
|---|---|---|
| Strain gage | Wheel/rail force | Accurate positioning (neutral axis) |
| Vehicle position | Sensitive to electromagnetic interferences | |
| Difficulty of gluing and/or soldering | ||
| (except waterproof or embedded sensor systems) | ||
| Accelerometers | Track deflection | Absolute motion |
| Vehicle position | Sensitive to external excitation | |
| Specific signal processing | ||
| Geophones | Track deflection | Absolute motion |
| Vehicle position | Sensitive to external excitation | |
| Limited frequency range | ||
| LVDT | Track deformation | Specific mounting |
| Limited frequency range | ||
| MDD | Foundation deflections | Specific installation |
Where possible, a mix of strain gages and accelerometers can be considered for the conditioning and monitoring of vibration signals, as proposed in [41,56]. Modern accelerometers such as small micro electro-mechanical systems (MEMS) represent interesting and economically viable transducers which can be bundled together with other sensors (inclinometers, strain gages, distance sensors, …) into compact systems that can cost-effectively monitor railway infrastructures using wireless networks [57,58].
5. Using Optical Fibre-Based Sensors as an Alternative
Besides electrical detection systems, numerous research groups have demonstrated the usefulness of the optical fibre technology to monitor railway infrastructures. With their use, one can determine the structural health of the tracks and its evolution with time, while measuring the traffic. And as such, the maintenance operations can be improved, increasing both the safety level and the availability.
Optical fibres are mainly used for telecommunication purpose. They are made of two concentric cylindrical layers, so-called core and cladding, and guide light thanks to a slight refractive index difference between these two layers. Most often, the cladding is in pure silica while the core is made of silica doped with germanium oxide. There are different kinds of optical fibres but the most often used are single-mode fibres, composed of a 8 core surrounded by a 125 cladding. An additional 250 polymer layer confers to the whole optical fibre an axial strain resistance superior to the one of a steel wire of the same cross-section. Historically, the idea to use optical fibres as sensor elements arose from the wish to isolate optical fibre communications from unwanted fluctuations caused by external perturbations such as temperature changes. Since then, optical fibre sensors have emerged in numerous applications. Whatever the transduction mechanism, they bring all the advantages inherent to the use of optical fibres, such as remote operation over long distances (several tens of kilometres), light weight and ease of installation, good resistance to corrosion and high temperatures, immunity to electromagnetic interferences, …
An overview of the literature shows that the most straightforward use of optical fibres for railway applications remains the broken rail detection where lengths of optical fibres are glued along the tracks and act as a fuse [59]. Using a time domain reflectometric technique as a demodulation process, the rail break is detected by the absence of reflection due to the optical fibre failure. More interestingly, strain sensors can be realized from optical fibres, allowing them to be used for railway traffic monitoring. Among the possible configurations, Bragg grating-based and Brillouin-based sensors were the most developed in this field and will thus retain our attention in the following.
Fibre Bragg gratings (FBGs) are photo-inscribed by a lateral illumination of the optical fibre with an interference pattern of ultraviolet light (≈240 wavelength). They correspond to a permanent and periodic refractive index modulation of the fibre core along the propagation axis. They are wavelength-selective mirrors, reflecting a narrowband resonance centred on the so-called Bragg wavelength. The latter is given by
| (12) |
where is the effective refractive index of the fibre core and Λ is the grating period. Any change in the ambient temperature or strain applied on the FBG modifies these physical parameters, which in turn induces a wavelength shift (≈ or ≈1 pm/). In the elastic region, the Bragg wavelength shift is linear and without hysteresis, yielding an easy-to-process response. The read-out technique is based on the monitoring of the Bragg wavelength shift in the FBG amplitude spectrum, which can be performed using different approaches, as described in [60,61,62]. Contrary to conventional strain gages, FBGs allow an easy wavelength multiplexing with a single optical fibre connecting several tens of FBGs photo-written at different Bragg wavelengths to prevent spectral shadowing. Sharing a single measurement device for several tens of sensing points yields a competitive cost per sensor channel. FBGs also provide a resolution of the order of 1 when used for axial strain sensing with commercial dedicated interrogators. Finally, depending on the interrogator operating principle, they can be interrogated at a very high speed, typically up to several kHz.
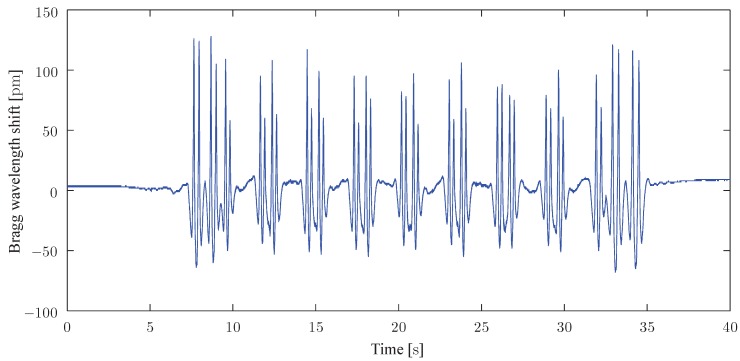
Many works using FBGs sensors for railway applications have been reported so far [63,64,65]. The main contributions come from the Polytechnic University of Hong-Kong (Tam et al.), the Universita Degli Studi del Sannio in Benevento, Italy (Cusano et al.) and the Universidad de Alcala, Alcala de Henares, Spain (Gonzalez-Herraez et al.). In particular, it was shown that a single FBG glued to the rail can provide useful information about the occupation state, the train composition (through axle counting and weighing in motion), its velocity and acceleration [63]. The group of M. Gonzalez-Herraez demonstrated that, depending on the parameters to be measured, particular orientations and locations of sensors should be considered depending on the measurement function. In doing so, they have achieved the detection of flat wheels [66]. The team of A. Cusano proposed an optimized packaging allowing the fastening of the sensor to the foot of the rail. Compared to gluing, this adapted packaging offers rapid and non-invasive installation, preventing the need to drill the rail [65]. Sensors are also easily removable, which is an undeniable asset. We have started to work on such FBG sensor developments since one year now. Figure 13 shows the evolution with time of the wavelength shift of a long bare FBG glued with UV curing urethane acrylate on the foot of a 50E2 type rail (close to classical UIC 50 rail section and commonly used in Belgium). This type of glue was privileged in our work as it offers the best compatibility between glass and metal while shielding the grating from moisture. The passage of a train circulating at measured with an FBGScan interrogator sampled at can be observed in Figure 13. The obtained shape can be directly compared to the track deflection plotted in Figure 12c. FBGs can be wavelength-multiplexed in a single optical fibre. Currently available competitive interrogators in terms of performances and cost have operational bandwidths (80–) suitable to interrogate up to 50 sensors cascaded along an optical fibre cable. Obviously, the quasi-distributed nature depends on the spacing between adjacent gratings that can vary from several centimetres to several hundreds of meters.
Figure 13.
Trace (Bragg wavelength shift with time) of an FBG glued on the foot of a 50E2 rail and subject to a train circulating at .
Distributed sensors relying on the Brillouin effect are based on the inelastic interaction between light travelling in the fibre core and the acoustic phonons. It yields a well-defined resonance that shifts with temperature () and axial strain (). Two techniques are available for demodulation, namely the Brillouin Optical Time Domain reflectometry (BOTDR) and the Brillouin Optical Time Domain Analysis (BOTDA). The principal asset of the BOTDR is that it only requires the access to one fibre end. However, this comes with a lower efficiency, which leads to long measurement times. The BOTDA, where the fibre is looped to the instrument, offers a much better signal-to-noise ratio. Due to Brillouin amplification, the BOTDA provides useful signals with intensities of two orders of magnitude higher than the inherent Rayleigh backscattering level resulting from inhomogeneities present in the fibre core. Standard commercial systems provide measurements in a 30– range with a resolution (or even better, but then for a smaller range). The resolution achieved on the measurement of the Brillouin frequency remains about , which is equivalent to an uncertainty of 1 in temperature and in strain.
There are a few achievements about the use of distributed sensors for railway monitoring applications. In [67], the results of a dynamic distributed strain measurement over a monitored section of rail track were reported. Train passages were revealed by the system but without identification of the train characteristics. In [68], high spatial resolution strain measurements over a rail track length were reported. The sensor was able to retrieve the strain distribution induced by an imposed load. However, only quasi-static tests were reported and there was no attempt to demonstrate the train identification capability of the system. Using a BOTDA, Minardo et al. [69] recently demonstrated the real-time monitoring of railway traffic with a acquisition rate and a spatial resolution. The data acquired by the sensor have demonstrated its capability of retrieving useful information, such as train identification, axle counting, speed detection and dynamic load estimation. Besides their use directly on tracks, optical fibre sensors were also reported to monitor railway infrastructures, such as bridges and viaducts [70], and for current measurement in the catenary [71].
Besides these techniques, Rayleigh scattering based distributed acoustic sensing (DAS) can also be implemented. In this case, a coherent laser pulse is launched into an optic fibre and scattering within the fibre causes the fibre to act as a distributed interferometer with a gauge length close to the pulse length [72]. The reflected light intensity is recorded as a function of time. A new pulse is launched when the former one has made a complete round-trip in the fibre under test. Changes in the reflected intensity of successive pulses from a given fibre section are caused by changes in the optical path length of that section. This system is very sensitive to both strain and temperature variations and measurements can be made simultaneously at all sections of the fibre. With a suitable analysis software, continuous monitoring is possible. The companies FOTECH Solutions and Optasense have recently demonstrated that the optical communication fibres buried close to the railway tracks can be used as a DAS for railway traffic monitoring [73,74].
Table 2 summarizes the main performances that could be expected from optical fibre sensor technologies when used as trackside monitoring solutions.
Table 2.
Performances of optical fibre transducers for railway monitoring.
| Transduction Mechanism | Sensor Location | Sensor Fixation | Spatial Resolution | |
|---|---|---|---|---|
| Bragg | Axial strain induces a Bragg wavelength shift |
On the rail or on the sleeper |
With glue, screws, welding or with dedicated magnetic or mechanical patch |
Quasi-distributed sensing (maximum 50 gratings per channel |
| Brillouin | Axial strain induces a shift of the Brillouin frequency |
On the rail | With glue | Distributed sensing (≈) |
| Acoustic | Acoustic pressure induces a change of the Rayleigh backscatter intensity |
On the rail, close to the rail or even buried |
With glue if on the rail | Distributed sensing (≈) |
6. Discussion and Useful Guidance
The analysis of track monitoring sensors revealed that several solutions exist, depending on the transduction mechanism and the expected track information. Additional points of interest include:
The utility of a prediction model has been pointed out in order to assess the optimal positioning and orientation of sensors. Increasing the complexity of a numerical model goes hand in hand with the need for more track parameters (e.g., railpad, sleeper or foundation behaviour) and an increase of computational burden, which often limit the analysis to simple cases.
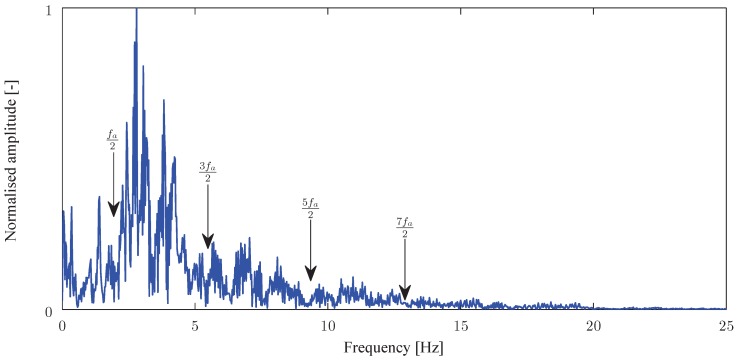
The knowledge of track dynamics allows the understanding of some specific phenomena. For example, the spectral analysis of the recorded time history presented in Figure 13 is plotted in Figure 14. The expected information is ranged between 0 and due to the low vehicle speed (). As described in Section 2, an amplitude modulation is clearly visible and some information can be deduced from these periodicities (for example, at frequencies , the amplitude tends towards zero).
Some important requirements for classical sensors (strain gauges) can be used as a guidance for the positioning of fibre-based sensors and the analysis of resulting signals. Position and orientation can be borrowed from the experience of strain gauges and applied to fibre sensor measuring the local deformation.
The mounting of the sensors is also of great importance. Although cementing and screwing are the most commonly adopted solution, other mountings (welding, magnetic attaching, clamping, …) are also of interest. It appears that there is no universal solution for sensor packaging but some precautions and requirements must be taken: a correct strain transfer (rail polishing in the case of gluing), an ease of installation, a minimum of robustness towards weather and resistance to rail maintenance, a replacement without damaging the sensor, …
A high reliability is required in railway industry, according to IEC 61508 [75] and IEC 62279 [76] standards (IEC 62279 provides a specific interpretation of IEC 61508 for railway applications). A risk assessment effort yields a target safety integrity level (SIL) with an expected probability of failure per hour less than (SIL4, which is the most dependable, has become a requirement in railway to attain in regards to a system’s development).
Figure 14.
Frequency content of the signal presented in Figure 13 ().
7. Conclusions
This paper has presented an overview about the static and dynamic behaviour of ballasted railway tracks, allowing the positioning of the problem and the definition of sensor requirements. It has then shown how to estimate stress transfer from the train passage to the track using predictive numerical models. From classical strain gauges to their optical fibre counterparts allowing miniaturized sensors to be cascaded over long distances in a single wire, a literature overview has finally been made about available solutions to monitor train traffic. This short description will be of benefit to the railway community as a whole, as a solid working base for further advanced sensor developments. With the expansion of high speed trains and the challenges that remain to tackle, such as broken rail detection independent of the signalling system, it is likely that this review article will foster further research and developments in this continuously growing field.
Acknowledgments
This work is financially supported by the INOGRAMS (Innovations for a Global Rail Management System) project (convention 7171) of The Wallonia (Belgium) in the frame of the LOGISTICS IN WALLONIA competitiveness cluster. Christophe Caucheteur is an F.R.S.-F.N.R.S. Research Associate and recipient of an ERC Starting Independent Researcher Grant (grant agreement No 280161 called PROSPER). The authors thank the partners (Alstom, Multitel and Infrabel) for the fruitful discussions.
Conflicts of Interest
The authors declare no conflict of interest.
References
- 1.Ghazel M. Formalizing a subset of ERTMS/ETCS specifications for verification purposes. Transp. Res. Part C Emerg. Technol. 2014;42:60–75. doi: 10.1016/j.trc.2014.02.002. [DOI] [Google Scholar]
- 2.FP7 European project ACEM-Rail—Automated and Cost Effective Railway Infrastructure Maintenance (FP7-SST-2010-RTD-1) [(accessed on 9 May 2015)]. Available online: http://www.acem-rail.eu.
- 3.Ni S.H., Huang Y.H., Lo K.F. An automatic procedure for train speed evaluation by the dominant frequency method. Comput. Geotech. 2011;38:416–422. doi: 10.1016/j.compgeo.2011.02.003. [DOI] [Google Scholar]
- 4.Bowness D., Lock A.C., Powrie W., Priest J.A., Richards D.J. Monitoring the dynamic displacements of railway track. J. Rail Rapid Transit. 2007;221:13–22. doi: 10.1243/0954409JRRT51. [DOI] [Google Scholar]
- 5.Murray C.A., Take W.A., Hoult N.A. Measurement of vertical and longitudinal rail displacements using digital image correlation. Can. Geotech. J. 2015;52:141–155. doi: 10.1139/cgj-2013-0403. [DOI] [Google Scholar]
- 6.Gräbe P.J., Shaw F.J. Design life prediction of a heavy haul track foundation. J. Rail Rapid Transit. 2010;224:33–344. doi: 10.1243/09544097JRRT371. [DOI] [Google Scholar]
- 7.Pinto N., Ribeiro C.A., Gabriel J., Calçada R. Dynamic monitoring of railway track displacement using an optical system. J. Rail Rapid Transit. 2015;229:280–290. doi: 10.1177/0954409713509980. [DOI] [Google Scholar]
- 8.Udd E. An overview of fiber-optic sensors. Rev. Sci. Instrum. 1995;66:4015–4030. doi: 10.1063/1.1145411. [DOI] [Google Scholar]
- 9.Luyckx G., Voet E., Lammens N., Degrieck J. Strain measurements of composite laminates with embedded fibre Bragg gratings: Criticism and opportunities for research. Sensors. 2011;11:384–408. doi: 10.3390/s110100384. [DOI] [PMC free article] [PubMed] [Google Scholar]
- 10.Kinet D., Mégret P., Goossen K.W., Qiu L., Heider D., Caucheteur C. Fiber Bragg Grating sensors toward structural health monitoring in composite materials: Challenges and solutions. Sensors. 2014;14:7394–7419. doi: 10.3390/s140407394. [DOI] [PMC free article] [PubMed] [Google Scholar]
- 11.Ye X.W., Su Y.H., Han J.P. Structural health monitoring of civil infrastructure using optical fiber sensing technology: A comprehensive review. Sci. World J. 2014:652329. doi: 10.1155/2014/652329. [DOI] [PMC free article] [PubMed] [Google Scholar]
- 12.Kurzych A., Jaroszewicz L.R., Krajewski Z., Teisseyre K.P., Kowalski J.K. Fibre optic system for monitoring rotational seismic phenomena. Sensors. 2014;14:5459–5469. doi: 10.3390/s140305459. [DOI] [PMC free article] [PubMed] [Google Scholar]
- 13.Knothe K., Grassie S.L. Modelling of railway track and vehicle/track interaction at high frequencies. Veh. Syst. Dyn. 1993;22:209–262. doi: 10.1080/00423119308969027. [DOI] [Google Scholar]
- 14.Gazetas G. Analysis of machine foundation vibrations: state of the art. Soil Dyn. Earthq. Eng. 1983;2:2–42. doi: 10.1016/0261-7277(83)90025-6. [DOI] [Google Scholar]
- 15.Alias J. La Voie Ferrée—Technique de Construction et D’entretien. Eyrolles; Paris, France: 1984. [Google Scholar]
- 16.Ju S.H., Lin H.T., Huang J.Y. Dominant frequencies of train-induced vibrations. J. Sound Vib. 2009;319:247–259. doi: 10.1016/j.jsv.2008.05.029. [DOI] [Google Scholar]
- 17.Kouroussis G., Connolly D.P., Vogiatzis K., Verlinden O. Modelling the environmental effects of railway vibrations from different types of rolling stock—A numerical study. Shock Vib. 2015;2015:142807. doi: 10.1155/2015/142807. [DOI] [Google Scholar]
- 18.Kouroussis G., Connolly D.P., Verlinden O. Railway induced ground vibrations—A review of vehicle effects. Int. J. Rail Transp. 2014;2:69–110. doi: 10.1080/23248378.2014.897791. [DOI] [Google Scholar]
- 19.Kouroussis G., Conti C., Verlinden O. Investigating the influence of soil properties on railway traffic vibration using a numerical model. Veh. Syst. Dyn. 2013;51:421–442. doi: 10.1080/00423114.2012.734627. [DOI] [Google Scholar]
- 20.Kramer S.L. Geotechnical Earthquake Engineering. Prentice–Hall; Upper Saddle River, NJ, USA: 1996. [Google Scholar]
- 21.Connolly D.P., Kouroussis G., Laghrouche O., Ho C., Forde M.C. Benchmarking railway vibrations—Track, vehicle, ground and building effects. Constr. Build. Mater. 2015;92:64–81. doi: 10.1016/j.conbuildmat.2014.07.042. [DOI] [Google Scholar]
- 22.Grassie S.L., Gregory R.W., Harrison D., Johnson K.L. The dynamic response of railway track to high frequency vertical excitation. J. Mech. Eng. Sci. 1982;24:77–90. doi: 10.1243/JMES_JOUR_1982_024_016_02. [DOI] [Google Scholar]
- 23.Grassie S.L. Models of railway track and vehicle/track interaction at high frequencies: Results of Benchmark test. Veh. Syst. Dyn. 1996;25:243–262. doi: 10.1080/00423119608969199. [DOI] [Google Scholar]
- 24.Timoshenko S. On the transverse vibrations of bars of uniform cross-section. Philos. Mag. Ser. 6. 1922;43:125–131. doi: 10.1080/14786442208633855. [DOI] [Google Scholar]
- 25.Tutumluer E., Qian Y., Hashash Y.M.A., Ghaboussi J., Davis D.D. Discrete element modelling of ballasted track deformation behaviour. Int. J. Rail Transp. 2013;1:57–73. doi: 10.1080/23248378.2013.788361. [DOI] [Google Scholar]
- 26.Zhai W., Sun X. A detailled model for investigating vertical interaction between railway vehicle and track. Veh. Syst. Dyn. 1994;23:603–615. doi: 10.1080/00423119308969544. [DOI] [Google Scholar]
- 27.Patil S.P. Natural frequencies of a railroad track. J. Appl. Mech. 1987;54:299–304. doi: 10.1115/1.3173011. [DOI] [Google Scholar]
- 28.Cai Y., Cao Z., Sun H., Xu C. Effects of the dynamic wheel-rail interaction on the ground vibration generated by a moving train. Int. J. Solids Struct. 2010;47:2246–2259. doi: 10.1016/j.ijsolstr.2010.04.013. [DOI] [Google Scholar]
- 29.Oscarsson J., Dahlberg T. Dynamic train/track/ballast interaction—Computer models and full-scale experiments. Veh. Syst. Dyn. 1998;29:73–84. doi: 10.1080/00423119808969553. [DOI] [Google Scholar]
- 30.Knothe K., Wu Y. Receptance behaviour of railway track and subgrade. Arch. Appl. Mech. 1998;68:457–470. doi: 10.1007/s004190050179. [DOI] [Google Scholar]
- 31.Kouroussis G., Gazetas G., Anastasopoulos I., Conti C., Verlinden O. Discrete modelling of vertical track–soil coupling for vehicle–track dynamics. Soil Dyn. Earthq. Eng. 2011;31:1711–1723. doi: 10.1016/j.soildyn.2011.07.007. [DOI] [Google Scholar]
- 32.Nielsen J.C.O., Abrahamsson T.J.S. Coupling of physical and modal components for analysis of moving non-linear dynamic systems on general beam structures. Int. J. Numer. Methods Eng. 1992;33:1843–1859. doi: 10.1002/nme.1620330906. [DOI] [Google Scholar]
- 33.Andersson C., Oscarsson J. Dynamic train/track interaction including state-dependent track properties and flexible vehicle components. Veh. Syst. Dyn. 1999;33:47–58. [Google Scholar]
- 34.Uzzal R.U.A., Ahmed W., Bhat R.B. A three-dimensional modeling study of wheel/rail impacts created by multiple wheel flats, and the development of a smart wheelset. J. Rail Rapid Transit. 2014 doi: 10.1177/0954409714545558. [DOI] [Google Scholar]
- 35.Grossoni I., Iwnicki S., Bezin Y., Gong C. Dynamics of a vehicle–track coupling system at a rail joint. J. Rail Rapid Transit. 2014;229:364–374. doi: 10.1177/0954409714552698. [DOI] [Google Scholar]
- 36.Zhao X., Li Z., Liu J. Wheel–rail impact and the dynamic forces at discrete supports of rails in the presence of singular rail surface defects. J. Rail Rapid Transit. 2012;226:124–139. doi: 10.1177/0954409711413975. [DOI] [Google Scholar]
- 37.Zhai W., Wang S., Zhang N., Gao M., Xia H., Cai C., Zhao C. High-speed train–track–bridge dynamic interactions—Part II: experimental validation and engineering application. Int. J. Rail Transp. 2013;1:25–41. doi: 10.1080/23248378.2013.791497. [DOI] [Google Scholar]
- 38.Arvidsson T., Karoumi R. Train–bridge interaction—A review and discussion of key model parameters. Int. J. Rail Transp. 2014;2:147–186. doi: 10.1080/23248378.2014.897790. [DOI] [Google Scholar]
- 39.Stow J., Andersson E. Field testing and instrumentation of railway vehicles. In: Iwnicki S., editor. Handbook of Railway Vehicle Dynamics. CRC Press; New York, NY, USA: 2006. [Google Scholar]
- 40.Ahlbeck D.R., Harrison H.D., Prause R.H., Johnson M.R. Evaluation of Analytical and Experimental Methodologies for the Characterization of Wheel/Rail Loads. National Institute of Standards and Technology (U.S.), Department of Transportation, Federal Railroad Administration, Office of Research and Development; Washington, DC, USA: 1976. [Google Scholar]
- 41.Askarinejad H., Dhanasekar M., Colel C. Assessing the effects of track input on the response of insulted rail joins using field experiments. J. Rail Rapid Transit. 2012;227:176–187. doi: 10.1177/0954409712458496. [DOI] [Google Scholar]
- 42.Palo M., Galar D., Nordmark T., Asplund M., Larsson D. Condition monitoring at the wheel/rail interface for decision-making support. J. Rail Rapid Transit. 2014 doi: 10.1177/0954409714526164. [DOI] [Google Scholar]
- 43.Milković D., Simić G., Jakovljević Z̆., Tanasković J., Luc̆anin V. Wayside system for wheel-rail contact forces measurements. Measurement. 2013;46:3308–3318. doi: 10.1016/j.measurement.2013.06.017. [DOI] [Google Scholar]
- 44.Ahmad S.S., Mandal N.K., Chattopadhyay G., Powell J. Development of a unified railway track stability management tool to enhance track safety. J. Rail Rapid Transit. 2013;227:493–516. doi: 10.1177/0954409713501490. [DOI] [Google Scholar]
- 45.Delprete C., Rosso C. An easy instrument and a methodology for the monitoring and the diagnosis of a rail. Mech. Syst. Signal Process. 2009;23:940–956. doi: 10.1016/j.ymssp.2008.06.004. [DOI] [Google Scholar]
- 46.Molatefi H., Mozafari H. Analysis of new method for vertical load measurement in the barycenter of the rail web by using FEM. Measurement. 2013;46:2313–2323. doi: 10.1016/j.measurement.2013.04.008. [DOI] [Google Scholar]
- 47.Ryjác̆ek P., Vokác̆ M. Long-term monitoring of steel railway bridge interaction with continuous welded rail. J. Constr. Steel Res. 2014;99:176–186. doi: 10.1016/j.jcsr.2014.04.009. [DOI] [Google Scholar]
- 48.Brincker L., Lagö T.L., Andersen P., Ventura C. Improving the classical geophone sensor element by digital correction; Proceedings of IMAC-XXIII: A Conference & Exposition on Structural Dynamics; Orlando, FL, USA. 31 January–3 February 2005. [Google Scholar]
- 49.Harris C.M., editor. Shock and Vibration Handbook. 6th ed. McGraw–Hill; New York, NY, USA: 2009. [Google Scholar]
- 50.Bennett G.J., Antunes J., Fitzpatrick J.A., Debut V. A method for optimal reconstruction of velocity response using experimental displacement and acceleration signals; Proceedings of the 14th International Congress on Sound and Vibration (ICSV14); Cairns, Australia. 9–12 July 2007. [Google Scholar]
- 51.Brandt A. Noise and Vibration Analysis: Signal Analysis and Experimental Procedures. John Wiley & Sons; West Sussex, UK: 2011. [Google Scholar]
- 52.Lamas-Lopez F., Alves-Fernandes V., Cui Y.J., D’Aguiar S.C., Calon N., Canou J., Dupla J., Tang A., Robinet A. Assessment of the double integration method using accelerometers data for conventional railway platforms; Proceedings of the Second International Conference on Railway Technology: Research, Development and Maintenance; Ajaccio, France. 8–11 April 2014. [Google Scholar]
- 53.Picoux B., Rotinat R., Regoin J.P., Houédec D.L. Prediction and measurements of vibrations from a railway track liyng on a peaty ground. J. Sound Vib. 2003;267:575–589. doi: 10.1016/S0022-460X(03)00725-9. [DOI] [Google Scholar]
- 54.Timoshenko S. Strength of Materials. Van Nostrand; New York, NY, USA: 1942. [Google Scholar]
- 55.Kouroussis G., Connolly D.P., Forde M.C., Verlinden O. Train speed calculation using ground vibrations. J. Rail Rapid Transit. 2015;229:466–483. doi: 10.1177/0954409713515649. [DOI] [Google Scholar]
- 56.Paixão A., Ribeiro C.A., Pinto N., Fortunato E., Calçada R. On the use of under sleeper pads in transition zones at railway underpasses: Experimental field testing. Struct. Infrastruct. Eng. 2015;11:112–128. doi: 10.1080/15732479.2013.850730. [DOI] [Google Scholar]
- 57.Liu C., Wei J., Zhang Z., Liang J., Ren T., Xu H. Design and evaluation of a remote measurement system for the online monitoring of rail vibration signals. J. Rail Rapid Transit. 2014 doi: 10.1177/0954409714560421. [DOI] [Google Scholar]
- 58.Cañete E., Chen J., Díaz M., Llopis L., Rubio B. Sensor4PRI: A sensor platform for the protection of railway infrastructures. Sensors. 2015;15:4996–5019. doi: 10.3390/s150304996. [DOI] [PMC free article] [PubMed] [Google Scholar]
- 59.Taylor R. A system for broken rail detection independent of the signalling system; Proceedings of the IRSE Australasia Technical Meeting; Sydney, Australia. 18 March 2011. [Google Scholar]
- 60.Caucheteur C., Chah K., Lhommé F., Blondel M., Mégret P. Autocorrelation demodulation technique for fiber Bragg grating sensor. IEEE Photonics Technol. Lett. 2004;16:2320–2322. doi: 10.1109/LPT.2004.833106. [DOI] [Google Scholar]
- 61.Hwang D., Seo D.C., Kwon I.B., Chung Y. Restoration of reflection spectra in a serial FBG sensor array of a WDM/TDM measurement system. Sensors. 2012;12:12836–12843. doi: 10.3390/s120912836. [DOI] [Google Scholar]
- 62.Choi S.J., Kim Y.C., Song M., Pan J.K. A self-referencing intensity-based fiber optic sensor with multipoint sensing characteristics. Sensors. 2014;14:12803–12815. doi: 10.3390/s140712803. [DOI] [PMC free article] [PubMed] [Google Scholar]
- 63.Wei C.L., Lai C.C., Liu S.Y., Chung W.H., Ho T.K., Tam H.Y., Ho S.L., McCusker A., Kam J., Lee K.Y. A fiber Bragg grating sensor system for train axle counting. IEEE Sens. J. 2010;10:1905–1912. [Google Scholar]
- 64.Filograno M.L., Corredera P., Rodriguez-Barrios A., Martin-Lopez S., Rodriguez-Plaza M., Andres-Alguacil A., Gonzalez-Herraez M. Real time monitoring of railway traffic using fiber Bragg grating sensors. IEEE Sens. J. 2010;12:85–92. doi: 10.1109/JSEN.2011.2135848. [DOI] [Google Scholar]
- 65.Mennella F., Laudati A., Esposito M., Cusano A., Cutolo A., Giordano M., Campopiano S., Bregliot G. Railway monitoring and train tracking by fiber Bragg grating sensors. Proc. SPIE. 2007;6619 doi: 10.1117/12.738593. [DOI] [Google Scholar]
- 66.Filograno M.L., Corredera P., Gonzalez-Herraez M., Rodriguez-Plaza M., Andres-Alguacil A. Wheel flat detection in high-speed railway systems using fiber Bragg gratings. IEEE Sens. J. 2013;13:4808–4816. doi: 10.1109/JSEN.2013.2274008. [DOI] [Google Scholar]
- 67.Kluth R., Watley D., Farhadiroushan M., Park D.S., Lee S.U., Kim J.Y., Kim Y.S. Case studies on distributed temperature and strain sensing (DTSS) by using optic fibre; Proceedings of the International Conference on Condition Monitoring and Diagnosis; Changwon, Korea. 2–5 April 2006. [Google Scholar]
- 68.Yoon H.J., Song K.Y., Kim J.S., Kim D.S. Longitudinal strain monitoring of rail using a distributed fiber sensor based on Brillouin optical correlation domain analysis. NDT&E Int. 2011;44:637–644. doi: 10.1016/j.ndteint.2011.07.004. [DOI] [Google Scholar]
- 69.Minardo A., Porcaro G., Giannetta D., Bernini R., Zeni L. Real-time monitoring of railway traffic using slope-assisted Brillouin distributed sensors. Appl. Opt. 2013;52:3770–3776. doi: 10.1364/AO.52.003770. [DOI] [PubMed] [Google Scholar]
- 70.Kerrouche A., Boyle W.J.O., Gebremichael Y., Sun T., Grattan K.T.V., Täljsten B., Bennitz A. Field tests of fibre Bragg grating sensors incorporated into CFRP for railway bridge strengthening condition monitoring. Sens. Actuators A Phys. 2008;148:68–74. doi: 10.1016/j.sna.2008.07.014. [DOI] [Google Scholar]
- 71.Laffont G., Roussel N., Rougeault S., Boussoir J., Maurin L., Ferdinand P. Innovative FBG sensing techniques for the railway industry: application to overhead contact line monitoring. Proc. SPIE. 2009;7503 doi: 10.1117/12.835346. [DOI] [Google Scholar]
- 72.Shatalin S., Treschikov V.N., Rogers A.J. Interferometric optical time-domain reflectometry for distributed optical-fiber sensing. Appl. Opt. 1998;37:5600–5604. doi: 10.1364/AO.37.005600. [DOI] [PubMed] [Google Scholar]
- 73.Fotech Solutions. [(accessed on 28 June 2015)]. Available online: http://www.fotechsolutions.com/
- 74.Kessell C. Acoustic sensing: The future for rail monitoring? Rail Eng. 2014;114:32–34. [Google Scholar]
- 75.International Electrotechnical Commission . IEC 61508: Functional Safety of Electrical/Electronic/Programmable Electronic Safety-Related Systems—Part 1: General Requirements. International Electrotechnical Commission; Geneva, Switzerland: 2010. [Google Scholar]
- 76.International Electrotechnical Commission . IEC 62279: Railway Applications—Communications, Signalling and Processing Systems—Software for Railway Control and Protection Systems. International Electrotechnical Commission; Geneva, Switzerland: 2002. [Google Scholar]


