

Abstract
Background
As tumors evolve, they upregulate glucose metabolism while also encountering intermittent periods of glucose deprivation. Here, we investigate mechanisms by which pancreatic cancer cells respond to therapeutic (2-deoxy-d-glucose, 2-DG) and physiologic (glucose starvation, GS) forms of glucose restriction.
Methods
From a tumor cell line (1420) that is unusually sensitive to 2-DG under normoxia, low (14DG2)- and high (14DG5)-dose resistant cell lines were selected and used to probe the metabolic pathways involved with their response to different forms of glucose deprivation.
Results
Muted induction of the unfolded protein response was found to correlate with resistance to 2-DG. Additionally, 14DG2 displayed reduced 2-DG uptake, while 14DG5 was cross-resistant to tunicamycin, suggesting it has enhanced ability to manage glycosylation defects. Conversely, 2-DG-resistant cell lines were more sensitive than their parental cell line to GS, which coincided with lowered levels of glycogen phosphorylase (PYGB) and reduced breakdown of glycogen to glucose in the 2-DG-resistant cell lines. Moreover, by inhibiting PYGB in the parental cell line, sensitivity to GS was increased.
Conclusions
Overall, the data demonstrate that the manner in which glucose is restricted in tumor cells, i.e., therapeutic or physiologic, leads to differential biological responses involving distinct glucose metabolic pathways. Moreover, in evolving tumors where glucose restriction occurs, the identification of PYGB as a metabolic target may have clinical application.
Keywords: 2-Deoxy-d-glucose, Glucose starvation, Unfolded protein response, Glycogen
Introduction
Oncogenes such as Myc and Ras as well as a host of others have been shown to enhance glucose consumption, thereby supplying the necessary energy and biomass required for tumor cell proliferation; however, due to aberrant angiogenesis and rapid tumor growth, the availability of this nutrient becomes restricted [1–4]. Thus, as tumor cells proliferate, they are likely to encounter periods of glucose deprivation and must employ mechanisms to survive starvation and its consequent stress [5]. Due to its inhibitory effects on glucose metabolism, the sugar analog 2-deoxy-d-glucose (2-DG) has been used both in vitro and in vivo to mimic the glucose-deprived environment of a tumor. As a glucose analog, 2-DG inhibits glycolysis, reducing energy production. This is particularly detrimental to cells growing under hypoxic conditions, where mitochondria are unable to efficiently produce ATP, rendering cells dependent on glycolysis for survival [6]. Preclinical in vitro and in vivo data supporting the use of 2-DG to kill hypoxic tumor cells have led to a Phase I clinical trial in combination with the antimitotic chemotherapeutic agent docetaxel to target the faster-replicating aerobic cells [7]. The safety of 2-DG use in patients was established at a dose of 63 mg/Kg delivered orally once per day.
In contrast to the findings where under hypoxic conditions all cell lines tested to date are killed with 2-DG treatment, under normoxic conditions the majority of cell lines examined display growth inhibition but not cell death in response to low-dose 2-DG treatment [8]. However, previously we reported that as an analog of mannose, 2-DG provokes a lethal response in a select few cancer cell lines under normoxia, including pancreatic cancer cell line 1420 [9]. This toxicity was revealed not to be due to inhibition of glycolysis but rather through interference with N-linked glycosylation, a process dependent on lipid-linked oligosaccharide (LLO) synthesis [10]. Inhibition of N-linked glycosylation leads to disruption in the folding of glycoproteins, which initiates a signaling cascade, known as the unfolded protein response (UPR), to reestablish homeostasis in the endoplasmic reticulum (ER) [11]. As a consequence of unfolded protein accumulation, the UPR induces production of the protein-folding chaperone Grp78 in an attempt to alleviate ER stress [12]. In addition, PKR-like endoplasmic reticulum kinase (PERK), a transducer of the UPR, is activated and in turn attempts to reduce the folding burden by slowing protein production through the phosphorylation of eukaryotic translation initiation factor 2 alpha (eif2α) [13]. If Grp78, PERK and the other UPR components are unable to efficiently relieve ER stress, apoptosis ensues through activation of C/EBP-homologous protein (CHOP) via downregulation of the anti-apoptotic mitochondrial protein Bcl-2 [14].
Our laboratory previously demonstrated that a cell line (1469) that is intrinsically resistant to 2-DG displays reduced uptake of 2-DG, lower LLO interference and muted induction of UPR as compared to the sensitive cell line (1420) when treated with 2-DG [9]. In anticipation of the emergence of resistance in the clinical application of this sugar analog, cell line 1420 was used to isolate two-fold (14DG2) and fivefold (14DG5) resistant variants by continuous exposure to increasing doses of 2-DG under normoxia.
Since the biologic activities of 2-DG are conventionally recognized as mimicking GS, the resistant cell variants were used here to study mechanisms of survival under both 2-DG treatment and when starved of glucose. Surprisingly, our results reveal an inverse relationship between survival to 2-DG and GS. Although we identify several mechanisms that are associated with the evolution of resistance to 2-DG including reduced uptake of the sugar analog as well as decreased interference with glycosylation, we find that resistance to GS may be explained by a single mechanism of glycogen utilization due to increased levels of glycogen phosphorylase isoform PYGB in 1420 as compared to 14DG2 and 14DG5.
Materials and methods
Cell culture
Human pancreatic tumor cell line 1420 (MIA PaCa-2) was purchased from ATCC (Manassas, VA), and from this cell line, a twofold 2-DG-resistant variant cell line (14DG2) was generated by continuous treatment with 2 mM 2-DG for a period of months. Additionally, from 14DG2, a five-fold 2-DG-resistant variant (14DG5) was developed by continuous treatment with 5 mM 2-DG for a period of months. Cells were maintained in DMEM with 2 g/L of glucose (Life Technologies, 11885-084), and 14DG2 and 14DG5 were continually cultured with 2 mM 2-DG or 5 mM 2-DG, respectively. Media for cell passage were supplemented with penicillin/streptomycin (AMRESCO, Solon, OH, K952) and 10 % FBS (Life Technologies, Grand Island, NY, 16000). For glucose starvation, no glucose DMEM (Life Technologies, 11966-025) was used with the antibiotics listed above and dialyzed FBS (Life Technologies, 26400). Cells were seeded and allowed to attach and grow. The next day, culture medium was removed, cells were washed twice with PBS, and starvation medium was added to the culture. For all other experiments, media were replaced on all cell lines with 2-DG-free DMEM with 2 g/L glucose 24 h prior to experiment.
Drugs and chemicals
2-Deoxy-d-glucose (D6134), mannose (M6020), tunicamycin (T7765), caffeine (27600), 3-methyladenine (M9281), rapamycin (R8781) and mouse anti-β-actin (A5441) primary antibody were purchased from Sigma-Aldrich (St. Louis, MO). Brefeldin A was purchased from Calbiochem (203729). The following rabbit primary antibodies were obtained from Cell Signaling Technology (Danvers, MA): Grp78 (3177), phospho-eif2a (3597), beclin (3738), LC3B (2775S) and GYS1 (15B1). The mouse primary antibodies CHOP (5554) and PYGB (sc-81751) were purchased from Cell Signaling Technology (Danvers, MA) and Santa Cruz Biotechnology Inc. (Dallas, TX), respectively. Horseradish peroxidase-conjugated anti-rabbit (W4011) and anti-mouse (W4021) secondary antibodies were purchased from Promega (Madison, WI). Primary anti-glycogen antibody was a kind gift from Dr. Otto Baba (Department of Hard Tissue Engineering, Tokyo Medical and Dental University, Tokyo, Japan). Alexa Fluor 555 goat anti-mouse secondary antibody was purchased from Invitrogen (Grand Island, NY, A21424).
Cytotoxicity assay
Cells were incubated for 24 h at 37 °C in 5 % CO2, at which time drug treatments began and continued for 72 h. At this time, attached cells were trypsinized and combined with their respective culture media followed by centrifugation at 400 g for 5 min. The pellets were resuspended in 1 mL of Hanks’ balanced salt solution (HBSS) (Mediatech) and analyzed with a Vi-Cell cell viability analyzer (Beckman Coulter) based on trypan blue exclusion. Results were shown as the percentages of dead cells out of total cells counted. Data were the averages of triplicate samples ±SD from one representative experiment out of at least three independent analyses unless otherwise indicated.
Western blot analysis
Cells were seeded onto six-well plates and grown overnight to reach approximately 50 % confluence. Following drug exposure for 24 h, cells were harvested and lysed with buffer (100 mM Tris–HCl at pH 7.4, 1 % SDS, protease inhibitor cocktail and phosphatase inhibitor cocktail 2 from Sigma-Aldrich). Protein concentrations of each sample were determined using a Micro BCA Protein Assay Kit (Thermo Scientific) according to the manufacturer’s instructions, and equal amounts of proteins were loaded onto 4–15 % Tris–HCl gradient gels (Bio-Rad). After SDS–PAGE, proteins were transferred onto a polyvinylidene fluoride (PVDF) membrane (Millipore), blocked with 5 % milk and probed with primary antibodies overnight (except 1 h for β-actin). The membrane was washed and probed with secondary antibodies for 1 h and washed again. Membrane was then incubated with SuperSignal West Pico or Femto Chemiluminescent Substrate (Thermo Scientific), and protein intensity was visualized on Blue Lite Autorad Films (ISC BioExpress). All primary antibodies were used at a dilution of 1:1,000 except for β-actin (1:10,000). Representative blots from at least three independent experiments were shown unless otherwise indicated. All parallel blots shown were developed on the same membranes. However, for clear presentation, irrelevant samples in some of the figures were cut out and the remaining blots presented. Quantification of blot intensity was performed using ImageJ (National Institutes of Health, Bethesda, MD).
qPCR
Total cellular RNAs were extracted by the RNeasy Plus Mini Kit (QIAGEN, Valencia, CA, 74134), DNase treated with Turbo DNase Free (Invitrogen) and reverse-transcribed using the ImProm-II Reverse Transcription System (Promega, A3800), according to manufacturer’s instructions. qPCR experiments were performed on an ABI 7300 Real-Time PCR System (Life Technologies) using PerfeCTa SYBR Green FastMix, ROX (Quanta Biosciences, Gaithersburg, MD, 95073-250). Primer sequences used are as follows: human β-actin forward, 5′-AGAGCTACGAGCTGCCTGAC-3′, and reverse, 5′-AGCACTGTGTTGGCGTACAG-3′; human Grp78 forward, 5′-GGAATTCCTCCTGCTCCTCGT-3′, and reverse, 5′-CAGGTGTCAGGCGATTCTGG-3′; human CHOP forward, 5′-GCGCATGAAGGAGAAAGAAC-3′, and reverse, 5′-TCACCATTCGGTCAATCAGA-3′; human PYGB forward, 5′-TGTGCCCAGGACTGTTATGA-3′, and reverse, 5′-TTTCAACCTGTCACCCACAA-3′; and human GYS forward, 5′-CTCTCCGACCTTCTGGACTG-3′, and reverse, 5′-GGCTCGTAGGTGAAGTGCTC-3′. Melting curve analysis was performed to verify specificity of products as well as water and RT controls in every run. Data were analyzed using the ΔCt method as in Mutlu et al. [15]. Target gene expression was normalized to β-actin by taking the difference between Ct values for target genes and β-actin (ΔΔCt value). These values then were calibrated to that of the control sample to give the Ct value. The fold target gene expression is given by the formula: 2−ΔΔCt. Graphs given show fold change induced in treated over untreated control cells of each cell line, unless otherwise specified.
UPR PCR array
The RT2 Profiler Human Unfolded Protein Response PCR Array (384-well plate format) was purchased from QIAGEN (previously SABiosciences, PAHS-089E-4). Total RNAs were extracted as mentioned above, and the RT2 First Strand Kit (QIAGEN, 330401) was used to reverse-transcribe mRNAs. Gene expression was measured via qPCR using the RT2 qPCR Mastermix (QIAGEN, 330529) on an ABI 7900HT Fast Real-Time PCR System (Life Technologies). PCR array data were analyzed using the RT2 Profiler PCR Array Data Analysis tools available on the manufacturer’s website.
Uptake
Cells were seeded and cultured for 24 h under normoxic conditions in low-glucose (2 g/L) DMEM. The medium was then replaced with fresh “hot” (300 mmol/L cold 2-DG and 1 mCi3H 2-DG) low-glucose DMEM, and the sample was incubated for 5 min under normoxia. Next, the hot medium was removed, cells were washed three times with fresh, glucose- and serum-free medium, and the cells were lysed with 0.5 mL of 1 N NaOH, collected in 1.5 mL Eppendorf tubes and gently vortexed. A 0.25 mL sample was used for protein analysis by Micro BCA Protein Assay Kit (Thermo Scientific). Radioactivity from the remaining sample was counted using a Packard CA2000 liquid scintillation spectrometer. Radioactivity was measured as counts per minute (CPM) and normalized to protein.
Fluorophore-assisted carbohydrate electrophoresis (FACE)
Cells were cultured until 90 % confluent, harvested in methanol and dried under N2. LLOs were recovered in chloroform/methanol/water (10:10:3), hydrolyzed, modified with 7-amino-l,3-naphthalenedisulfonic acid (ANDS) fluorophore and analyzed by fluorophore-assisted carbohydrate electrophoresis (FACE) as previously described [16].
siRNA
Anti-luciferase siRNA 1 (siLuc, D-002050-01) and ON-TARGETplus SMARTpool siRNAs against PYGB (siPYGB, L-009587) were obtained from Thermo Scientific (Rockford, IL). Cells were seeded into 6-well plates and cultured for 24 h to reach ~60 % confluence using antibiotic-free media. Then, cells were transfected with anti-Luc (control) or siPYGB using DharmaFECT siRNA transfection reagent #1 (Dharmacon). Twenty-four hours after transfection, cells were collected and reseeded onto 6-well or 24-well plates and drug-treated for immunoblotting or cytotoxicity analyses, respectively. Lowest concentrations of siRNAs that could produce saturated knockdown efficiency were used.
Glycogen staining
In a method adapted from Louzao et al. [17], cells were seeded on coverslips in 6-well plates, grown overnight, then washed three times with PBS and changed to either glucose-free media or control media (2 g/L glucose) for 24 h. Cells were washed and then fixed with 4 % paraformaldehyde in PBS for 15 min at RT and then permeabilized with 2 % BSA-0.2 % Triton X-100 PBS for 5 min on ice. After three PBS washes, non-specific binding was blocked with 2 % BSA-PBS for 1 h at RT. Cells were incubated with anti-glycogen antibody (at 1:100 dilution) in 2 % BSA-PBS overnight at 4 °C. The following day, cells were washed and incubated with Goat Anti-mouse IgG Alex Flour 555 in 2 % BSA-PBS for 1 h at RT at a 1:500 dilution. This step was followed with PBS washes, and finally coverslips were mounted on slides using ProLong Gold Antifade Reagent with DAPI medium (Life Technologies, Grand Island, NY, P-36931). Slides were allowed to dry overnight in the dark and then imaged on a fluorescent microscope. Images shown are from one representative experiment out of at least three independent analyses.
Statistics
Statistical analyses were performed by two-way analysis of variance (ANOVA), followed by Bonferroni post-test, and a P value <0.05 was considered significant.
Results
An inverse relationship between resistance to 2-DG and GS
2-DG has previously been shown to result in toxicity in certain cancer cell lines under normoxic conditions, which was found to be due to interference with N-linked glycosylation and ensuing ER stress [9, 18]. One of these cancer cell lines that is sensitive to 2-DG under normoxia (human pancreatic 1420) was used to isolate twofold (14DG2) and fivefold (14DG5) resistant variants. Surprisingly, the order of sensitivity to 2-DG was reversed when these cell lines were placed under GS conditions (Fig. 1a, b). Thus, although 2-DG has been used to mimic GS, the inverse relationship observed here suggests fundamental differences between these two modes of glucose restriction.
Fig. 1.
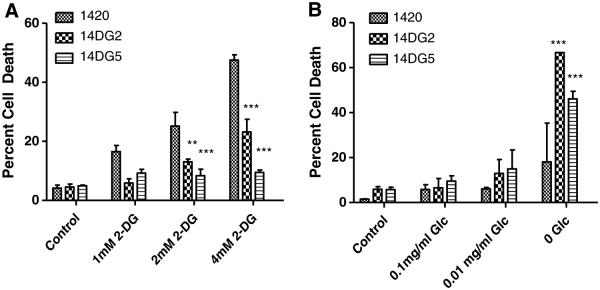
An inverse relationship between resistance to 2-DG and GS. a 1420, 14DG2 and 14DG5 cell lines were treated with the indicated doses of 2-DG for 72 h in normoxia, and percentage dead cells were assayed by trypan blue exclusion. The bars represent the average of triplicate samples ±SD. b 1420, 14DG2 and 14DG5 cell lines were challenged with the indicated levels of glucose for 72 h in normoxia, and percentage dead cells were assayed by trypan blue exclusion. The bars represent the average of triplicate samples ±SD. ***P < 0.001 and **P < 0.01, compared to 1420
2-DG but not GS toxicity correlates with induction of UPR
As mentioned above, in its activity as an analog of glucose, 2-DG blocks glycolysis while through its role as a mannose mimetic, it obstructs glycosylation, thereby inducing ER stress and subsequently activating the UPR. Activation of this pathway, as measured by Grp78 induction, was previously found to be greater in the 2-DG-sensitive cell line than in an intrinsically resistant cell line [9]. Similarly, here we find that when treated with 2-DG, cell line 1420 displayed a robust induction of UPR markers, Grp78, p-eif2α and CHOP, while in 14DG2 activation of these proteins was blunted (Fig. 2a). Moreover, in the most resistant cell line, 14DG5, little to no UPR induction was observed at 1 mM of 2-DG (a dose where UPR was induced in the other two cell lines). These observations were further corroborated via qPCR in that 2-DG-induced Grp78 and CHOP mRNA were also found to be highest in the sensitive cell line (Fig. 2b). Thus, lower UPR, indicative of lower ER stress, correlates with lower cell death in response to 2-DG.
Fig. 2.

2-DG but not GS toxicity correlates with induction of UPR. a Cells were treated with the indicated doses of 2-DG for 24 h in normoxia and then harvested, and immunoblotting was performed to detect protein levels of Grp78, phospho-eif2a and CHOP. β-Actin was used as a loading control. b mRNA levels of Grp78 and CHOP were determined by qPCR in cells treated for 24 h with 1 mM 2-DG, normalized to β-actin and shown as fold induction of treated over untreated control samples. The bars represent the average of duplicate samples. ***P < 0.001 as compared with 1420. c Cells were treated with GS for 24 h in normoxia and then harvested, and immunoblotting was performed to detect protein levels of Grp78, phospho-eif2α and CHOP. β-Actin was used as a loading control. d mRNA levels of Grp78 and CHOP were determined by qPCR in cells treated for 24 h with GS and normalized to β-actin and shown as fold induction of treated over untreated control samples. The bars represent the average of duplicate samples
Similar to 2-DG, GS is also known to cause ER stress by limiting the availability of glycosylation precursor sugars. However, no significant differences were observed in the induction of Grp78, p-eif2α and CHOP protein or Grp78 and CHOP mRNA when these cell lines were placed under the conditions of GS (Fig. 2c, d). These latter results indicate that unlike treatment with 2-DG, differences in ER stress and/or UPR cannot account for differential sensitivity of these cell lines to GS. These data further highlight and support our hypothesis of fundamental differences in tumor cell response to therapeutic (2-DG) and physiologic (GS) forms of glucose restriction.
Mechanisms of resistance to 2-DG differ in cell lines 14DG2 and 14DG5
Previously, we reported that intrinsic resistance to 2-DG in pancreatic cancer cell line 1469 correlates with lower 2-DG uptake and decreased UPR when compared with cell line 1420 [19]. Based on this observation and the findings presented in Figs. 1 and 2, 2-DG uptake was evaluated in the cell lines selected for resistance using a tritiated analog of 2-DG. Similar to previous findings in 1469, there was reduced uptake in 14DG2 as compared with 1420, correlating with resistance to 2-DG (Fig. 3a). However, 14DG5, selected for resistance to high-dose 2-DG, surprisingly showed greater uptake than the parental cell line, indicating that reduced uptake is not a generalized mechanism of resistance to 2-DG.
Fig. 3.

Mechanisms of resistance to 2-DG differ in cell lines 14DG2 and 14DG5. a 1420, 14DG2 and 14DG5 cells were exposed to tritiated 2-DG for 5 min. Samples were lysed, and radioactivity was measured by a liquid scintillation counter. Samples were normalized to protein that was quantified by the BCA method. The bars represent the average of duplicate samples ±SD. *P < 0.05, compared to 1420. b 1420, 14DG2 and 14DG5 cell lines were treated with the indicated doses of TM for 72 h in normoxia, and percentage dead cells were assayed by trypan blue exclusion. The bars represent the average of triplicate samples ±SD. **P < 0.01, compared to 1420. c Cells were treated with the indicated doses of TM for 24 h in normoxia and then harvested, and immunoblotting was performed to detect protein levels of Grp78, phospho-eif2α and CHOP. β-Actin was used as a loading control. d mRNA levels of Grp78 and CHOP were determined by qPCR in cells treated for 24 h with 0.1 μg/mL TM and normalized to β-actin and shown as fold induction of treated over untreated control samples. The bars represent the average of duplicate samples. e 1420, 14DG2 and 14DG5 cell lines were treated with the indicated doses of BFA for 72 h in normoxia, and percentage dead cells were assayed by trypan blue exclusion. The bars represent the average of triplicate samples ±SD. f Cells were treated with BFA for 24 h in normoxia and then harvested, and immunoblotting was performed to detect protein levels of Grp78, phospho-eif2α and CHOP. β-Actin was used as a loading control. g mRNA levels of Grp78 and CHOP were determined by qPCR in cells treated for 24 h with 100nM BFA and normalized to β-actin and shown as fold induction of treated over untreated control samples
Since autophagy has been shown to be a protective mechanism when 1420 cells were treated with 2-DG [20], we analyzed the effect of this survival process in the resistant cell lines. Interestingly, protein levels of beclin and cleaved LC3B, autophagy markers, were found not to be increased in response to 2-DG treatment in the cell lines tested (Figure S1a). Additionally, rapamycin, an autophagy inducer, did not enhance resistance in 14DG2 and 14DG5 (Figure S1c). Conversely, use of 3-MA, an inhibitor of autophagy, did not sensitize these cell lines to 2-DG treatment (Figure S1b). In contrast, as was reported previously where autophagy was shown to act as a protective mechanism, we found that 3-MA increased the sensitivity of 1420 to 2-DG (Figure S1b). In agreement with this result, rapamycin appeared to protect this cell line, suggesting that autophagy prevents even greater cell death in 1420 cells (Figure S1c).
In order to confirm that the mechanisms of resistance to 2-DG in both 14DG2 and 14DG5 involve ER stress pathways, cells were challenged with tunicamycin (TM), a classic ER-stress-inducing agent, that directly inhibits glycosylation by blocking the first step in LLO synthesis, and both 1420 and 14DG2 exhibited similar levels of cytotoxicity and strong induction of Grp78, p-eif2α and CHOP (Fig. 3b–d) [21]. Conversely, 14DG5 was found to be comparatively resistant to TM and did not induce Grp78, p-eif2α or CHOP as highly as 1420 or 14DG2 (Fig. 3b–d). These latter findings in 14DG5 led us to test whether it has acquired the ability to resist ER stress in general. To address this question, brefeldin A (BFA), an agent that induces ER stress by inhibiting the transport of proteins from the ER to the Golgi, was used [22]. Little difference in sensitivity and induction of the UPR markers was found between all three cell lines when using BFA, which differs from both 2-DG and TM in not interfering with glycosylation and yet inducing ER stress (Fig. 3e–g). Overall, our results with ER-stress-inducing agents suggest that 14DG2 and 14DG5 employ different mechanisms of resistance in response to 2-DG. Since 14DG2 shows similar levels of sensitivity as its parental cell line to TM and BFA, lower uptake of 2-DG coincides best with its resistance (Fig. 3a). In contrast, the greater accumulation of 2-DG in 14DG5 as compared to 1420 indicates that mechanisms other than uptake must account for its resistance. Thus, these data, together with the findings of blunted responses to agents that interfere with glycosylation, suggest that the mechanism(s) of resistance to 2-DG in 14DG5 lies upstream of ER stress/UPR.
Resistance correlates with increased production of LLOs
It has previously been reported that when human pancreatic tumor cell lines 1469 and 1420 were treated with 2-DG, intrinsic resistance to this sugar analog in 1469 correlated with decreased reduction of fully formed LLOs as compared with that found in 2-DG-sensitive 1420. Here, we find that 2-DG at 2 mM decreased the levels of G3M9Gn2-P-P-dolichol (G3M9), the fully formed LLO, in 14DG2 but not to the degree observed previously in 2-DG-treated 1420 cells where the dose of 2-DG was markedly lower (0.5 mM) [9]. In the more resistant cell line 14DG5, LLO levels remained completely unaffected even at a higher dose of 2-DG (5 mM) (Fig. 4a). Additionally, the two 2-DG-resistant variants display basal upregulation of fully formed LLOs (G3M9) as compared to the parental cell line (1420) (Fig. 4a). Moreover, amplified mRNA levels of genes related to cholesterol synthesis, including sterol regulatory element-binding transcription factor 1 (SREBF1), sterol regulatory element-binding transcription factor 2 (SREBF2), insulin-induced gene 1 (INSIG1), insulin-induced gene 2 (INSIG2), SREBF chaperone (SCAP), membrane-bound transcription factor peptidase site 1 (MBTPS1) and membrane-bound transcription factor peptidase site 2 (MBTPS2), were found in the resistant variants, but not in the parental cell line (Fig. 4b). This pathway is responsible for the generation of dolichol, the lipid anchor onto which LLOs are synthesized prior to their transfer to polypeptides. Taken together, our data indicate multiple alterations in biologic processes related to ER stress between sensitive and resistant cells. Higher intrinsic levels of LLOs and transcriptional upregulation of dolichol synthesis involving SREBF2 correlate with insensitivity to 2-DG and TM in 14DG5 and to 2-DG in 14DG2.
Fig. 4.

Resistance correlates with increased production of LLOs. a Cells were treated with either 2 or 5 mM 2-DG as indicated for 24 h, followed by extraction and FACE of LLOs. The standard oligosaccharides used in these studies are as follows: G4 to G7, glucose oligomers; G3M9, mature oligosaccharide (G3M9Gn2). Quantification of lanes can be seen below. b mRNA levels of the indicated cholesterol synthesis pathway components were measured on an UPR PCR array using qPCR. Bars represent the average fold change from two independent experiments of the mRNA levels of untreated cells. *P < 0.05
Sensitivity to GS correlates with reduced levels of PYGB
Glycogen storage and utilization has been recognized as a means for supplying glucose under environmental conditions of nutrient limitation. The finding of differential responses to GS in cell lines that are sensitive and resistant to 2-DG leads us to investigate glycogen metabolism in these cell lines. Through Western blot analysis, the levels of the enzyme required for the synthesis of glycogen, glycogen synthase (GYS), were found to be slightly reduced in the 2-DG-resistant cell lines as compared with 1420 although all three cell lines displayed similar glycogen staining under control conditions (Fig. 5a, c). However, dramatically decreased protein and mRNA levels of the enzyme required for the breakdown of glycogen for its utilization, glycogen phosphorylase (PYGB), were found in the 2-DG-resistant cell lines that are sensitive to GS (Fig. 5a, b). In further support of the interpretation that reduced PYGB plays a role in sensitivity to GS, we find that after 24 h in this condition, 14DG2 and 14DG5 maintained near control levels of glycogen, suggesting that these cell lines cannot utilize glycogen when deprived of glucose (Fig. 5c). On the contrary, cell line 1420 shows reduced glycogen staining after 24 h GS, indicating its ability to break down glycogen that correlates with higher PYGB levels in this cell line. Moreover, when caffeine was used to inhibit PYGB in 1420, its sensitivity to GS was found to be increased, further supporting a survival role for glycogen breakdown (Fig. 5d) [23]. To confirm the caffeine data, siRNA directed at PYGB also significantly increased the sensitivity of 1420 cells to GS (Fig. 5e, f).
Fig. 5.


Reduced glycogen breakdown correlates with reduced levels of PYGB as well as sensitivity to GS. a Immunoblotting was performed to detect basal protein levels of GYS and PYGB in the three cell lines. β-Actin was used as a loading control. b mRNA levels of GYS and PYGB were determined by qPCR in untreated cells and normalized to β-actin. The bars represent the average of duplicate samples ±SD. c Cells were grown on coverslips in control or glucose-free media overnight and then incubated with an anti-glycogen monoclonal antibody (pink) and mounted with DAPI (blue). Slides are imaged at 20× and 60×. Scale bars on 20× images are 100 μm, and scale bars on 60× images are 20 μm. d 1420 and 14DG2 cell lines were treated with 5 mM caffeine, GS or the combination for 72 h in normoxic conditions, and the percentage dead cells were assayed by trypan blue exclusion. The bars represent the average of triplicate samples ±SD. ***P < 0.001, compared to 1420. e 1420 and 14DG2 cell lines were transfected with 20 nM siRNA directed at PYGB or luciferase as a control for 24 h. Cells were then treated with GS for 72 h in normoxic conditions, and the percentage dead cells were assayed by trypan blue exclusion. The bars represent the average of duplicate samples ±SD. ***P < 0.001, compared to 1420 treated with GS alone. f Immunoblotting was performed to detect PYGB protein levels after siRNA transfection
14DG2 and 14DG5 cells that were maintained in the absence of 2-DG for extended periods (>6 weeks), termed 14DG2NM and 14DG5NM, respectively, display nearly complete and partial reversals, respectively, in their sensitivity to GS. This correlates with an increase in PYGB protein levels in these cell lines as compared with the levels found in 14DG2 and 14DG5 (Supplemental Fig. 2b, and c), suggesting that maintenance of the resistant cell lines in 2-DG is responsible (at least in part) for the downregulation of PYGB. Additionally, 14DG2NM reverts to a nearly parental phenotype in that it regains 2-DG sensitivity; however, 14DG5NM maintains a similar level of resistance to 2-DG as 14DG5 (Supplemental Fig. 2a). These data again support our previous assertion that there are fundamental differences between 2-DG treatment and GS. Overall, our data indicate that impairment in glycogen breakdown, in the form of downregulation of PYGB in 2-DG-resistant cells, renders them sensitive to GS. Moreover, in cells with sufficient PYGB, blockage of this enzyme leading to sensitivity to GS identifies it as a possible target for therapy.
Discussion
2-DG’s dual activities, inhibiting both glycolysis and glycosylation, underlie its traditional use as a glucose deprivation mimetic. However, the results presented here of an inverse relationship between cells that have acquired resistance to 2-DG treatment and their increased sensitivity to GS indicate that there are intrinsic differences between these two types of glucose restriction (Fig. 1). This dissimilarity is highlighted by the finding that 2-DG differentially induces UPR in 2-DG-sensitive versus 2-DG-resistant cells, whereas GS does not. Variances in response to therapeutic versus physiologic forms of glucose restriction may be better understood by considering how each condition affects glucose metabolism. It has been shown that 2-DG can be fraudulently incorporated into LLOs, thereby interfering with their normal synthesis and subsequently causing aberrant protein folding resulting in ER stress and UPR activation [9, 24–26]. Although GS also induces ER stress, its mechanism differs from that of 2-DG in that 2-DG is falsely incorporated into LLOs, while GS reduces the availability of LLO sugar precursors, thus producing proteins that contain a reduced number of N-glycans and/or smaller LLO species [27]. Moreover, our findings that under GS, 2-DG-sensitive and 2-DG-resistant cell lines undergo similar UPR activation but differential sensitivity to this type of glucose restriction indicate that mechanisms other than ER stress/UPR may be responsible for cell death (Figs. 1b, 2c, d). This is in contrast to 2-DG-treated cells where increased induction of UPR (indicating increased ER stress) correlates with cell death (Figs. 1a, 2a, b).
UPR is generally considered to be a cell-protective mechanism. However, it is known that with increased and prolonged activation, cells are signaled to undergo UPR-mediated apoptosis [28]. Indeed, here we show that excessively high UPR induction observed in the sensitive cell line, 1420, when treated with 2-DG represents a shift from the protective to the apoptotic arm of the response (Fig. 2a, b). In contrast, 2-DG-resistant cell lines showed little to no increase in UPR when challenged with similar 2-DG concentrations (Fig. 2a, b). The latter result suggests that pathways upstream of ER stress may be responsible for resistance to 2-DG, and in the case of 14DG2, decreased 2-DG uptake accounts (at least in part) for its level of resistance (Fig. 3a). Previously, it was shown that the auto-degradative process of autophagy acts as a protective mechanism when 1420 cells were treated with 2-DG [20]. In the present study, we confirmed these results but find that in 14DG2 and 14DG5, autophagy is not contributing to their resistance to 2-DG (Figure S1).
Moreover, when 14DG2 was challenged with the classical ER stressors TM and BFA, it was found not to be resistant to either, indicating that the major mechanisms of resistance to 2-DG in this cell line appear to be due to reduced uptake. On the other hand, 2-DG uptake in 14DG5 could not explain resistance to this sugar analog since it was found to accumulate to a higher level in this cell line as compared with the parental cell line. Additionally, we find that 14DG5 is also resistant to TM, an agent that induces ER stress by interfering with LLO synthesis, but not to BFA that blocks egress of fully formed glycoproteins from the ER (Fig. 3). These findings indicate that the mechanism by which ER stress is induced dictates resistance to 2-DG in this cell line. Collectively, our data suggest that resistance to 2-DG in 14DG5 appears to be due to mechanisms downstream of uptake but upstream of ER stress/UPR, which are likely related to processes of LLO synthesis and N-linked glycosylation.
Although reduced 2-DG uptake correlates with resistance in 14DG2, mechanisms related to LLO synthesis and N-linked glycosylation also appear to play a role in resistance to 2-DG in this cell line as well as in 14DG5. This idea is supported by our findings where 2-DG more strongly inhibited LLO production in the sensitive cell line than it did in the resistant variants (Fig. 4a). The increased basal fully formed LLOs (G3M9) in 14DG2 and 14DG5 as compared with 1420 also support this idea. Furthermore, genes related to cholesterol synthesis were found to be upregulated in 14DG2 and 14DG5 as compared with the parental cell line (Fig. 4b). This pathway is critical for the production of dolichol, an integral precursor of N-linked glycosylation [29]. The upregulation in cholesterol gene expression and increased LLO synthesis found in resistant cell lines suggests that this is a compensatory mechanism to deal with 2-DG’s glycosylation interference. However, since 14DG2 cells are not resistant to TM in spite of their increased LLO levels, this mechanism may not play a substantial role in this cell line’s 2-DG resistance. These correlative data may be better explained by further exploration of the relationship between the cholesterol synthesis pathway, LLO generation, UPR and 2-DG resistance. Overall, the results presented here suggest that there are multiple mechanisms that contribute to resistance to 2-DG, and manipulation of these pathways may enhance the effectiveness of 2-DG in a clinical setting. As an example, since we observed an increase in cholesterol gene expression in our resistant cell lines, inhibiting cholesterol synthesis with agents such as statins could be helpful when treating patients with 2-DG [30]. Additionally, modulation of the UPR with agents, such as versipelostatin, that inhibit Grp78 and have shown effectiveness in preclinical in vivo models might also augment 2-DG’s clinical use since differences in UPR induction were found between 2-DG-sensitive and 2-DG-resistant cell lines [31].
Similar to data presented here, differences in the induction of autophagy were recently reported when tumor cell lines (including 1420) were treated with 2-DG or GS [32]. Although both forms of glucose deprivation were found to induce ER stress leading to autophagy, 2-DG did so by phosphorylating AMPK via CaMKKβ, whereas GS induced autophagy by phosphorylating AMPK through the canonical pathway of ATP depletion as well as by increasing ROS leading to ERK stimulation [33]. Conversely, 2-DG was found to decrease ROS generation when tested in the same cell line. Furthermore, it was recently reported that cancer cells depleted of an isoform of glycogen phosphorylase increased their generation of ROS [34, 35]. In accord with this report, preliminary data suggest that the lower PYGB levels found in 14DG2 and 14DG5 correlate with increased basal ROS levels as compared with 1420 (data not shown). It remains to be determined whether the increased ROS detected in 14DG2 and 14DG5 leads to sensitivity under GS conditions. However, it follows that if ROS is involved with inducing cell death under GS, the breakdown of glycogen in 1420 cells may, at least in part, be responsible for its survival under this condition. A mechanism that could explain this possibility would be that the glucose provided by glycogen could act as a substrate for the pentose phosphate pathway resulting in production of antioxidants (glutathione), thereby reducing ROS levels and adding to the cell’s ability to survive GS [36].
Although the mechanism by which PYGB is reduced in 14DG2 and 14DG5 cells leading to decreased survival under GS remains unknown, it appears to be related to the selection process involved with 2-DG resistance. This point will be better understood by assessing PYGB in other cell lines selected for 2-DG resistance but is suggestive of an intriguing relationship between resistance to 2-DG and sensitivity to glucose deprivation, which may have widely applicable therapeutic potential. Since during tumorigenesis there will likely be locations and periods of time in which cancer cells outstrip their supply of glucose, survival may then become dependent on the capacity to utilize glycogen stores where the activity of glycogen phosphorylase becomes limiting. The ability to reverse GS resistance in 1420 by inhibition of PYGB is suggestive of a potential therapeutic target (Fig. 5d–f). Moreover, based on an analysis of 59 NCI tumor cell lines, it has been shown that PYGB is the predominant glycogen phosphorylase isoenzyme found in cancer cell lines [37]. Adding to this possibility, it has been reported that treatment with PYGB inhibitors alone under normal glucose conditions results in growth inhibition in most tumor cell lines tested [37]. These findings imply that anticancer treatment may benefit from the addition of glycogen phosphorylase inhibitors [23, 37].
The prevailing hypothesis that cancer cells upregulate glucose usage but also encounter glucose deprivation makes this an attractive pathway to further consider for cancer therapy [38, 39]. 2-DG is a safe yet potent glycolysis and glycosylation inhibitor that is known to preferentially accumulate in cancer cells [40]. Extrapolating from our in vitro findings, clinical use of 2-DG is expected to be hindered by resistance. However, as in data shown here, these 2-DG-resistant cells are likely to be sensitive to glucose deprivation, an environmental condition that the tumor will encounter at some point. Thus, clinical use of 2-DG would be augmented by specific dietary considerations. Overall, our results in distinguishing between these two different forms of glucose deprivation highlight the potential of exploiting glucose restriction for improving the efficacy of cancer therapy.
Supplementary Material
Acknowledgments
We would like to thank Dr. Otto Baba (Department of Hard Tissue Engineering, Tokyo Medical and Dental University, Tokyo, Japan) for kindly providing the anti-glycogen antibody. We are grateful to the following persons from University of Miami for their technical support on the following: Dr. Eli Gilboa and Dr. Mansoor Ahmed for radioactive uptake assays, Dr. Enrique Mesri for qPCR and David Siefker for fluorescent microscopy. We also want to acknowledge the following for thoughtful discussions and insights on this work: Dr. Niramol Savaraj (University of Miami), Dr. Medhi Wangpaichitr (University of Miami) and Dr. Haibin Xi (University of California Los Angeles). This work was supported by National Cancer Institute grant CA37109 and Pap Corps award to TJL and National Institute of General Medical Sciences grant GM38545 to MAL.
Abbreviations
- 2-DG
2-Deoxy-d-glucose
- GS
Glucose starvation
- UPR
Unfolded protein response
- LLO
Lipid-linked oligosaccharide
- ER
Endoplasmic reticulum
- Grp78
Glucose-regulated protein 78 kDa
- PERK
PKR-like ER kinase
- CHOP
C/EBP-homologous protein
- LC3B
Autophagy marker light chain 3
- FACE
Fluorophore-assisted carbohydrate electrophoresis
- GYS
Glycogen synthase 1
- PYGB
Glycogen phosphorylase brain isoform
- TM
Tunicamycin
- BFA
Brefeldin A
- AMPK
AMP-activated protein kinase
- CaMKKβ
Ca2+/calmodulin-dependent protein kinase kinase-beta
- ROS
Reactive oxygen species
- ERK
Extracellular signal-regulated kinases
- SREBF1
Sterol regulatory element-binding transcription factor 1
- SREBF2
Sterol regulatory element-binding transcription factor 2
- INSIG1
Insulin-induced gene 1
- INSIG2
Insulin-induced gene 2
- SCAP
SREBF chaperone
- MBTPS1
Membrane-bound transcription factor peptidase site 1
- MBTPS2
Membrane-bound transcription factor peptidase site 2
- Rapa
Rapamycin
- 3-MA
3-Methyladenine
Footnotes
Electronic supplementary material The online version of this article (doi:10.1007/s00280-013-2358-8) contains supplementary material, which is available to authorized users.
Contributor Information
Katherine B. Philips, Sheila and David Fuente Graduate Program in Cancer Biology, University of Miami Miller School of Medicine, 1550 NW 10th Avenue, Fox Building #406, Miami, FL 33136, USA, KPhilips@med.miami.edu
Metin Kurtoglu, Sylvester Comprehensive Cancer Center, University of Miami Miller School of Medicine, PAP Building, Room 115, 1550 NW 10th Ave, Miami, FL 33136, USA, MKurtoglu@med.miami.edu.
Howard J. Leung, Sheila and David Fuente Graduate Program in Cancer Biology, University of Miami Miller School of Medicine, 1550 NW 10th Avenue, Fox Building #406, Miami, FL 33136, USA, HJLeung@med.miami.edu
Huaping Liu, Sylvester Comprehensive Cancer Center, University of Miami Miller School of Medicine, PAP Building, Room 115, 1550 NW 10th Ave, Miami, FL 33136, USA, HLiu2@med.miami.edu.
Ningguo Gao, Department of Pharmacology, University of Texas Southwestern Medical Center, 6001 Forest Park Rd., Dallas, TX 75390-9041, USA, Ningguo.Gao@utsouthwestern.edu.
Mark A. Lehrman, Department of Pharmacology, University of Texas Southwestern Medical Center, 6001 Forest Park Rd., Dallas, TX 75390-9041, USA, Mark.Lehrman@utsouthwestern.edu
Timothy G. Murray, Department of Ophthalmology, Bascom Palmer Eye Institute, University of Miami, 900 NW 17th St., Miami, FL 33136, USA, TMurray@med.miami.edu
Theodore J. Lampidis, Department of Cell Biology (R-124), University of Miami Miller School of Medicine, 1600 NW 10th Avenue, Rosenstiel Medical Sciences Building #4026/4027, P.O. Box 016960, Miami, FL 33101, USA, TLampidi@med.miami.edu Sylvester Comprehensive Cancer Center, University of Miami Miller School of Medicine, 1475 NW 12th Avenue, P.O. Box 016960, Miami, FL 33101, USA.
References
- 1.Chen J, Russo J. Dysregulation of glucose transport, glycolysis, TCA cycle and glutaminolysis by oncogenes and tumor suppressors in cancer cells. Biochim Biophys Acta. 2012;1826:370–384. doi: 10.1016/j.bbcan.2012.06.004. [DOI] [PubMed] [Google Scholar]
- 2.Dang CH. Links between metabolism and cancer. Genes Dev. 2012;26:877. doi: 10.1101/gad.189365.112. [DOI] [PMC free article] [PubMed] [Google Scholar]
- 3.Ying H, Kimmelman A, Lyssiotis C, Hua S, Chu G, Fletcher-Sananikone E, Locasale J, Son J, Zhang H, Coloff J, Yan H, Wang W, Chen S, Viale A, Zheng H, Paik J, Lim C, Guimaraes A, Martin E, Chang J, Hezel A, Perry S, Hu J, Gan B, Xiao Y, Asara J, Weissleder R, Wang Y, Chin L, Cantley L, DePinho R. Oncogenic kras maintains pancreatic tumors through regulation of anabolic glucose metabolism. Cell. 2012;149:656–670. doi: 10.1016/j.cell.2012.01.058. [DOI] [PMC free article] [PubMed] [Google Scholar]
- 4.Papetti M, Herman IM. Mechanisms of normal and tumor-derived angiogenesis. Am J Physiol Cell Physiol. 2002;282:C947–C970. doi: 10.1152/ajpcell.00389.2001. [DOI] [PubMed] [Google Scholar]
- 5.Izuishi K, Kato K, Ogura T, Kinoshita T, Esumi H. Remarkable tolerance of tumor cells to nutrient deprivation: possible new biochemical target for cancer therapy. Cancer Res. 2000;60:6201. [PubMed] [Google Scholar]
- 6.Maher JC, Wangpaichitr M, Savaraj N, Kurtoglu M, Lampidis TJ. Hypoxia-inducible factor-1 confers resistance to the glycolytic inhibitor 2-deoxy-D-glucose. Mol Cancer Ther. 2007;6:732. doi: 10.1158/1535-7163.MCT-06-0407. [DOI] [PubMed] [Google Scholar]
- 7.Raez LE, Papadopoulos K, Ricart AD, Chiorean EG, DiPaola RS, Stein MN, Rocha Lima CM, Schlesselman JJ, Tolba K, Langmuir VK, Kroll S, Jung DT, Kurtoglu M, Rosenblatt J, Lampidis TJ. A phase I dose-escalation trial of 2-deoxy-D-glucose alone or combined with docetaxel in patients with advanced solid tumors. Cancer Chemother Pharmacol. 2012;71:523–530. doi: 10.1007/s00280-012-2045-1. [DOI] [PubMed] [Google Scholar]
- 8.Maher JC, Krishan A, Lampidis TJ. Greater cell cycle inhibition and cytotoxicity induced by 2-deoxy-D-glucose in tumor cells treated under hypoxic vs aerobic conditions. Cancer Chemother Pharmacol. 2004;53:116. doi: 10.1007/s00280-003-0724-7. [DOI] [PubMed] [Google Scholar]
- 9.Kurtoglu M, Gao N, Shang J, Maher JC, Lehrman MA, Wangpaichitr M, Savaraj N, Lane AN, Lampidis TJ. Under normoxia, 2-deoxy-D-glucose elicits cell death in select tumor types not by inhibition of glycolysis but by interfering with N-linked glycosylation. Mol Cancer Ther. 2007;6:3049. doi: 10.1158/1535-7163.MCT-07-0310. [DOI] [PubMed] [Google Scholar]
- 10.Lehrman MA. Stimulation of N-linked glycosylation and lipid-linked oligosaccharide synthesis by stress responses in metazoan cells. Crit Rev Biochem Mol Biol. 2006;41:51. doi: 10.1080/10409230500542575. [DOI] [PubMed] [Google Scholar]
- 11.Zhang K, Kaufman RJ. Protein folding in the endoplasmic reticulum and the unfolded protein response. Handb Exp Pharmacol. 2006;172:69. doi: 10.1007/3-540-29717-0_3. [DOI] [PubMed] [Google Scholar]
- 12.Lee AS. GRP78 induction in cancer: therapeutic and prognostic implications. Cancer Res. 2007;67:3496–3499. doi: 10.1158/0008-5472.CAN-07-0325. [DOI] [PubMed] [Google Scholar]
- 13.Chakrabarti A, Chen AW, Varner JD. A Review of the mammalian unfolded protein response. Biotechnol Bioeng. 2011;108:2777–2793. doi: 10.1002/bit.23282. [DOI] [PMC free article] [PubMed] [Google Scholar]
- 14.Zinszner H, Kuroda M, Wang X, Batchvarova N, Lightfoot RT, Remotti H, Stevens JL, Ron D. CHOP is implicated in programmed cell death in response to impaired function of the endoplasmic reticulum. Genes Dev. 1998;12:982. doi: 10.1101/gad.12.7.982. [DOI] [PMC free article] [PubMed] [Google Scholar]
- 15.Mutlu AD, Cavallin LE, Vincent L, Chiozzini C, Eroles P, Duran EM, Asgari Z, Hooper AT, La Perle KM, Hilsher C, Gao SJ, Dittmer DP, Rafii S, Mesri EA. In vivo-restricted and reversible malignancy induced by human herpesvirus-8 KSHV: a cell and animal model of virally induced Kaposi’s sarcoma. Cancer Cell. 2007;11:245. doi: 10.1016/j.ccr.2007.01.015. [DOI] [PMC free article] [PubMed] [Google Scholar]
- 16.Gao N, Lehrman MA. Non-radioactive analysis of lipid-linked oligosaccharide compositions by fluorophore-assisted carbohydrate electrophoresis. Methods Enzymol. 2006;415:3. doi: 10.1016/S0076-6879(06)15001-6. [DOI] [PubMed] [Google Scholar]
- 17.Louzao MC, Espiña B, Vieytes MR, Vega FV, Rubiolo JA, Baba O, Terashima T, Botana LM. “Fluorescent glycogen” formation with sensibility for in vivo and in vitro detection. Glycoconj J. 2008;25:503. doi: 10.1007/s10719-007-9075-7. [DOI] [PubMed] [Google Scholar]
- 18.Rutkowski DT, Kaufman RJ. A trip to the ER: coping with stress. Trends Cell Biol. 2004;14:20–28. doi: 10.1016/j.tcb.2003.11.001. [DOI] [PubMed] [Google Scholar]
- 19.Maher JC, Savaraj N, Priebe W, Liu H, Lampidis TJ. Differential sensitivity to 2-Deoxy-D-glucose between two pancreatic cell lines correlates with GLUT1 expression. Pancreas. 2005;30:34. doi: 10.1097/01.mpa.0000153327.46945.26. [DOI] [PubMed] [Google Scholar]
- 20.Xi H, Kurtoglu M, Liu H, Wangpaichitr M, You M, Liu X, Savaraj N, Lampidis TJ. 2-Deoxy-D-glucose activates autophagy via endoplasmic reticulum stress rather than ATP depletion. Cancer Chemother Pharmacol. 2011;67:899. doi: 10.1007/s00280-010-1391-0. [DOI] [PMC free article] [PubMed] [Google Scholar]
- 21.Elbein AD. Inhibitors of the biosynthesis and processing of N-linked oligosaccharides. CRC Crit Rev Biochem. 1984;16:21. doi: 10.3109/10409238409102805. [DOI] [PubMed] [Google Scholar]
- 22.Nebenführ A, Ritzenthaler C, Robinson DG. Brefeldin A: deciphering an enigmatic inhibitor of secretion. Plant Physiol. 2002;130:1102. doi: 10.1104/pp.011569. [DOI] [PMC free article] [PubMed] [Google Scholar]
- 23.Henke BR, Sparks SM. Glycogen phosphorylase inhibitors. Mini Rev Med Chem. 2006;6:845–857. doi: 10.2174/138955706777934991. [DOI] [PubMed] [Google Scholar]
- 24.Kurtoglu M, Maher JC, Lampidis TJ. Differential toxic mechanisms of 2-deoxy-D-glucose versus 2-fluorodeoxy-D-glucose in hypoxic and normoxic tumor cells. Antioxid Redox Signal. 2007;9:1383. doi: 10.1089/ars.2007.1714. [DOI] [PubMed] [Google Scholar]
- 25.Datema R, Schwarz RT. Formation of 2-deoxyglucose-containing lipid linked oligosaccharides. Interference with glycosylation of glycoproteins. Eur J Biochem. 1978;90:505. doi: 10.1111/j.1432-1033.1978.tb12630.x. [DOI] [PubMed] [Google Scholar]
- 26.Merchan JR, Kovács K, Railsback JW, Kurtoglu M, Jing Y, Piña Y, Gao N, Murray TG, Lehrman MA, Lampidis TJ. Antiangiogenic activity of 2-deoxy-D-glucose. PLOS ONE. 2010;5(10):e13699. doi: 10.1371/journal.pone.0013699. doi:10.1371/journal.pone.0013699. [DOI] [PMC free article] [PubMed] [Google Scholar]
- 27.Baumann H, Jahreis GP. Glucose starvation leads in rat hepatoma cells to partially N-glycosylated glycoproteins including alpha 1-acid glycoproteins. Identification by endoglycolytic digestions in polyacrylamide gels. J Biol Chem. 1983;258:3942–3949. [PubMed] [Google Scholar]
- 28.Kim R, Emi M, Tanabe K, Murakami S. Role of the unfolded protein response in cell death. Apoptosis. 2006;11:5. doi: 10.1007/s10495-005-3088-0. [DOI] [PubMed] [Google Scholar]
- 29.Fears R. The contribution of the cholesterol biosynthetic pathway to intermediary metabolism and cell function. Biochem J. 1981;199:1. doi: 10.1042/bj1990001. [DOI] [PMC free article] [PubMed] [Google Scholar]
- 30.Buhaescu I, Izzedine H. Mevalonate pathway: a review of clinical and therapeutical implications. Clin Biochem. 2007;40:575–584. doi: 10.1016/j.clinbiochem.2007.03.016. [DOI] [PubMed] [Google Scholar]
- 31.Park H, Tomida A, Sato S, Tsukumo Y, Yun J, Yamori T, Hayakawa Y, Tsuruo T, Shin-ya K. Effect on tumor cells of blocking survival response to glucose deprivation. J Natl Cancer Inst. 2004;96:1300–1310. doi: 10.1093/jnci/djh243. [DOI] [PubMed] [Google Scholar]
- 32.Xi H, Barredo JC, Merchan JR, Lampidis TJ. Endoplasmic reticulum stress induced by 2-deoxyglucose but not glucose starvation activates AMPK through CaMKKβ leading to autophagy. Biochem Pharmacol. 2013;85:1463–1477. doi: 10.1016/j.bcp.2013.02.037. [DOI] [PubMed] [Google Scholar]
- 33.Mihaylova MM, Shaw RJ. The AMPK signalling pathway coordinates cell growth, autophagy and metabolism. Nat Cell Biol. 2011;13:1016. doi: 10.1038/ncb2329. [DOI] [PMC free article] [PubMed] [Google Scholar]
- 34.Lavoie S, Allaman I, Petit JM, Do KQ, Magistretti PJ. Altered glycogen metabolism in cultured astrocytes from mice with chronic glutathione deficit; relevance for neuroenergetics in schizophrenia. PLoS ONE. 2011;6 doi: 10.1371/journal.pone.0022875. [DOI] [PMC free article] [PubMed] [Google Scholar]
- 35.Favaro E, Bensaad K, Chong M, Tennant D, Ferguson DP, Snell C, Steers G, Turley H, Li J, Günther U, Buffa F, McIntyre A, Harris A. Glucose utilization via glycogen phosphorylase sustains proliferation and prevents premature senescence in cancer cells. Cell Metab. 2012;16:751–764. doi: 10.1016/j.cmet.2012.10.017. [DOI] [PubMed] [Google Scholar]
- 36.Ben-Yoseph O, Boxer PA, Ross BD. Assessment of the role of the glutathione and pentose phosphate pathways in the protection of primary cerebrocortical cultures from oxidative stress. J Neurochem. 1996;66:2329–2337. doi: 10.1046/j.1471-4159.1996.66062329.x. [DOI] [PubMed] [Google Scholar]
- 37.Schnier JB, Nishi K, Monks A, Gorin FA, Bradbury EM. Inhibition of glycogen phosphorylase (GP) by CP-91,149 induces growth inhibition correlating with brain GP expression. Biochem Biophys Res Commun. 2003;309:126–134. doi: 10.1016/s0006-291x(03)01542-0. [DOI] [PubMed] [Google Scholar]
- 38.Shaw RJ. Glucose metabolism and cancer. Curr Opin Cell Biol. 2006;18:598–608. doi: 10.1016/j.ceb.2006.10.005. [DOI] [PubMed] [Google Scholar]
- 39.Gillies RJ, Robey I, Gatenby RA. Causes and consequences of increased glucose metabolism of cancers. J Nucl Med. 2008;49:24S–42S. doi: 10.2967/jnumed.107.047258. [DOI] [PubMed] [Google Scholar]
- 40.Pauwels EKJ, Ribeiro MJ, Stoot JHMB, McCready VR, Bourguignon M, Mazière B. FDG accumulation and tumor biology. Nucl Med Biol. 1998;25:317–322. doi: 10.1016/s0969-8051(97)00226-6. [DOI] [PubMed] [Google Scholar]
Associated Data
This section collects any data citations, data availability statements, or supplementary materials included in this article.