Abstract
SWeep Imaging with Fourier Transformation (SWIFT) with gradient modulation and DC navigator retrospective gating is introduced as a 3D cine magnetic resonance imaging (MRI) method for the lung. The quasi-simultaneous excitation and acquisition in SWIFT enabled extremely high sensitivity to the fast-decaying parenchymal signals (TE=~4 μs), which are invisible with conventional MRI techniques. Based on respiratory motion information extracted from DC navigator signals, the SWIFT data were reconstructed to 3D cine images with 16 respiratory phases. To test the capability of the proposed technique, rats exposed to > 95% O2 for 60 hours for induction of acute respiratory distress syndrome (ARDS), were imaged and compared with normal rat lungs (N=7 and 5 for ARDS and normal group, respectively). SWIFT images showed lung tissue density difference along the gravity direction. In the cine SWIFT images, parenchymal signal drop at the inhalation phase was consistently observed for both normal and ARDS rats due to inflation of the lung (i.e. decrease of the proton density), but the drop was less for ARDS rats. Depending on the respiration phase and lung region, the lungs from the ARDS rats showed 1–24% higher parenchymal signal intensities relative to the normal rat lungs, which would be mainly from accumulation of extravascular water (EVLW). Those results demonstrate that SWIFT has high enough sensitivity for detecting the lung proton density changes due to gravity, different respiration phases and accumulation of EVLW in the rat ARDS lungs.
Keywords: Magnetic resonance imaging (MRI), Ultrashort echo time, Sweep imaging with Fourier transform (SWIFT), Retrospective gating, Gradient modulation, Lung, Acute respiratory distress syndrome (ARDS), Extravascular lung water (EVLW)
1. INTRODUCTION
Magnetic resonance image (MRI) is a powerful tool for medical research and clinical diagnosis due to its capability of soft tissue visualization. However, MRI currently plays a limited role in lung parenchymal imaging because of the inherent difficulties: low proton density, extremely fast signal decay and respiratory motion. Large air content in the lung results in low water (proton) density which is the signal source of MRI. In addition to the low proton density, air-tissue interfaces in alveoli accelerate signal decay due to magnetic susceptibility difference between air and lung parenchyma1,2, making it difficult to preserve lung tissue signals with conventional MRI techniques. Moreover, in lung MRI, respiratory motion management is essential to image fine structures such as distal lung tissue. In general, to obtain high quality lung images, respiratory management is performed with data acquisition synchronized with physiological monitoring or, for human imaging, breath-holding when possible.
SWeep Imaging with Fourier Transform (SWIFT) is one type of ultrashort echo time (UTE) MRI sequences3. In SWIFT, signal excitation and acquisition are performed quasi-simultaneously (in a time-shared manner) by using a gapped frequency-modulated (FM) pulse; thereby, achievable echo time (TE) is nearly zero (order of microsecond). SWIFT was previously implemented to lung imaging of a mouse model of breast cancer metastasis to the lung and showed much higher sensitivity to parenchymal signals than the conventional gradient echo (GRE) sequence4. In addition to the high sensitivity to fast-decaying signals, the extremely short TE in SWIFT made it tolerant to magnetic susceptibility effects, resulting in clear visualization of distal lung space.
Acute Respiratory Distress Syndrome (ARDS) is a frequent and serious condition that requires care with mechanical ventilation. A major characteristic of ARDS is protein rich pulmonary edema. The accumulation of pulmonary edema fluid can be measured as extravascular lung water (EVLW). While evaluation of EVLW is useful to predict outcome5, guide fluid therapy6, ventilator strategy7 and monitor the effectiveness of new treatments, currently available methods for measuring EVLW8 are invasive and require specialized vascular catheters.
The purpose of this study is to introduce a novel 3D lung cine MRI method using SWIFT which can detect minor water (proton) density changes in the lung. Cine imaging, which delineates lung dynamics, is highly useful for understanding lung functions such as compliance and ventilation. In the proposed method, MRI data acquisition is performed without respiratory gating, but respiratory motion is extracted from MRI signals retrospectively by inserting DC navigator acquisitions in the SWIFT sequence. To achieve higher flip angle excitation and reduce blurring artifacts due to off-resonance and fast signal decay, gradient modulation is introduced in SWIFT. To test the capability of the proposed technique, ARDS model rats are imaged and compared with normal rat lungs.
2. MATERIALS AND METHOTDS
2.1 Animals
University of Minnesota Institutional Animal Care and Use Committee (IACUC) approved all experimental protocols. Specific pathogen free adult male Sprague Dawley rats between 175 and 199 grams were used for the MRI scans (5 and 7 rats for normal and ARDS groups). ARDS was induced by exposing rats to > 95% O2 at 1 atmosphere barometric pressure for 60 hours with ad libitum access to food and water. An exposure time of 60 hours provides a nonlethal dose that damages the alveolar epithelium; with well-characterized morphometric changes9. This model recapitulates endothelial and epithelial damage seen in ARDS with accumulation of extravascular lung water (EVLW). Though all preclinical models have limitations, the advantage of hyperoxic stress is its reproducibility10.
2.2 MRI
All MR images were acquired with a 9.4T 31cm bore animal MR scanner equipped with 40 gauss/cm gradients (Agilent Technologies Inc., CA, USA). A quadrature birdcage coil (inner diameter = 5.6 cm) was used for transmit and receive. In SWIFT, gradient modulation was employed; relatively low gradient amplitude was applied during the gapped pulse excitation and signal acquisition, and then the acquisition continued after the pulse with the gradient amplitude rising up to cover the higher frequency k-space regions quickly (Fig. 1a). The lower bandwidth excitation with gradient modulation can reduce the RF power and/or alleviate the demand of fast switching of the transmit and receive (T/R) mode. In SWIFT, DC navigator signal acquisitions were inserted every 16 TRs, where the gradients were turned off (Fig. 1b); therefore, all DC navigator acquisitions were identical and the signal fluctuations were predominantly due to respiratory motion. The DC navigator signals delineated respiratory motion with ~40 ms time resolution (Fig. 1c). Sequence parameters in SWIFT were: TR = 2.46 ms, TE = ~4 μs, flip angle = 4°, gapped stretched hyperbolic secant pulse (HS2) excitation, pulse width = 864 μs, FOV = 64×64×88 mm3, excitation bandwidth (BW) = 75 kHz, gapping = 83 kHz, BW at the gradient maximum = 125 kHz, acquisition time = 2.16 ms, total number of spoke views = 491,520 and scan time = 22 min. For comparison, a conventional 3D GRE image at exhalation phase was acquired with respiratory gating (64 lines/trigger). GRE parameters were: TR/TE = 3.8/1.9 ms, flip angle = 5°, FOV = 64×64×88 mm3, BW = 156 kHz, cylindrical k-space sampling and scan time = 12–15 min depending on the respiration rate. During MR scans, rats were anesthetized with a 30/70% mixture of O2/N2O and ~1.5% isoflurane and freely breathed using a nose cone. Rats were placed at prone position in a cradle in the magnet bore. Temperature was maintained at 37±1 °C with a warm air circulation system that was regulated by the temperature monitoring module of the small animal monitoring system (SA instrument Inc., NY, USA).
Figure 1.

a) Sequence diagram of gradient-modulated SWIFT, b) retrospective gating strategy using DC navigator acquisitions and c) an example DC navigator signal fluctuation due to respiratory motion. DC navigator acquisitions were inserted every 16 TRs (~40 ms interval). Respiratory motion was extracted based on the signal drop in the DC navigator signals at the inhalation phase (gray dots in c).
2.3 Image reconstruction
The acquired SWIFT data that contained all respiratory phases were sorted to 16 time frames (~30k views/frame) based on the DC navigator signals. Since SWIFT started acquiring data immediately after excitation, k-space data was radially acquired. Thus, each frame image was reconstructed with gridding reconstruction. Matrix size of the reconstructed image was 280×280×384 (230 μm isotropic resolution), where the sparsest sampling region showed ~15× undersampling. To mitigate the undersampling artifacts, compressed sensing reconstruction was applied to the SWIFT cine images11; the final reconstruction image, I, was obtained by iteratively solving the following minimization problem:
| (1) |
where s is the acquired radial k-space data, λ1,2 are regularization parameters, F is the Fourier transform and undersampling operator, and TV and W are 4D total variation and wavelet transform with Daubechies 4-tap wavelet, respectively. In this study, the final images were obtained with 30 iterations. All image reconstruction processing was performed with a homebuilt C/C++ program.
2.4 Image registration
To track the parenchymal signal intensity change through respiration, image registration was performed on the SWIFT images at different respiration phases. One exhalation phase image was set to a template image and all other phase images were registered to the template. Image registration was carried out in 3 steps: rigid-body, affine and deformable transform. Based on the registered images, signal intensities of parenchymal tissues were calculated by setting three regions of interest (ROI) with a size of 4×4×4 pixels: dependent (ventral), intermediate and non-dependent (dorsal) regions in the right lung. The ROIs were selected not to overlap blood vessels and, for ARDS lungs, severely damaged regions. The signal intensities of the 3 ROIs were normalized by the mean signal intensity of muscle. Image registration was performed with advanced normalization tools (ANTs)12 and the ROI analysis was performed with a homebuilt program running on Matlab (MathWorks Inc., MA, USA).
3. RESULTS
3.1 Sensitivity to lung tissue signals
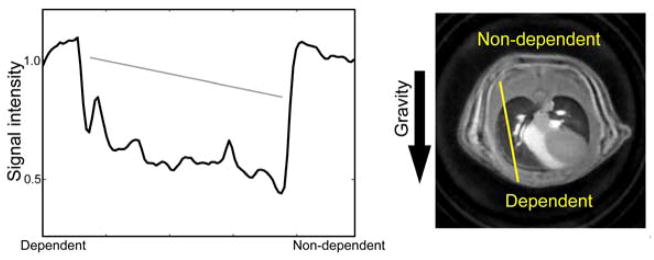
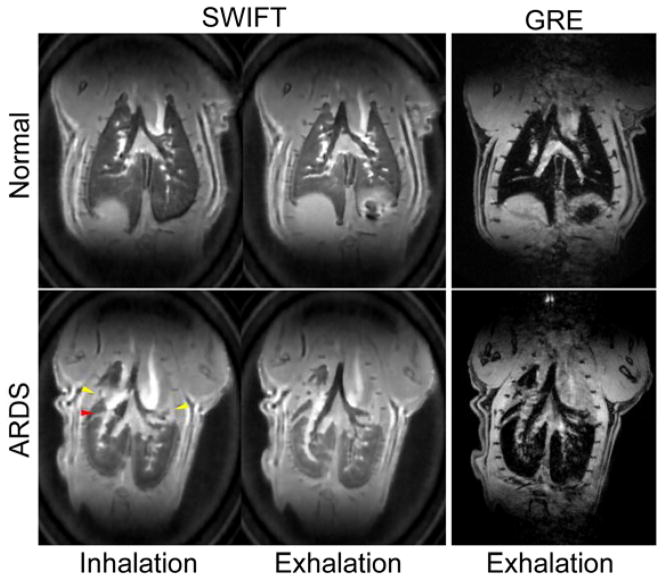
SWIFT images showed conspicuously higher sensitivity to the lung tissue signals compared to 3D GRE (Fig. 2). The lung parenchyma in normal rats was almost entirely invisible with GRE. For ARDS rats, there were severely damaged collapsed lung regions, which were visible even with GRE, but the majority of lung tissues were still invisible. In the SWIFT cine images, parenchymal signal intensity changes were seen depending on the respiratory phases; the signal intensities at inhalation phases were lower than those in exhalation phases. On the SWIFT images, parenchymal signal intensities showed differences depending on the position along the direction of gravity; the dependent (ventral) region showed the highest intensity (Fig. 3).
Figure 2.
SWIFT (left) and GRE (right) lung images for normal (top) and ARDS rats (bottom). SWIFT showed extremely higher sensitivity to parenchymal signals relative to GRE. In the ARDS rat lung, severely damaged collapsed regions (yellow arrow heads) and the boundary between different lung lobes (red arrow head) were visualized as higher intensity regions.
Figure 3.

Signal intensity (lung tissue density) change due to gravity. Signal intensity is plotted along a yellow line in the image. A gray line in the plot represents an approximate linear slope of the signal intensity change.
3.2 Image registration
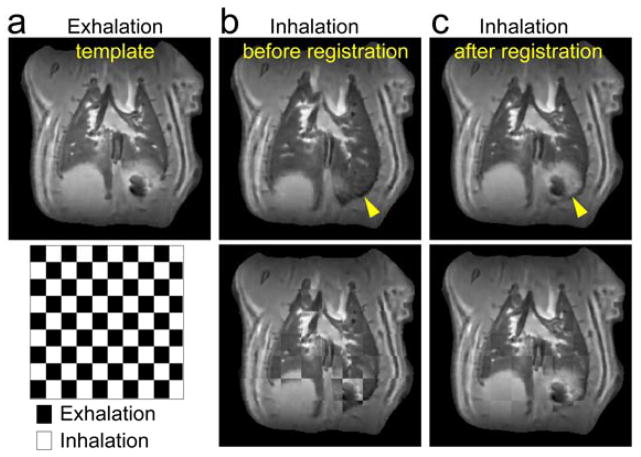
To track signal intensity changes through the respiration cycle at the same lung location, image registration was performed on different respiration phase images of SWIFT (Fig. 4). In SWIFT images, lung tissues had high contrast boundaries with blood vessels, cartilage plates, diaphragm and chest walls, which worked as landmarks in image registration. The entire lung region showed expansive and contractive motion during the respiration cycle, but motion around the diaphragm was most noticeable. Even for the diaphragm regions, the different respiration phase images coregistered well.
Figure 4.
An example of image registration; a template exhalation phase image (a) and inhalation images before (b) and after (c) registration. Lung regions around the diaphragm showed largest motion (yellow arrow head). Superimposed images of exhalation and inhalation images before and after registration are shown in bottom row, where the lung at inhalation phase was well registered to the template.
3.3 Parenchymal signal intensity change during respiration
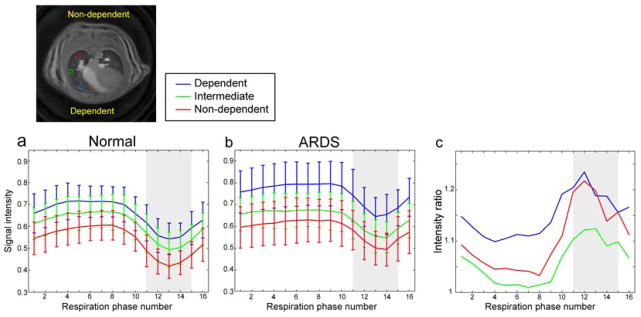
Based on the registered images, signal intensity changes during the respiration cycle were calculated (Fig. 5a, b). Signal intensity drops in inhalation phases were consistently observed for both normal and ARDS lungs, but depth of the intensity drops for the ARDS lungs were less than the normal rat lung. Signal intensity changes due to gravity were also seen in both. The lungs from the ARDS rats showed 1–24% higher parenchymal signal intensities relative to the normal rat lungs for all of the dependent, intermediate and non-dependent regions (Fig. 5c), which would be mainly from accumulation of EVLW (i.e. higher proton density).
Figure 5.

Lung tissue signal intensity changes during respiration cycle for normal (N=5; a) and ARDS rats (N=7; b); Dependent/ventral, intermediate and non-dependent/dorsal regions for blue, green and red, respectively. Positions of the ROIs are shown in the image. Signal increases were observed from dorsal to ventral side due to gravity. c) Lung tissue signal intensity ratio between normal and ARDS lungs. ARDS lungs showed 1–24% higher signal intensities; the maximum intensity ratios were observed at the inhalation phase (shaded regions) for all the 3 regions.
4. DISCUSSION
Major technical innovations of the proposed methods are implementation of retrospective gating with DC navigator acquisition and gradient modulation in SWIFT acquisition. In retrospective gating, the respiration phase for each data was determined in the image reconstruction process. Therefore, when the respiration rate changes unstably during the MR scan, which is common for diseased lungs, effects from the unstable respiration can be compensated in the image reconstruction process, as long as respiratory motion is correctly recorded in DC navigator signals. According to the ARDS lung datasets obtained in this work, the DC navigator signals showed high enough sensitivity to detect breathing motion of the ARDS lungs which can usually be unstable and shallow. Moreover, the proposed method using retrospective gating does not have extra delay time, which commonly exists in the conventional gated acquisition to wait for next trigger timing. Thus, in the retrospective gating strategy used here, magnetization reaches pure steady-state independent of the respiration rate, whereas magnetization in conventional gating shows dependence on the respiration rate (i.e., T1 contrast depending on the respiration rate). This is an important property for accurate quantifications based on the steady-state magnetization such as T1 mapping with the variable flip angle method13,14 and B1 mapping with the actual flip angle imaging15,16.
In general, higher bandwidth is desirable in radial short TE sequences including SWIFT to minimize blurring due to off-resonance and T2* signal decay. However, high bandwidth in excitation results in high RF peak power and specific absorption rate (SAR) and thus limits achievable flip angles. Gradient modulation used herein can mitigate this limitation by using relatively low bandwidth for excitation, but retains higher bandwidth in readout to minimize the undesirable blurring artifacts. Another merit of using gradient modulation in SWIFT is the alleviated demand on fast T/R switching. This is advantageous for future implementation of SWIFT in human clinical scanners, where the T/R switching is slower (>20 μs) compared with animal systems. One disadvantage of gradient modulation is an increase of acoustic noise due to the extra modulation of gradient amplitude, while the regular SWIFT has minimal gradient changes between TRs and thus is nearly quiet. However, in many cases, the acoustic noise in gradient-modulated SWIFT is much quieter than conventional MRI sequences.
The higher sensitivity of SWIFT to the short-lived lung parenchymal signals achieved more detailed visualization of the lung structures compared with the conventional GRE sequence. The extremely short TE in SWIFT enabled to detect minor changes of the lung tissue density due to gravity. Dependent regions (ventral side at prone position) experiences higher gravitational pressure and thus show higher tissue density, namely, higher signal intensities in SWIFT images. Similarly, tissue density changes due to respiration (lung expansion and contraction) were observed. Furthermore, an increase of lung tissue signal intensities in the ARDS lungs relative to normal lungs, which should be from increased EVLW (i.e., water density), was detected in the SWIFT images. According to the intensity ratio analysis, the signal increase reached maximum at the inhalation phase, which suggests the rats with the damaged lung have shallow breathing and reduced lung compliance.
In conclusion, respiratory motion was accurately monitored by the DC navigator signals in the proposed SWIFT method. The method showed high enough sensitivity for detecting the lung proton density changes due to gravity, different respiration phases and accumulation of EVLW in rats with the ARDS lung.
Acknowledgments
The current work was supported by University of Minnesota CTSI Novel Methods Grant NM2013-06-07, National Institute of Health P41 EB015894, and WM KECK Foundation. We also thank Dr. Bing Zhou, and Kevin Viken for assisting with the hyperoxia lung injury model.
References
- 1.Case TA, Durney GH, Ailion DC, Cutillo AG, Morris AH. A Mathematical Model of Diamagnetic Line Broadening in Lung Tissue and Similar Heterogeneous Systems: Calculations and Measurements. J Magn Reson. 1987;73:304–314. [Google Scholar]
- 2.Kveder M, Zupancic I, Lahajnar G, Blinc R, Suput D, Ailion DC, Ganesan K, Goodrich C. Water proton NMR relaxation mechanisms in lung tissue. Magn Reson Med. 1988;7(4):432–441. doi: 10.1002/mrm.1910070406. [DOI] [PubMed] [Google Scholar]
- 3.Idiyatullin D, Corum C, Park JY, Garwood M. Fast and quiet MRI using a swept radiofrequency. J Magn Reson. 2006;181(2):342–349. doi: 10.1016/j.jmr.2006.05.014. [DOI] [PubMed] [Google Scholar]
- 4.Kobayashi N, Idiyatullin D, Corum C, Weber J, Garwood M, Sachdev D. SWIFT MRI Enhances Detection of Breast Cancer Metastases to the Lung. Magn Reson Med. doi: 10.1002/mrm.25301. [DOI] [PMC free article] [PubMed] [Google Scholar]
- 5.LeTourneau JL, Pinney J, Phillips CR. Extravascular lung water predicts progression to acute lung injury in patients with increased resk. Crit Care Med. 2012;40(3):847–854. doi: 10.1097/CCM.0b013e318236f60e. [DOI] [PMC free article] [PubMed] [Google Scholar]
- 6.Hu W, Lin CW, Hu WH, Zhu T. Extravascular lung water and pulmonary arterial wedge pressure for fluid management in patients with acute respiratory distress syndrome. Multidiscip Respir Med. 2014;9(1):3. doi: 10.1186/2049-6958-9-3. [DOI] [PMC free article] [PubMed] [Google Scholar]
- 7.Ruiz-Bailen M, Fernandez-Mondejar E, Hurtado-Ruiz B, Colmenero-Ruiz B, Rivera-Fernandez R, Guerrero-Lopez F, Vazquez-Mata G. Immediate application of positive-end expiratory pressure is more effective than delayed positive-end expiratory pressure to reduce extravascular lung water. Crit Care Med. 1999;27(2):380–384. doi: 10.1097/00003246-199902000-00046. [DOI] [PubMed] [Google Scholar]
- 8.Michard F. Bedside assessment to extravascular lung water by dilution methods: temptations and pitfalls. Crit Care Med. 2007;35(4):1186–1192. doi: 10.1097/01.CCM.0000259539.49339.66. [DOI] [PubMed] [Google Scholar]
- 9.Thet LA, Parra SC, Shelburne JD. Sequential changes in lung morphology during the repair of acute oxygen-induced lung injury in adult rats. Exp Lung Res. 1986;11:209–228. doi: 10.3109/01902148609064297. [DOI] [PubMed] [Google Scholar]
- 10.Matute-Bello G, Frevert CW, Martin TR. Animal models of acute lung injury. Am J Physiol Lung Cell Mol Physiol. 2008;295:379–399. doi: 10.1152/ajplung.00010.2008. [DOI] [PMC free article] [PubMed] [Google Scholar]
- 11.Lustig M, Donoho D, Pauly JM. Sparse MRI: The application of compressed sensing for rapid MR imaging. Magn Reson Med. 2007;58(6):1182–95. doi: 10.1002/mrm.21391. [DOI] [PubMed] [Google Scholar]
- 12.Avants BB, Tustison NJ, Song G, Cook PA, Klein A, Gee JC. A reproducible evaluation of ANTs similarity metric performance in brain image registration. Neuroimage. 2011;54(3):2033–2044. doi: 10.1016/j.neuroimage.2010.09.025. [DOI] [PMC free article] [PubMed] [Google Scholar]
- 13.Haacke EM, Brown RW, Thompson MR, Venkatesan R. Magnetic resonance imaging: physical principles and sequence design. A John Wiley & Sons, Inc; New York: 1999. pp. 654–657. [Google Scholar]
- 14.Wang L, Corum CA, Idiyatullin D, Garwood M, Zhao Q. T1 estimation for aqueous iron oxide nanoparticle suspensions using a variable flip angle SWIFT sequence. Magn Reson Med. 2013;70:341–347. doi: 10.1002/mrm.24831. [DOI] [PMC free article] [PubMed] [Google Scholar]
- 15.Yarnykh VL. Actual flip-angle imaging in the pulsed steady state: a method for rapid three-dimensional mapping of the transmitted radiofrequency field. Magn Reson Med. 2007;57(1):192–200. doi: 10.1002/mrm.21120. [DOI] [PubMed] [Google Scholar]
- 16.Kobayashi N, Garwood M. B1 mapping of short T2* spins using a 3D radial gradient echo sequence. Magn Reson Med. 2014;71:1689–1699. doi: 10.1002/mrm.24817. [DOI] [PMC free article] [PubMed] [Google Scholar]


