

Abstract
The cellular proteostasis network integrates the protein folding and clearance machineries in multiple sub-cellular compartments of the eukaryotic cell. The endoplasmic reticulum (ER) is the site of synthesis and folding of membrane and secretory proteins. A distinctive feature of the ER is its tightly controlled redox homeostasis necessary for the formation of inter- and intra-molecular disulphide bonds. Employing genetically encoded in vivo sensors reporting on the redox state in an organelle-specific manner, we show in the nematode Caenorhabditis elegans that the redox state of the ER is subject to profound changes during worm lifetime. In young animals, the ER is oxidizing and this shifts towards reducing conditions during ageing, whereas in the cytosol the redox state becomes more oxidizing with age. Likewise, the redox state in the cytosol and the ER change in an opposing manner in response to proteotoxic challenges in C. elegans and in HeLa cells revealing conservation of redox homeostasis. Moreover, we show that organelle redox homeostasis is regulated across tissues within C. elegans providing a new measure for organismal fitness.
Keywords: ageing, ER, proteostasis, redox homeostasis
See also: C Rongo et al (September 2015)
Introduction
The endoplasmic reticulum (ER) is the compartment where membrane and secretory proteins are actively synthesized (Araki & Nagata, 2011b). Approximately one-fifth to one-third of the proteome is synthesized at the ER membrane, although the volume of this organelle is estimated to be just one-tenth of the entire cell (Levine et al, 2005). Thus, the ER is highly crowded with proteins and equipped with lumen-localized chaperones and the unfolded protein response (UPR) to maintain the fold and function of the organellar proteome (Araki & Nagata, 2011b). In parallel with polypeptide folding in the ER, two characteristic covalent modifications, oligosaccharide transfer and disulphide bond formation are introduced into proteins to provide conformational stability for secreted proteins (Wiseman et al, 2007). A network of redox enzymes, the oxidoreductases, mediates the formation of disulphide bonds (Araki & Nagata, 2011a; Oka & Bulleid, 2013). The ER oxidoreductases include protein disulphide isomerase (PDI) and about 20 PDI family proteins that function in oxidizing substrate cysteine residues and in disulphide rearrangement (Araki & Nagata, 2011b). The oxidizing potential of oxygen in the ER is transferred to PDI via the oxidoreductases ERO-1 and peroxiredoxin 4 (Zito et al, 2010; Araki & Nagata, 2011b). It is well established that exposure to reducing agents such as dithiothreitol (DTT) inhibits the oxidation and subsequent maturation of ER proteins and causes the induction of the UPR and ER-associated degradation (ERAD). Misfolded proteins are then selectively retro-translocated into the cytosol and degraded by the ubiquitin proteasome system (UPS) (Meusser et al, 2005; Araki & Nagata, 2011b).
Recent findings in model organisms such as the nematode Caenorhabditis elegans indicate that protein homeostasis (proteostasis) and quality control decline during ageing (Ben-Zvi et al, 2009; David et al, 2010; Kirstein-Miles et al, 2013). These investigations have so far mainly addressed the cytosolic compartment. To explore whether ageing and proteotoxic stress in the cytosol also affects ER redox homeostasis, we utilized two in vivo redox sensors, the redox-sensitive GFP (roGFP) and HyPer to monitor the general redox state and the concentration of a specific reactive oxygen species, H2O2, respectively. Furthermore, we employed two complementary model systems, the nematode C. elegans and mammalian cells, to examine the redox state during development, ageing and in response to imbalances of proteostasis. We demonstrate that in the progression of ageing in C. elegans, the expression of neurotoxic aggregation-prone proteins and proteasome inhibition lead to perturbation of the ER and cytosolic redox homeostasis in opposing directions. While the ER becomes more reducing in response to proteotoxic challenges, the cytosol becomes more oxidizing. Redox homeostasis in the cytosol and ER are coupled: proteotoxic stress in the cytosol leads to a shift in ER redox state towards reducing, whereas proteotoxic stress in the ER and the cytosol causes the cytosolic redox state to shift towards oxidizing conditions. Moreover, we provide evidence for trans-tissue signalling of the redox state between neurons and muscle tissue. Taken together, the redox states and folding environments of the ER and the cytosol are closely coupled and are adjusted across organellar, cellular and tissue boundaries.
Results
Generation and validation of redox sensors in C. elegans and mammalian cell culture
To analyse redox homeostasis in the ER and cytosol by real-time measurements in vivo, we employed two genetically encoded sensors, redox-sensitive green fluorescent protein (roGFP) and the hydrogen peroxide sensor, HyPer (Hanson et al, 2004; Belousov et al, 2006; Markvicheva et al, 2011). We chose roGFP as a sensor to report on the general redox state and HyPer to specifically report on the H2O2 content. H2O2 is an excellent electron acceptor and promotes disulphide bond formation in the ER (Margittai et al, 2012).
RoGFP is a genetically engineered version of GFP harbouring two cysteine residues on the outer surface of the beta barrel in close proximity to the fluorophore (Hanson et al, 2004). RoGFP has two excitation peaks at ∼405 and ∼488 nm and a single emission peak at 509 nm. The formation or cleavage of a disulphide bond between those two cysteine residues leads to changes in the roGFP excitation spectrum. A disulphide bond formation in oxidizing conditions results in a higher excitation at ∼405 nm and a lower excitation at ∼488 nm, and the reverse occurs under conditions that reduce the S-S bonds. Thus, the dual excitation and single emission nature of roGFP can be utilized for ratio-metric measurements. Likewise, HyPer also provides the dual excitation and single emission feature with two excitation peaks at ∼420 and ∼500 nm. HyPer is based on the regulatory domain of the E. coli H2O2-sensing OxyR protein fused to circularly permuted YFP and specifically reacts with H2O2 (Belousov et al, 2006). Consequently, exposure to H2O2 results in disulphide bond formation in a HyPer molecule that increases and decreases the excitation at ∼500 and ∼420 nm, respectively, and thus allows for quantitative assessment of relative H2O2 levels in vivo (Belousov et al, 2006; Markvicheva et al, 2011). Taken together, these sensors provide a dynamic analysis being reversible in their oxidation, and quantitative assessment of the redox state. We established transgenic lines of C. elegans expressing roGFP and HyPer in the ER and the cytosol under the control of tissue-specific promoters to analyse the organellar redox state in muscle and neuronal tissue during development and ageing, and in response to proteotoxic stress. These studies were complemented with an analysis of the redox state in mammalian cell lines by transfecting HeLa cells with roGFP and HyPer targeted to the ER and cytosol, respectively.
To validate the reporter lines, we exposed C. elegans expressing roGFP in the ER of muscle tissue to reducing (5 mM DTT) and oxidizing (1 mM DPS, 2,2′-dipyridyldisulphide, that oxidizes free thiol groups to form disulphide bonds) reagents and compared them to untreated animals (Fig A). For the image-based analysis, individual muscle cells of 4-day-old animals (young adults) were excited at 405 nm and 488 nm and the emission was measured at 509 nm. The resulting ratios for individual muscle cells of multiple nematodes (n = 20) ranged from a value of 0.91 ± 0.22 (mean ± standard deviation) upon exposure to DTT, 1.81 ± 0.23 for untreated animals to 2.26 ± 0.31 upon exposure to DPS, thus demonstrating that the roGFP sensor is responsive to changes in reducing and oxidizing conditions. Representative images are shown for each condition (Figs 1A and EV1A). To complement the imaging analysis with a biochemical validation of the sensor, samples from animals treated with DTT, DPS or those of untreated animals were analysed by reducing and non-reducing SDS–PAGE followed by Western blot analysis using GFP antibodies. As shown in Fig B, two bands were detected in the non-reducing gel (on the right), with the upper band corresponding to the reduced moiety and the faster migrating lower band representing the oxidized GFP species. As expected, the samples of the DTT-treated animals show a clear change in the distribution of the intensity of both bands in favour of the upper band corresponding to the reduced GFP moiety. Conversely, the samples of the DPS-treated animals exhibit a complete shift towards the faster migrating oxidized GFP moiety (Fig 1B). The correct targeting of the redox sensor to the ER is demonstrated by co-localization of ER-roGFP with an antibody directed against KDEL, the retention signal for ER-localized proteins (Fig EV1E). To further establish the biological significance of the read-out of the redox sensor, we analysed the redox state of the ER upon RNAi-mediated knockdown of the major ER oxidase encoding gene ero-1. Depletion of ero-1 led to a strong decrease in the 405/488 nm ratio, indicating a shift towards reducing conditions in the ER in the absence of ERO-1 (Fig EV1F). To test whether the sensitivity of the sensors lies within the physiological range, we employed the UPR reporter line hsp-3::yfp. We observed an induction of the hsp-3 (ER-Hsp70; BiP homologue) driven yfp expression upon treatment with 5 mM DTT and 1 mM DPS (same condition as Fig A–C) and conclude that the redox sensors are sensitive to changes in the redox state that cause ER stress (Fig EV1G).
Figure 1. Generation and validation of redox sensors in Caenorhabditis elegans and mammalian cell culture.
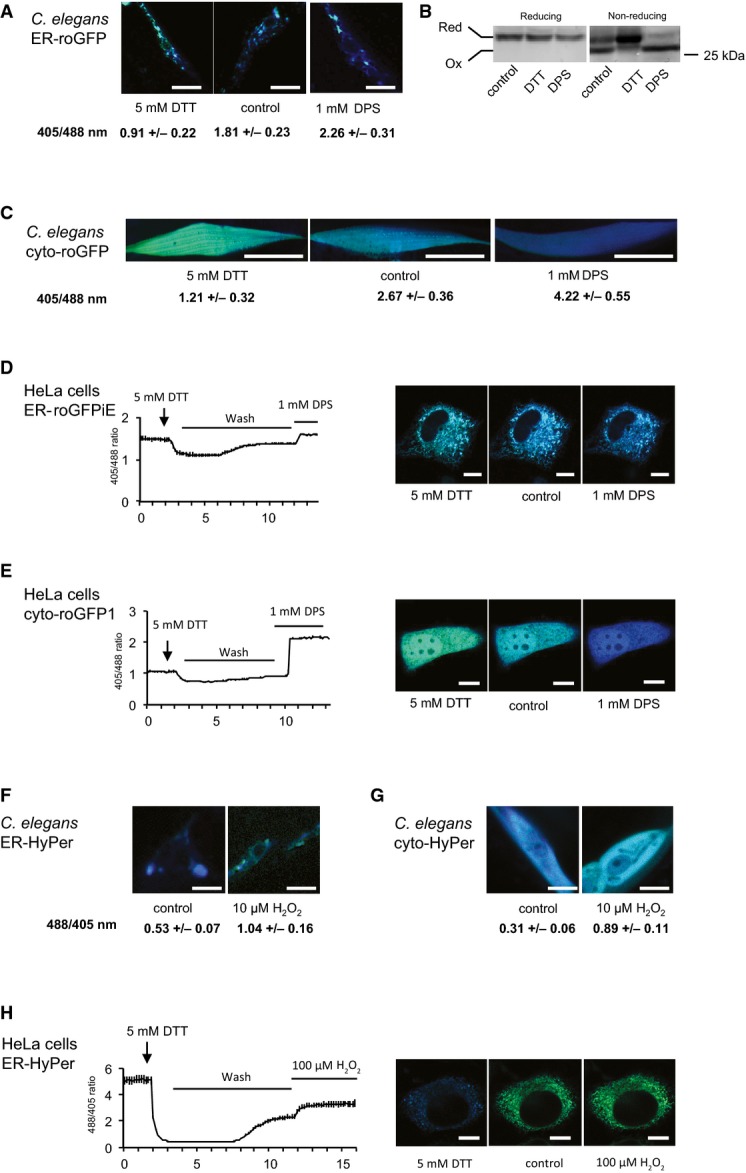
- Bidirectional reactivity of ERroGFP, expressed in the ER of muscle cells in C. elegans, towards reducing and oxidizing conditions. Mean ratio traces of emission intensities excited at 405 nm and 488 nm were measured and calculated upon addition of DTT and DPS or without treatment (control). The images depict representative images of 20 analysed nematodes. The ratio-metric analyses were carried out on a single-cell level. The images resulting upon excitation at 405 nm are false-coloured in blue and those upon excitation at 488 nm in green and represented as overlays for all figures. Scale bars are 20 μm. The ratio-metric analyses between the control and DTT- and DPS-treated sample passed the ANOVA (F = 158; P > 0.0001) and the post hoc Tukey's HSD test confirmed a significant difference.
- Lysates of C. elegans expressing ERroGFP treated with the indicated agents were analysed in reducing and non-reducing SDS–PAGE and subsequent Western blot using GFP antibodies.
- Validation of reactivity of cytosolic roGFP in C. elegans analogous to (A). Scale bars are 25 μm. The ratio-metric analyses between the control and DTT- and DPS-treated sample passed the ANOVA (F = 170; P > 0.0001) and the post hoc Tukey's HSD test confirmed a significant difference.
- Reversible reactivity of ERroGFP (ERroGFPiE) in HeLa cells. Mean ratio traces of emission intensities excited at 405 and 488 nm of ERroGFPiE are depicted. Cells were treated with 5 mM DTT at 2 min, washed from 3 to 12 min and treated with 1 mM DPS at 12 min. Representative images are shown on the right. Scale bars are 10 μm.
- Reversible reactivity of cytosolic roGFP in HeLa cells analogous to (D). Mean ratio traces of emission intensities excited at 405 and 488 nm of roGFP are depicted. Cells were treated with 5 mM DTT at 2 min, washed from 3 to 10 min and treated with 1 mM DPS at 10 min. Representative images are shown on the right. Scale bars are 10 μm.
- Reactivity of ER-HyPer, expressed in the ER in muscle cells in C. elegans, to exogenous H2O2. Mean ratio traces of emission intensities excited by 405 and 488 nm were measured and calculated upon addition of 10 μM H2O2 to the nematodes or without treatment (control). Twenty nematodes were analysed and depicted are the mean ratios with a P-value of 7.36 × 10⁻¹⁶. The analyses were carried out on a single-cell level. Scale bars are 10 μm.
- Reactivity of HyPer, expressed in cytosol in muscle in C. elegans analogous to (F); P = 6.08 × 10⁻²³. Scale bars are 10 μm.
- Reversible reactivity of ER-HyPer, expressed in the ER in HeLa cells. Mean ratio traces of emission intensities excited at 405 and 488 nm of roGFP (488/405) are depicted. Cells were treated with 5 mM DTT at 2 min, washed from 3 to 12 min and treated with 100 μM H2O2 at 12 min. Representative images are shown on the right. Scale bars are 10 μm.
Figure EV1. Validation of roGFP and HyPer sensors.
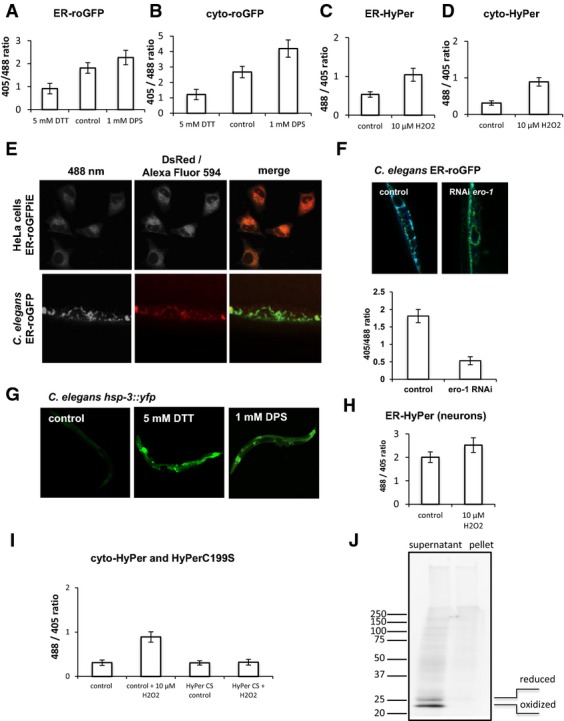
- E Co-localization analysis of HeLa ER-roGFPiE using ER-targeted DsRed as reference and of C. elegans ER-roGFP using an immunostaining with Alexa Fluor 594-coupled antibodies directed against KDEL antibodies as reference. The 488-nm channel is depicted on the left, the red channel in the middle and the overlay of both on the right.
- F RNAi-mediated knockdown of ero-1 results in a strong reduction in the ER redox state. The knockdown was performed at the L1 stage, and the analysis was performed on day 4 of life (young adults). Representative images are shown on the top and the quantification of the ratio-metric analysis is shown underneath. Twenty nematodes each were analysed. The ratio-metric data are represented as means ± SD.
- G Exposure of nematodes to 5 mM DTT or 1 mM DPS results in UPRER induction as judged by the expression of hsp-3::yfp reporter. The non-treated control is shown on the left.
- H The graph depicts the ratio-metric analysis of C. elegans neuronal ER-HyPer. Analogous to the muscle reporter, the sensor-expressing nematodes were treated with 10 μM H2O2. The ratio-metric data are represented as means ± SD.
- I Validation of the HyPer sensor for its specificity towards H2O2. Depicted are the ratio-metric analyses of nematodes expressing cytosolic HyPer or HyPerC199S (HyPerCS) in the presence and absence of H2O2. Twenty animals were analysed for each condition. The ratio-metric analyses between the control, control + H2O2, HyPer CS control and HyPer CS + H2O2 passed the ANOVA (F = 294; P > 0.0001) and the post hoc Tukey's HSD test confirmed a significant difference between control versus control + H2O2, control + H2O2 versus HyPer CS control, control + H2O2 versus HyPer CS + H2O2. The difference between control versus HyPer CS control, control versus HyPer CS + H2O2 and HyPer CS control versus HyPer CS + H2O2 is non-significant. All ratio-metric data are represented as means ± SD.
- J Western blot analysis of soluble and insoluble samples of nematodes expressing ER-roGFP. The left lane depicts the soluble and the right lane the insoluble fraction. The Western blot was analysed using antibodies directed against GFP (Roche) and the corresponding signal for the reduced and oxidized version of GFP is indicated on the right.
For validation of the sensitivity of the cytosolic roGFP sensor, ratio-metric analysis was performed following DTT or DPS treatment analogous to the ER sensor (Figs C and EV1B). The cytosolic roGFP responded to reducing (408/488 nm = 1.21 ± 0.32) and oxidizing (4.22 ± 0.55) conditions relative to untreated (2.67 ± 0.36) from which we conclude that roGFP can also be used as a tool to report on redox changes towards reducing and oxidizing conditions in the ER and the cytosol of C. elegans.
The roGFP sensors expressed in the cytosol (roGFP1) and the ER (ER-roGFPiE) in HeLa cells were validated by exposing the sensor-expressing cells first to DTT and subsequently to DPS, after which the ratios of 405/488 nm were monitored (Fig D and E). The sensors responded to reducing and oxidizing changes, in both compartments (Fig 1D and E). The correct targeting of ER-roGFPiE to the ER was verified by co-localization with an ER-targeted DsRed (Fig EV1E). In contrast to ER-roGFPiE, ER-roGFP1 expressed in HeLa cells did not respond to treatment with 1 mM DPS, indicating that this roGFP variant is completely oxidized in the ER of mammalian cells as has been previously described (Schwarzer et al, 2007; van Lith et al, 2011; Fig EV2). These differences between C. elegans and mammalian cells in the sensitivity of ER-roGFP1 may be due to the ER redox equilibrium associated with the robustness of ER redox catalysts. For example, in addition to ero-1, mammalian cells express peroxiredoxin 4 and glutathione peroxidases 7 and 8 as ER thiol-oxidases (Araki & Nagata, 2012). Additionally, while knockdown of ero-1 in C. elegans has been reported to upregulate UPRER broadly in different tissues (Harding et al, 2003), Ero-1α/β knockout mice only display defects in insulin biogenesis and glucose tolerance (Zito et al, 2010).
Figure EV2. Validation of ER and cytosolic roGFP in HeLa towards more oxidative conditions.

- Ratio traces of ER-roGFPiE expressed in the ER in HeLa cells. 1 mM DPS was added at 2 min.
- Ratio traces of roGFP expressed in cytosol in HeLa cells. 1 mM DPS was added at 2 min and wash starts at 3 min.
- Ratio traces of wild-type version of roGFP targeted to the ER lumen (ER-roGFP), showing ER-roGFP in HeLa cells can sense reducing, but not oxidative challenge. 1 mM DPS was treated at 2 min (left). 5 mM DTT was added at 3 min, wash was done from 4 to 7 min, and 1 mM DPS was added at 7 min (right).
To validate the nematode HyPer sensor, transgenic lines of C. elegans expressing HyPer in the ER and cytosol of muscle cells were exposed to sub-lethal H2O2 concentrations (10 μM) for 20 min and the ratio of excitation maxima of 488/405 nm analysed in individual muscle cells of multiple animals (n > 20). As shown in Fig F and G, the ratio of 488/405 nm shifts from mean values of 0.53 ± 0.07 (ER) and 0.31 ± 0.06 (cytosol) to 1.04 ± 0.16 and (ER) 0.89 ± 0.11 (cytosol), respectively, upon exposure to H2O2 (Figs 1F and G, and EV1C and D). Thus, the HyPer sensor can be used to analyse in vivo fluctuations of H2O2 in the ER and the cytosol in C. elegans. No changes in the 488/405 ratios were observed for neuronal or muscle HyPerC199S upon exposure to H2O2, demonstrating the specificity of the sensor to H2O2. Mutation of the H2O2-sensitive cysteine to serine (C199S) renders this sensor insensitive to H2O2, demonstrating that the observed ratio-metric changes are due to the oxidation of HyPer by H2O2 and not caused by unspecific effects (Fig EV1I).
The mammalian HyPer sensor expressed in the ER of HeLa cells was validated by exposing the cells to DTT and subsequently to 100 μM H2O2, monitoring the excitation maxima at 488 and 405 nm and determining the respective ratio of 488/405 nm (Fig 1H). This sensor is responsive to changes in H2O2 concentrations and therefore can be used to analyse H2O2 fluctuations in vivo in the ER of HeLa cells. Taken together, we show that all sensors used in this study are fully responsive to reducing and oxidizing changes (roGFP) and to fluctuations in H2O2 levels (HyPer) in the ER and the cytosol of C. elegans and mammalian cells.
All redox sensors are expressed at low levels that do not affect cellular function. This was assessed using motility and chemotaxis assays of animals expressing roGFP or HyPer in the ER or cytosol of muscle or neuronal tissue, respectively. No organismal-level defects were observed in these experiments (data not shown). Additionally, we examined the expression of the compartmental stress response pathways (cytosolic heat-shock response (HSR) and UPRER) in the transgenic C. elegans lines and did not detect induction in either the HSR and UPR reporter lines (data not shown). In conclusion, the sensors do not appear to affect the physiology of the nematodes and can be utilized to assess the redox state in a neutral manner.
Chronic proteotoxic stress is associated with a shift towards reducing conditions in the ER
A balanced redox homeostasis in the ER is crucial for the folding and maturation of proteins in the secretory pathway. Remarkably, little is known about the robustness of the ER redox state upon perturbation of cellular proteostasis. We addressed this by expressing the aggregation-prone and disease-associated proteins β23-mCherry [an amyloid-forming artificial β-sheet peptide (Olzscha et al, 2011)], Aβ1–42 and Q40-RFP in muscle tissue of C. elegans that co-expresses the redox sensor roGFP targeted to the ER of the same tissue. We observed a pronounced shift towards reducing conditions in the ER of animals that expressed Q40-RFP, Aβ1–42 or β23-mCherry compared to control animals expressing RFP alone (Fig 2A). Notably, although Aβ1–42 is fused to a signal sequence for targeting to the ER, it resides mainly in the cytosol (C. Link, personal communication). Thus, all three aggregation-prone proteins perturb the ER redox state from the cytosol suggesting a trans-compartmental response.
Figure 2. Chronic proteotoxic stress is associated with a shift towards reducing conditions in the ER.

- Ratio-metric analyses of ER-roGFP expressed in muscle cells of C. elegans on day 4 upon co-expression of cytosolic aggregation-prone peptides and proteins, either β23-mCherry, Q40-RFP or Aβ1-42. A strain co-expressing RFP alone in the cytosol and ERroGFP serves as a control. Twenty nematodes each were analysed. Representative images are shown on the right. Scale bars are 25 μm. The ratio-metric analyses between the control, β23, Q40 and Aβ samples passed the ANOVA (F = 164; P > 0.0001) and the post hoc Tukey's HSD test confirmed a significant difference. The data represent means ± SD.
- Expression of Q77-mCherry and HttQ134-mCherry but not Q19-mCherry nor HttQ22-mCherry is associated with a slight reductive shift in the ER redox state in HeLa cells. The mean ratio traces of emission intensities excited at 405 and 488 nm were analysed upon co-expression of the polyQ-mCherry proteins as indicated. For each condition, 90 cells from three independent experiments were analysed. The upper row shows the overlay images of ERroGFPiE upon excitation at 405 and 488 nm. The middle row shows the red channel for the polyQ-mCherry fusion proteins to show the aggregation propensity of Q77- and HttQ134-mCherry. The bottom row displays the overlay images from the upper two rows. On the top left, the 405/488 nm overlay image of the DTT (5 mM) control is shown and on the top right the respective image of the DPS control (1 mM). Scale bars are 10 μm. The data are presented as means ± SEM, P < 0.001. The ratio-metric analyses between HttQ22, HttQ134, Q19 and Q77 passed the ANOVA (F = 23; P > 0.0001) and the post hoc Tukey's HSD test confirmed a significant difference between HttQ22 versus HttQ134, HttQ22 versus Q77, HttQ134 versus Q19, Q19 versus Q77. The difference between HttQ22 versus Q19 and HttQ134 versus Q77 is non-significant.
- Decrease in H2O2 concentration in the ER in neuronal or muscle cells expressing Q40-RFP or β23-mCherry, but not αS824-mCherry, analysed in C. elegans by ratio-metric imaging of ER-HyPer. Twenty nematodes each were analysed. The ratio-metric analyses between neuronal control, neuronal Q40, neuronal αS824 and neuronal β23 passed the ANOVA (F = 37; P > 0.0001) and the post hoc Tukey's HSD test confirmed a significant difference between neuronal control versus neuronal Q40, neuronal control versus neuronal control αS824, neuronal control versus neuronal β23, neuronal Q40 versus neuronal αS824 control and neuronal αS824 control versus neuronal β23. The difference between neuronal Q40 versus neuronal β23 is non-significant. The data represent means ± SD.
- Decrease in H2O2 concentration in the ER in HeLa cells expressing Q77-mCherry in comparison with Q0-mCherry, analysed by ratio-metric imaging of ER-HyPer. 29 and 45 HeLa cells were analysed for Q0 and Q77 respectively. The data are presented as means ± SD, P = 6.76 × 10⁻⁶.
- Knockdown of ire-1 and skn-1 by RNAi is associated with a change in the ER redox state towards reducing conditions in C. elegans. The data are presented as means ± SD. The ratio-metric analyses between the control ire-1 RNAi and skn-1 RNAi passed the ANOVA (F = 253; P > 0.0001) and the post hoc Tukey's HSD test confirmed a significant difference between control versus ire-1 RNAi and control versus skn-1 RNAi. The difference between ire-1 RNAi versus skn-1 RNAi is non-significant.
To analyse whether the effect of protein aggregation on the redox state in the ER is conserved across species, we examined ER redox homeostasis in HeLa cells expressing cytosolic polyQ of varying lengths by ratio-metric imaging analysis (Fig B). Indeed, the expression of polyQ in the cytosol is associated with a redox shift towards reducing conditions in the ER (Fig 2B), in a polyQ length-dependent manner that correlates with aggregation propensity. Cells expressing an aggregation-prone polyQ stretch [either Q77 or HttExon1Q134 (HttQ134)] showed a shift towards reducing conditions, whereas the expression of shorter polyQ lengths (Q19 or HttQ22) had no effect. Notably, the pathogenic length of the polyQ stretch differs between species and is much shorter in C. elegans where Q40 is sufficient to form aggregates and affect the redox state of the ER (Fig 2A). We then analysed the levels of H2O2, a specific ROS in the ER using the HyPer sensor. Basal H2O2 levels differed substantially between muscle and neuronal tissue with neurons exhibiting higher H2O2 concentrations (Fig EV1C and H). Upon cytosolic expression of polyQ or the aggregation-prone β23, the H2O2 levels decreased in the ER of both tissues (Fig 2C). The expression of either RFP alone (control) or a protein of similar molecular weight that is composed of alpha helices, αS824-mCherry (αS824 control), served as control for Q40-RFP and β23-mCherry, respectively (Fig 2C). We also observed decreased levels of H2O2 in the ER of HeLa cells upon cytosolic expression of Q77-mCherry compared to mCherry alone (Q0; Fig 2D). From these data, we conclude that chronic proteotoxic stress exemplified by the expression of aggregation-prone and disease-associated proteins perturbs the ER redox state towards reducing conditions.
The response of the ER redox state towards proteostatic imbalances in the cytosol posed the question whether the ER redox state also reacts to imbalances of protein folding conditions within the same compartment. To address this, we genetically impaired the induction of the UPRER by RNAi-mediated knockdown of ire-1. IRE-1 is an ER trans-membrane sensor that activates the UPRER in response to ER protein folding stress. Depletion of ire-1 causes an induction of the UPRER that was verified using the hsp-3::yfp (ER Hsp70) reporter (Fig EV3). Knockdown of ire-1 results in a pronounced shift of the ER redox state towards reducing conditions (Fig E). Next, we performed knockdown experiments using skn-1 (Nrf2 homologue) that encodes the master regulator for the oxidative stress response to perturb the cellular defence mechanisms against oxidative stress. We observed a profound change in the ER redox state (Fig 2E). Knockdown of skn-1 also strongly induced the UPRER (Fig EV3), which further supports our conclusion of a tight relationship between redox and protein homeostasis in the ER.
Figure EV3. Effect of knockdown of ire-1 and skn-1 on UPRER.
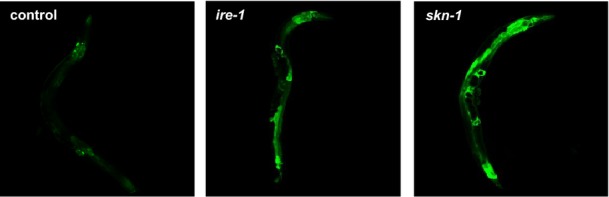
The pictures show representative images of nematodes expressing hsp-3::yfp in response to RNAi-mediated knockdown of either ire-1 or skn-1.
Chronic proteotoxic stress is associated with a shift towards more oxidizing conditions in the cytosol
The observation that an imbalance of cytosolic proteostasis affects the redox state of the ER across compartmental boundaries raises the question how the cytosolic redox state is affected by perturbations in cytosolic and ER protein folding conditions. To address this, we co-expressed Q40-RFP and the roGFP sensor in the cytosol of C. elegans and observed a shift towards more oxidizing conditions in the cytosol (Fig A). Similar observations were made in HeLa cells upon expression of polyQ proteins (Fig 3B). The expression of either Q77 or HttQ143 that both result in aggregate formation is associated with a shift towards oxidizing conditions, whereas the expression of shorter Q-lengths that are soluble (Q19 or HttQ22) does not exhibit any redox change (Fig 3B). We further confirmed this shift towards oxidizing conditions in the cytosol upon polyQ expression in C. elegans using the cytosolic HyPer sensor (Fig 3C). To perturb the cellular response mechanism to fluctuations in the redox state, we depleted skn-1 (Nrf2 homologue) using RNAi and analysed the cytosolic redox state using the roGFP sensor in C. elegans. We observed a slight change in the cytosolic redox homeostasis towards more oxidizing conditions (Fig 3D). We next asked whether the cytosolic redox equilibrium is affected by cross-compartmental imbalance of protein folding analogous to our observations of an impairment of the redox state in the ER upon cytosolic protein aggregation (Fig 2). To induce the UPRER, we depleted ire-1 by RNAi (Fig EV3) and observed a shift towards oxidizing conditions in the cytosol (Fig 3D).
Figure 3. Chronic proteotoxic stress is associated with a shift towards more oxidizing conditions in the cytosol.

- Ratio-metric analysis of cytosolic roGFP in 4-day-old C. elegans upon expression of Q40-RFP in the cytosol of muscle tissue. The co-expression of polyQ in the same tissue is associated with a shift towards oxidizing conditions. Twenty nematodes each were analysed. The data are presented as means ± SD with a P-value of 1.94 × 10⁻¹¹. Scale bars are 15 μm.
- Expression of Q77-mCherry, but not Q19, is associated with a shift towards oxidizing conditions in the cytosol in HeLa cells. 16, 31, 33, 27, 47 and 13 HeLa cells were analysed for fully oxidized, Q19-mCherry, Q77-mCherry, HttQ22-mCherry, HttQ134-mCherry and fully reduced conditions, respectively. The upper row shows the overlay images of cyto-roGFP1 upon excitation at 405 and 488 nm. The middle row shows the red channel for the polyQ-mCherry fusion proteins to show the aggregation propensity of Q77-mCherry and HttQ134-mCherry. The bottom row displays the overlay images from the upper two rows. On the top left, the 405/488 nm overlay image of the DTT (5 mM) control is shown and on the top right the respective overlay image of the DPS control (1 mM). Scale bars are 10 μm. The data are presented as means ± SD and are shown on the left. The ratio-metric analyses between HttQ22, HttQ134, Q19 and Q77 passed the ANOVA (F = 14; P > 0.0001) and the post hoc Tukey's HSD test confirmed a significant difference between HttQ22 versus HttQ134, HttQ22 versus Q19, HttQ134 versus Q19 and Q19 versus Q77. The difference between HttQ22 versus Q77 and HttQ134 versus Q77 is non-significant.
- Ratio-metric analyses of cytosolic HyPer in 4-day-old nematodes expressing Q40-RFP (right column) or RFP alone (left column, control) in muscle tissue. The increase in the ratio indicates a higher cytosolic concentration of H2O2 upon Q40-RFP expression. The data are presented as means ± SD with a P-value of 1.23 × 10⁻⁷.
- Ratio-metric analysis of cytosolic roGFP in muscle tissue in 4-day-old nematodes upon RNAi-mediated knockdown of ire-1 or skn-1. Depletion of ire-1 and skn-1 is associated with a shift towards oxidizing conditions in the cytosol. Twenty nematodes each were analysed. The data are presented as means ± SD. The ratio-metric analyses between the cyto-roGFP control, cyto-roGFP ire-1 RNAi, cyto-roGFP tunicamycin (Tm) and cyto-roGFP skn-1 RNAi passed the ANOVA (F = 31; P > 0.0001) and the post hoc Tukey's HSD test confirmed a significant difference between control versus ire-1 RNAi, control versus Tm, control versus skn-1 RNAi, ire-1 RNAi versus Tm and Tm versus skn-1 RNAi. The difference between ire-1 RNAi versus skn-1 RNAi is non-significant.
Taken together, we conclude that the cytosolic milieu becomes more oxidized upon imbalance of proteostasis. The change towards oxidizing conditions in the cytosol is not limited to perturbations of protein folding conditions within the cytosol, but also acts across sub-cellular compartmental boundaries.
Proteasome inhibition is associated with redox perturbation in the ER and cytosol
It has been established that protein misfolding and aggregation induced by the expression of polyQ proteins inhibits the proteasome (Holmberg et al, 2004; Bennett et al, 2007; Hipp et al, 2012). Conversely, inhibition of the proteasome leads to an accumulation of misfolded and aggregated proteins in the cytosol and nucleus and thereby exacerbates an imbalance of proteostasis (Ciechanover & Brundin, 2003). Accordingly, we observed an accumulation of the short-lived fluorescent protein, YFP-CL1, by flow cytometry analysis in Q77-mCherry-expressing HeLa cells, similar to control cells treated with the proteasome inhibitor, epoxomicin (Fig EV4A). This was observed as a delay in degradation of ubiquitinated proteins in Q77-mCherry-expressing cells, consistent with proteasome inhibition and supportive of the experimental conditions for performing subsequent redox analysis (Fig EV4B). To examine how the proteasome and redox homeostasis are linked with respect to both the cytosol and the ER, we analysed the redox state in both compartments upon inhibition of the proteasome using the roGFP sensors. Exposure to the proteasome inhibitor epoxomicin in both, C. elegans and HeLa cells resulted in a shift towards more reducing conditions in the ER and more oxidizing conditions in the cytosol (Fig 4A–D). These findings were extended using the HyPer sensor and we observed a decrease in the H2O2 content in the ER upon epoxomicin treatment in C. elegans (neuronal and muscle tissue) and in HeLa cells (Fig 4E and F). Taken together, inhibition of proteasomal activity is accompanied with an opposing change in the redox state in the cytosol and the ER and thus exhibits the same behaviour as imbalance of proteostasis caused by the expression of aggregation-prone proteins.
Figure EV4. Proteasome inhibition by polyQ.
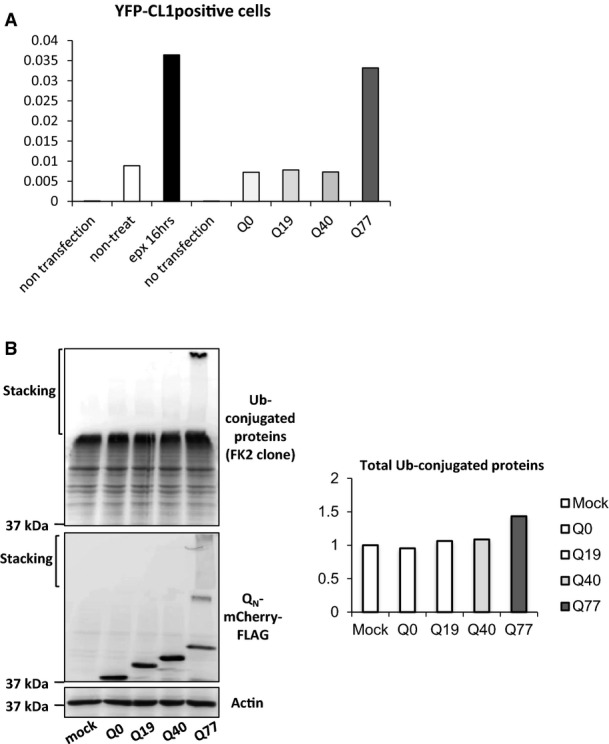
- Activity of proteasome is decreased in epoxomicin-treated or Q77-mCherry-expressing HeLa cells. Proteasome activity was monitored by the intensity of degradation signal of YFP-tagged CL1(YFP-CL1). The fraction of YFP-CL1-positive cells was determined by FACS analysis.
- Accumulation of ubiquitinated proteins in HeLa cells expressing Q77, but not Q0, 19 and 40. Abundance of ubiquitination was analysed by Western blot (left).
Figure 4. Proteasome inhibition is associated with redox perturbation in the ER and cytosol.

- A–D Treatment with the proteasome inhibitor epoxomicin (epx) is associated with a shift towards reducing conditions in the ER and a shift towards oxidizing conditions in the cytosol in C. elegans (A, B) and HeLa cells (C, D), respectively. The linear range of the ratio-metric analysis is indicated by the values for the fully reduced/oxidized state of the sensors.
- E, F Treatment with epoxomicin is associated with a decrease in H2O2 levels in the ER in neuronal and muscle cells in C. elegans (E) and HeLa cells (F).
Source data are available online for this figure.
Profound changes in the redox state throughout the lifespan of C. elegans
Ageing is accompanied by an accumulation of protein aggregates, a decline in the induction of chaperones and proteases as well as decreased protein synthesis (Ben-Zvi et al, 2009; David et al, 2010; Vilchez et al, 2012, 2014; Kirstein-Miles et al, 2013). Given our results (Figs 4), one might expect a progression of redox shifts in opposing directions in both compartments, although little is known about the redox state and consequently the folding capacity of the ER during ageing. To address this, we synchronized C. elegans expressing the roGFP sensor in the ER and determined the 405/488 nm ratios during development (days 1 (L1 stage), 2 (L2/3 stage) and 4 + 5 (young adults)) and ageing (days 6–13). As shown in Fig 5A and B, the redox state of the ER is subject to changes throughout the life of the animal. The ER is most oxidized on day 1 of life (L1 stage) and then shifts to slightly more reducing conditions on day 2 before becoming more oxidized through days 4 and 5 (young adults) when it reaches its second peak of oxidation. However, from day 5 onwards, the redox state of the ER changes towards reducing conditions. Notably, this time point (day 5) marks the peak of fecundity and a stage when protein quality control processes such as the induction and capacity of stress response pathways and rate of protein synthesis start to decline and protein aggregates accumulate (Ben-Zvi et al, 2009; David et al, 2010; Kirstein-Miles et al, 2013). The shift towards reducing conditions in the ER continues through the late stages of ageing (day 13).
Figure 5. Profound changes of the redox state throughout the lifespan of an animal.

- A–E Analysis of the emission intensities of roGFP excited at 405 and 488 nm during ageing in the ER (A-C) and the cytosol (D, E) of muscle tissue in C. elegans. Animals were synchronized, and 20 animals were analysed at the indicated time points. Day 1 represents day 1 of life (L1 stage) and adulthood is reached on day 4. The images show representative merged images upon subsequent excitation of 405 and 488 nm of single cells that were analysed. Scale bars are 10 μm. The ratio-metric quantification of (A) and (D) is depicted in (B) and (E), respectively. (C) Ratio-metric analysis of the redox state of the ER of nematodes using roGFP on days 4, 6 and 10 in control animals and daf-2 and daf-16 animals. The ratio-metric analyses of the days 4, 6 and 10 samples between the control, daf-2 and daf-16 mutants passed the ANOVA (F = 11 (day 4); F = 23 (day 6) and F = 96 (day 10); P > 0.0001) and the post hoc Tukey's HSD test confirmed a significant difference for day 4 samples between control versus daf-16 and daf-2 versus daf-16. The difference between control versus daf-2 is non-significant. For day 6 samples, the post hoc Tukey's HSD test confirmed a significant difference between control versus daf-16 and daf-2 versus daf-16. The difference between control versus daf-2 is non-significant. For day 10 samples, the post hoc Tukey's post hoc HSD test confirmed a significant difference between control versus daf-2 and daf-2 versus daf-16. The difference between control versus daf-16 is non-significant.
Next, we analysed changes in the cytosolic redox state throughout development and ageing (Fig 5D and E). The redox state in the first larval stage (day 1) is at its most reduced state and thus opposite to the redox state of the ER. During development, the cytosol becomes more oxidized until day 3 (L4 stage) before it shifts again to slightly more reducing conditions on days 4 and 5 (young adults), again contrasting with the redox state of the ER. With the progression of ageing, the redox state changes to oxidizing conditions, in opposing behaviour to the ER redox state (Fig 5A–D). Our observations of the cytosolic redox state are similar to those obtained in a previous study of whole animal analyses that also employed the HyPer sensor (Back et al, 2012; Knoefler et al, 2012). The opposing redox state during ageing, however, is not unexpected given the antagonistic response in both compartments to proteotoxic stress induced either by inhibition of the proteasome or by expression of aggregation-prone proteins (Figs 4). To examine whether genetic manipulation of lifespan affects redox homeostasis in the ER, we employed mutations of the insulin-signalling pathway that either extend or shorten lifespan. These two genetic backgrounds have been previously employed to analyse the cytosolic redox state (Knoefler et al, 2012); therefore, we asked whether the ER redox state is also linked to the lifespan. We analysed the ER redox state of 4-, 6- and 10-day-old daf-2 and daf-16 mutants and in wild-type animals and observed that the daf-2 mutants that extend lifespan exhibit a delayed decline in the oxidizing conditions compared to the control animals. Contrary to that, daf-16 mutant animals exhibit a more rapid decline in the oxidizing conditions during ageing (Fig 5C). We conclude that the redox state changes reversibly with ageing.
Cross-tissue perturbation of redox homeostasis in response to proteotoxic stress
It has been established that stress response pathways can also be regulated in a cell non-autonomous manner and that tissues can orchestrate an organismal-wide stress response (Prahlad et al, 2008; Durieux et al, 2011; Prahlad & Morimoto, 2011; van Oosten-Hawle et al, 2013; Taylor & Dillin, 2013). We have demonstrated that protein folding conditions affect the redox balance within the same compartment (cytosol and ER), but also beyond organelle boundaries from the cytosol to the ER and vice versa (Figs 2 and 3). These observations lead to the question whether the redox state in one tissue is affected by proteostatic challenges in a distal tissue and whether the maintenance of redox homeostasis is regulated on an organismal level. To address this, we employed the neuronal cytosolic roGFP sensor and crossed this line with a strain expressing either RFP (Q0) alone (control) or Q40-RFP expressed in the cytosol of muscle tissue. Proteotoxic stress is associated with a shift towards oxidizing conditions in the cytosol (Fig 3A), leading us to ask whether neuronal cells would also shift towards more oxidizing conditions in response to polyQ expression in the muscle. Indeed, the redox state shifted towards more oxidizing conditions and thus responded to proteotoxic stress in the muscle (Fig 6A). We then asked whether the communication is directional from muscle to neurons or whether proteotoxic stress in neurons would also affect the redox state in muscle. To address this, we crossed the neuronal cytosolic Q0 and Q40 lines with the muscle cytosolic roGFP line. The muscle cells responded to proteotoxic perturbations caused by neuronal Q40 expression with a shift towards oxidizing conditions in the cytosol (Fig 6B). These findings reveal that proteostatic imbalances in one tissue are communicated to a distal tissue in a bilateral manner between neurons and muscle.
Figure 6. Cross-tissue perturbation of redox homeostasis in response to proteotoxic stress.
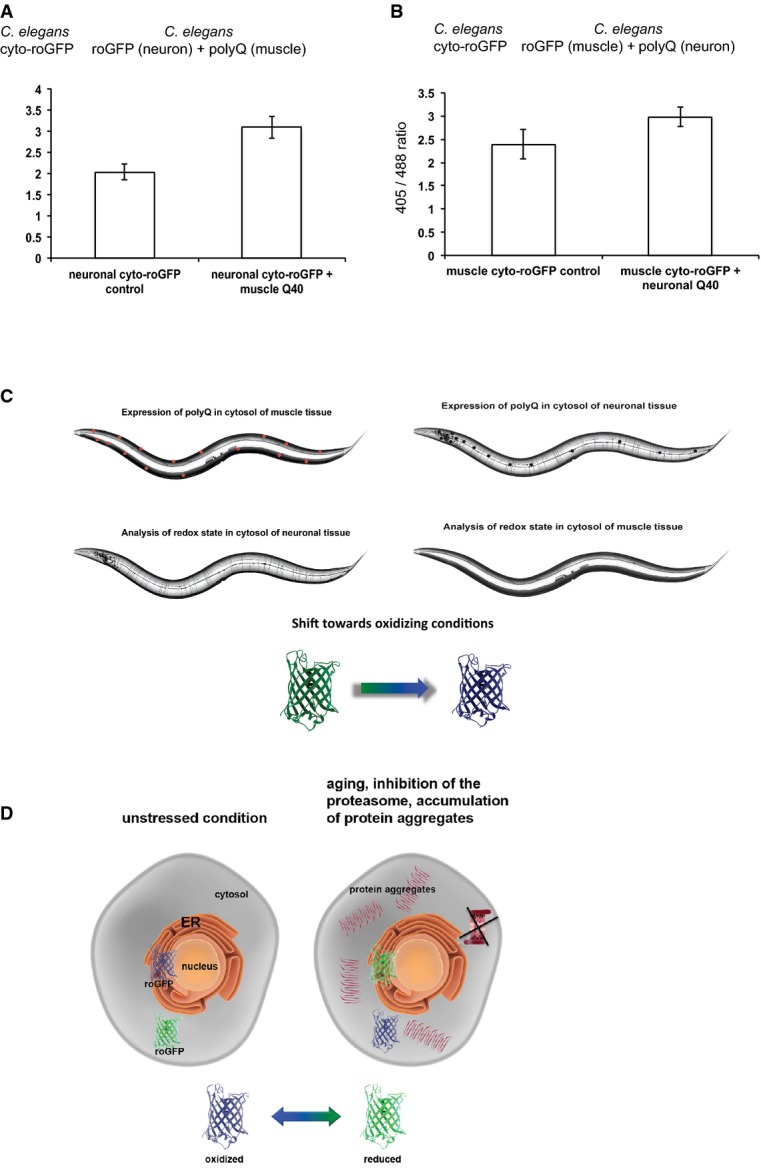
- Analysis of the redox state of the cytosol of neuronal tissue upon expression of Q40-RFP in muscle tissue of the same animal. Ratio-metric analysis using roGFP expressed in neurons reveals a shift towards oxidizing conditions upon polyQ expression in the cytosol of muscle tissue. The ratio-metric analyses between neuronal roGFP control and neuronal roGFP + muscle Q40 passed the ANOVA (F = 1292; P > 0.0001) and the post hoc Tukey's HSD test confirmed a significant difference between neuronal roGFP control versus neuronal roGFP + muscle Q40.
- As in (A), polyQ expression in neuronal tissue is associated with a shift towards oxidizing conditions in the cytosol of muscle tissue. The analysis was carried out analogous to (A). Twenty nematodes were analysed for both experiments and the imaging was carried out on a single-cell level. The ratio-metric analyses between muscle roGFP control and muscle roGFP + neuronal Q40 passed the ANOVA (F = 199; P > 0.0001) and the post hoc Tukey's HSD test confirmed a significant difference between muscle roGFP control versus muscle roGFP + neuronal Q40.
- Cartoon image of the trans-tissue connection between the redox and protein homeostasis between neuronal and muscle tissue. Imbalance of proteostasis in either tissue is associated with a cytosolic oxidation in the distal tissue.
- Cartoon summarizing the relationship between redox and protein homeostasis. Proteotoxic challenges are transmitted in a cross-compartmental manner and affect the ER (change towards reducing conditions) and cytosolic redox state (change towards oxidizing conditions) in an opposing manner.
Discussion
Our analysis of the redox state of C. elegans shows that redox homeostasis is highly regulated at a compartmental, cellular, tissue and organismal level throughout development, ageing and in response to proteotoxic stress. By employing two genetically encoded redox sensors, we show that (i) the redox state in the cytosol and the ER change in an opposing manner in response to proteotoxic challenges in both C. elegans and in HeLa cells. While the ER becomes more reduced upon expression of aggregation-prone proteins, inhibition of the proteasome or during ageing, the cytosol becomes more oxidizing in response to these challenges (Fig 6D). (ii) The redox state of the cytosol and the ER are affected by the folding environment beyond compartmental boundaries. Perturbations of protein folding conditions in the same as well as in the other organelle trigger adaptations of the redox state in the cytosol and the ER. (iii) The redox state is subject to profound fluctuations in both compartments during development. It has been previously proposed that ROS can also acquire a role as a secondary messenger (Rhee, 2006; Bashan et al, 2009). Here, we have observed that neurons exhibit a higher basal level of H2O2 in the ER relative to muscle cells, suggesting that H2O2 may have a more substantial role as a secondary messenger molecule for redox signalling in neurons, and (iv) redox homeostasis is regulated and tightly linked to overall organismal control of proteostasis such that an imbalance in the folding environment of neurons affects not only the redox state of neuronal cells, but also that of distal tissues such as muscle cells, and vice versa (Fig 6C). These findings suggest a cell non-autonomous response to proteotoxic challenges with an adaptation in its redox state. This conclusion is further supported by our data that lifespan extension in daf-2 animals delays the oxidation of the cytosol and the shift towards reducing conditions in the ER, whereas short-lived daf-16 animals decline more rapidly in the maintenance of redox homeostasis (Fig 5C).
The striking observation that proteotoxic challenges have opposing effects on redox homeostasis of the cytosol and the ER raises questions on the underlying mechanism. Several scenarios can explain these observations. First, the integrity of the ER membrane could be compromised leading to leakage and an exchange of oxidizing and reducing agents such as NADP/NADPH, H2O2 and GSH/GSSG between the cytosol and the ER. Protein aggregates could also interfere with or inhibit putative transporters of, for example, GSH and H2O2 or compromise the lipid bilayer of the ER membrane. Misfolded and aggregated proteins with exposed hydrophobic patches could directly interact with the lipid bilayer and affect membrane integrity, thereby allowing passage of small molecules such as ROS. This scenario would predict that the redox state of the cytosol and the ER approaches each other in response to stress and during ageing. In support of such a hypothesis, we observed an opposing shift of the redox state in response to proteostatic challenges in the cytosol versus ER. Further support for a breakdown of the organellar integrity stems from findings that several PDI family proteins co-aggregate with cytosolic polyQ (Kirstein-Miles et al, 2013). This observation also suggests that members of the redox network are meta-stable proteins whose function is compromised upon protein folding challenges. Our observations could also be explained by inhibition of the ERAD machinery that would imbalance folding conditions in the ER and result in enhanced misfolding of ER-resident proteins such as oxidoreductases or PDIs. The presence of protein aggregates induced either by the expression of disease proteins or by the accumulation of misfolded and aggregated proteins during ageing is known to interfere with proteasome activity. Consequently, ER-resident misfolded proteins that require retro-translocation into the cytosol for their proteolytic turnover by the proteasome could then not be efficiently cleared, thus causing an imbalance in the ER folding environment and affecting the function of the redox network. Alternatively, it is possible that the redox surveillance system fails in both compartments during ageing and stress. Knockdown of the major oxidase ero-1 results in a profound shift towards reducing conditions in the ER and has severe organismal consequences such as sterility and larval arrest (Rual et al, 2004). The ER is equipped with a large number of oxidases and PDI family oxidoreductases, which is further complicated by the intrinsic nature of PDIs to work in both directions: to reduce S-S bonds and to oxidize free thiols to form S-S bonds, and that the activity of each PDI is highly coordinated and fine-tuned with respect to spatial and temporal requirements (Sevier & Kaiser, 2008; Kakihana et al, 2012). In addition, PDIs have a defined place in the redox cascade in the formation of disulphide bonds in substrate proteins (Araki et al, 2013). Therefore, it would be very challenging to perform a systematic analysis of every PDI on the maintenance of the redox homeostasis.
At the organismal level, much less is known about the contribution and availability of ER oxidases and PDIs for the maintenance of a balanced redox homeostasis across tissues. A thorough analysis of the expression pattern throughout development, ageing and in response to stress conditions in particular with respect to different cell types will be required for a more complete understanding. Our observation of an organismal redox adjustment in response to proteotoxic challenges in a specific cell type poses the question of the nature of the signal for this regulation. One possibility is an endocrine-like signalling as has been speculated for organismal mitochondrial stress response pathways (Durieux et al, 2011). Alternatively, imbalances of proteostasis might affect the folding conditions of other cell types and those perturbations in turn might then affect the redox state in the respective cell. This could involve the transmission of misfolded and aggregated proteins to neighbouring cells or tissues (Nussbaum-Krammer et al, 2013). The proteotoxicity is thus transmitted and the redox homeostasis responds to the intracellular imbalance of proteostasis as shown in Fig 3A and B. Moreover, it has recently been shown that chaperone levels are adjusted in a trans-tissue manner (van Oosten-Hawle et al, 2013) and thus could also contribute to the observed redox signalling events. Although we have observed effects on redox signalling in both directions, not only from neurons to muscle, but also from muscle to neurons, it remains to be investigated whether the redox homeostasis of all compartments, cell types and tissues is regulated on an organismal level.
Materials and Methods
Cells, antibodies and plasmids
HeLa cells were cultured in Dulbecco's modified Eagle's medium with 10% foetal bovine serum and antibiotics. The primary antibodies used in the experiments were as follows: mouse monoclonal anti-GFP (Roche Applied Science, Basel, Switzerland), mouse monoclonal anti-FLAG (Sigma-Aldrich), mouse monoclonal anti-β-actin (Millipore), mouse monoclonal anti-ubiquitin-conjugated proteins (FK-2 clone) (Enzo Life Sciences), KDEL rabbit polyclonal antibody (Thermo Scientific) and Alexa Fluor 594 goat anti-rabbit IgG (Invitrogen). The secondary antibodies used in the experiments were HRP-anti-rabbit IgG and HRP-anti-mouse IgG (Invitrogen). pmCherry-C1 was purchased from Clonetech. mCherry-FLAG (Q0) was sub-cloned into pcDNA3.1(−) with BamHI and HindIII sites. DsRed-KDEL was purchased from Clonetech. The glutamine repeats of Q19-YFP, Q40-YFP and Q77-YFP (Kitamura et al, 2006) were sub-cloned into mCherry-FLAG with EcoRI and BamHI sites. YFP-CL1 was purchased from Addgene. Intact cytosolic HyPer was purchased from Evrogen. HyPer-ER was sub-cloned into pcDNA3.1(−) in frame with signal sequence of HSP47 at N-terminus and ER retention signal (RDEL) at C-terminus. HttQ22-mCherry and HttQ134-mCherry contain htt exon1 and the extended polyQ region and were sub-cloned into pcDNA3.1(-) using BamHI and HindIII sites. Intact cytosolic roGFP is a kind gift from Dr. James Remington (University of Oregon, USA). ER-roGFPiE was cloned as described previously (Kakihana et al, 2013).
C. elegans clones
roGFP1 was PCR-amplified using the forward primer: GGGGACAAGTTTGTACAAAAAAGCAGGCTGGATGCTGCTATCCGTGCCGTTGCTGC and reverse primer GGGGACCACTTTGTACAAGAAAGCTGGGTGTTACAGCTCGTCCTTCTTGTACAGC. HyPer was PCR-amplified using the forward primer: GGGGACAAGTTTGTACAAAAAAGCAGGCTGGATGCGCTCCCTCCTGCTTCCAGCGCC and reverse primer: GGGGACCACTTTGTACAAGAAAGCTGGGTGCTATAACTCGTCTCGAACCGCCT. The targeting to the ER was achieved by including the signal sequence of mammalian calreticulin and Hsp47 for roGFP and HyPer, respectively. The ER retention sequences were KDEL and RDEL for roGFP and HyPer. The PCR products were then cloned into the pDONR221 vector of the Invitrogen Gateway system according to the manufacturer's protocol. pDONR221-containing ER-roGFP1 was subsequently recombined with a vector containing the intergenic region upstream (promoter) of unc-54 (muscle expression) or of F25B3.3 (pan-neuronal expression) and a vector containing the 3′ UTR of unc-54 into the destination vector pDESTR4R3 of the Invitrogen Gateway system according to the manufacturer's protocol. The resulting vector was sequenced to test for the correct sequence and orientation of the insert.
Extra-chromosomal transgenic strains were obtained by microinjection. The injection mixture consisted of 100 ng/μl plasmid containing the transgene of interest and 50 ng/μl of a plasmid containing Pmyo-2::mCherry as co-injection marker to screen for transgenic animals. The extra-chromosomal arrays were integrated by exposing the animals to γ-irradiation that were subsequently backcrossed three times.
C. elegans strains
Strains in this study were as follows: N2, Punc-54::ER_roGFP + myo-2::mCherry, Punc-54::cyt_roGFP + myo-2::mCherry, Punc-54::ER_HyPer + myo-2::mCherry, PF25B3.3::ER_HyPer + myo-2::mCherry, Pmyo-3::cyt_HyPer + myo-2::mCherry, Pmyo-3::cyt_HyPerC199S + myo-2::mCherry, AM1065 (rmIs349 [myo3p::RFP]), AM1066 (rmIs350[unc-54p::Q40::RFP]), Phsp-3::yfp, FUH154 (β23::mCherry), FUH157(αS824::mCherry) and CL2006. Genetic crosses were generated between the sensors (roGFP and HyPer) and Q0-RFP, Q40-RFP, CL2006, FUH154, FUH157, CB1370 (daf-2 mutant) and CF1038 (daf-16 mutant). The resulting strains were singled to yield homozygous strains and then backcrossed three times.
Maintenance of nematodes
Nematodes were grown on NGM plates seeded with E. coli OP50 strain at 20°C. For synchronization, gravid adults from one 10-cm NGM plate were collected in a canonical tube and treated with 20% alkaline hypochlorite solution under vigorous agitation for 4 min. The eggs were then washed three times with cold 0.1 M NaCl solution. The eggs were allowed to hatch in M9 medium at 20°C for 22 h. The arrested L1 larvae were subsequently used for RNAi or lifespan experiments. For RNAi-mediated knockdown, L1 staged nematodes were transferred onto NGM plates containing IPTG that were seeded with E. coli expressing dsRNA against ero-1, skn-1 or ire-1.
Nematodes were transferred into liquid (S-Basal medium) for the stress experiments. The respective strains were exposed to DTT (5 mM), paraquat (0.1 mM), DPS (1 mM), H2O2 (10 μM) or epoxomicin (10 μM) before mounting onto glass slides for the ratio-metric imaging analysis.
For an analysis of the soluble and insoluble protein fraction (Fig EV1J), nematode samples were lysed in buffer containing 1% NP-40, 10% glycerol, 150 mM NaCl, 20 mM HEPES, pH 7.4 and sonicated for 5 min and then subjected to a centrifugation step of 5 min at 20,000 × g. The supernatant represented the soluble and the pellet the insoluble fraction.
Imaging analysis of nematodes
For imaging, nematodes were mounted on 2% agarose (Sigma) pads on glass slides and immobilized with 2 mM levamisole (Sigma). Images were taken on a Leica SP5 and a Zeiss LSM780 confocal microscope using a 63× objective. Individual cells of 20 animals were analysed for each condition and time point. Live nematodes were excited with 405 and 488 nm lasers, and the emission was detected at 509 nm. Images were analysed using the LAS AF (Leica) and Zen (Zeiss) software packages to calculate the ratios of emissions. The ratios were determined from average intensities of individual cells from background-subtracted images. The images resulting upon excitation at 405 nm are false-coloured in blue and those upon excitation at 488 nm in green. Immunofluorescence was carried out as described earlier (Kirstein-Miles et al, 2013) using the primary KDEL antibody in a dilution of 1:100 and the secondary Alexa Fluor 594-conjugated antibody in a dilution of 1:500.
Transfection and Western blot
Plasmids were transfected using Effectene (Qiagen), according to the manufacturer's instructions. Cells were extracted with 1% NP-40, 150 mM NaCl, 50 mM Tris–HCl (pH 8.0), and 20 mM N-ethylmaleimide, 1 μg/ml leupeptin and pepstatin. The detergent-soluble and detergent-insoluble fractions of cell lysates were analysed by Western blot. For detection of ERroGFPiE, lysates immunoprecipitated with anti-GFP were loaded. Western blot images were acquired with the FLA-9000 Starion (Fujifilm Life Science) and quantified with ImageJ.
Live-cell microscopy and image analysis of HeLa cells
After medium change with Optimem, cells grown on glass bottom dish (Iwaki) were transferred onto a stable heating insert for microscopy, where the cells were supplied with 5% CO2 at 37°C. A confocal laser scanning microscope, LSM700, equipped with a C-Apochromat 40×/1.20 water immersion lens was used to image the cells. For live imaging, cells were excited with the 405 and 488 nm lasers in 1 and 2% laser power, respectively. Fluorescence emission was detected by band-pass filter 490/555 nm for detection of roGFP and HyPer sensors and long-pass filter 560 nm for detection of mCherry. Images were analysed with ZEN software (Carl Zeiss, Germany). 405:488 nm ratios were determined from average intensities of regions of interest. For washing out reagents from medium during live-cell imaging, medium change was performed at a speed of 1.5 ml/min with Econo gradient pump (Bio-Rad, CA, USA).
Flow cytometry
Cells were harvested 48 h after transfection and analysed with a flow cytometer (FACSCalibur, BD) and Cell Quest Pro software (BD). A total of 100,000 cells were analysed per condition. For detection of YFP fluorescence, 488 nm laser and emission band-pass filter 515/545 nm were used, and for detection of mCherry fluorescence, 488 nm laser and emission band-pass filter 564/606 nm were used.
Statistical analysis
Raw data and statistical evaluations for ratio-metric measurements are listed as source data for the relevant figures. All data are presented as the means ± standard deviation (SD) as indicated in the text, figure and figure legends. The statistical significance was evaluated using Student's t-test or ANOVA as indicated. P < 0.01 was considered statistically significant. Every ANOVA was followed up by a post hoc analysis using the Tukey's honest significance difference (HSD) test. This test identifies the difference between two means that is greater than the expected standard error. The results of the post hoc Tukey's HSD tests are listed together with the respective raw data and the ANOVAs. Whether or not the pairwise analyses of the analysed groups have passed the post hoc HSD test is indicated in the figure legends.
Acknowledgments
This study was supported by a Human Frontiers Science Program (HFSP) grant awarded to FUH, KN and RIM. RIM was also supported by grants from the National Institutes of Health (NIGMS, NIA), the Ellison Medical Foundation, JSPS, and the Daniel F. and Ada L. Rice Foundation. KN was also supported by JST, CREST, KAKENHI grant ID 24227009 and by JSPS, Grant-in-Aid for Scientific Research. JK was supported by a HFSP postdoctoral fellowship and is currently supported by the DFG funded Excellence Cluster “NeuroCure” EXC257 and the SFB740. We are grateful for the kind help by Kazutaka Araki, Masatoshi Hagiwara and Jun Hoseki (Kyoto Sangyo University, Japan). We thank James Remington (University of Oregon, USA) for cytosolic intact roGFP and Ivan Bogeski (Saarland University, Germany) for HyPerC199S. We thank Annika Scior (FMP, Berlin) for critical reading of the manuscript.
Author contributions
JK, DM, MSH, KN, RIM and FUH conceived this study. JK designed, performed and analysed all C. elegans experiments. AM aided in the initial phase of this project with the construction of some of the genetic C. elegans lines and initial imaging analysis. CNK contributed the C. elegans strains AM1065 and AM1066. PK contributed the strains FUH154 and FUH157. DM, TK and MS performed and analysed the cell culture data. JK, DM, TK, KN, FUH and RIM interpreted the data. JK wrote the paper with input from RIM, FUH, MSH, KN, DM and TK. [Correction added on 14 September 2015, after first online publication: the contribution of Prasad Kasturi has been added.]
Conflict of interest
The authors declare that they have no conflict of interest.
Supporting Information
Expanded View Figures PDF
Source Data for Expanded View
Review Process File
Source Data for Figure 1
Source Data for Figure 2
Source Data for Figure 3
Source Data for Figure 4
Source Data for Figure 5
Source Data for Figure 6
References
- Araki K, Nagata K. Functional in vitro analysis of the ERO1 protein and protein-disulfide isomerase pathway. J Biol Chem. 2011a;286:32705–32712. doi: 10.1074/jbc.M111.227181. [DOI] [PMC free article] [PubMed] [Google Scholar]
- Araki K, Nagata K. Protein folding and quality control in the ER. Cold Spring Harb Perspect Biol. 2011b;3:a007526. doi: 10.1101/cshperspect.a007526. [DOI] [PMC free article] [PubMed] [Google Scholar]
- Araki K, Nagata K. Protein folding and quality control in the ER. Cold Spring Harb Perspect Biol. 2012;4:a015438. doi: 10.1101/cshperspect.a015438. [DOI] [PMC free article] [PubMed] [Google Scholar]
- Araki K, Iemura S, Kamiya Y, Ron D, Kato K, Natsume T, Nagata K. Ero1-alpha and PDIs constitute a hierarchical electron transfer network of endoplasmic reticulum oxidoreductases. J Cell Biol. 2013;202:861–874. doi: 10.1083/jcb.201303027. [DOI] [PMC free article] [PubMed] [Google Scholar]
- Back P, De Vos WH, Depuydt GG, Matthijssens F, Vanfleteren JR, Braeckman BP. Exploring real-time in vivo redox biology of developing and aging Caenorhabditis elegans. Free Radic Biol Med. 2012;52:850–859. doi: 10.1016/j.freeradbiomed.2011.11.037. [DOI] [PubMed] [Google Scholar]
- Bashan N, Kovsan J, Kachko I, Ovadia H, Rudich A. Positive and negative regulation of insulin signaling by reactive oxygen and nitrogen species. Physiol Rev. 2009;89:27–71. doi: 10.1152/physrev.00014.2008. [DOI] [PubMed] [Google Scholar]
- Belousov VV, Fradkov AF, Lukyanov KA, Staroverov DB, Shakhbazov KS, Terskikh AV, Lukyanov S. Genetically encoded fluorescent indicator for intracellular hydrogen peroxide. Nat Methods. 2006;3:281–286. doi: 10.1038/nmeth866. [DOI] [PubMed] [Google Scholar]
- Bennett EJ, Shaler TA, Woodman B, Ryu KY, Zaitseva TS, Becker CH, Bates GP, Schulman H, Kopito RR. Global changes to the ubiquitin system in Huntington's disease. Nature. 2007;448:704–708. doi: 10.1038/nature06022. [DOI] [PubMed] [Google Scholar]
- Ben-Zvi A, Miller EA, Morimoto RI. Collapse of proteostasis represents an early molecular event in Caenorhabditis elegans aging. Proc Natl Acad Sci USA. 2009;106:14914–14919. doi: 10.1073/pnas.0902882106. [DOI] [PMC free article] [PubMed] [Google Scholar]
- Ciechanover A, Brundin P. The ubiquitin proteasome system in neurodegenerative diseases: sometimes the chicken, sometimes the egg. Neuron. 2003;40:427–446. doi: 10.1016/s0896-6273(03)00606-8. [DOI] [PubMed] [Google Scholar]
- David DC, Ollikainen N, Trinidad JC, Cary MP, Burlingame AL, Kenyon C. Widespread protein aggregation as an inherent part of aging in Caenorhabditis elegans. PLoS Biol. 2010;8:e1000450. doi: 10.1371/journal.pbio.1000450. [DOI] [PMC free article] [PubMed] [Google Scholar]
- Durieux J, Wolff S, Dillin A. The cell-non-autonomous nature of electron transport chain-mediated longevity. Cell. 2011;144:79–91. doi: 10.1016/j.cell.2010.12.016. [DOI] [PMC free article] [PubMed] [Google Scholar]
- Hanson GT, Aggeler R, Oglesbee D, Cannon M, Capaldi RA, Tsien RY, Remington SJ. Investigating mitochondrial redox potential with redox-sensitive green fluorescent protein indicators. J Biol Chem. 2004;279:13044–13053. doi: 10.1074/jbc.M312846200. [DOI] [PubMed] [Google Scholar]
- Harding HP, Zhang Y, Zeng H, Novoa I, Lu PD, Calfon M, Sadri N, Yun C, Popko B, Paules R, Stojdl DF, Bell JC, Hettmann T, Leiden JM, Ron D. An integrated stress response regulates amino acid metabolism and resistance to oxidative stress. Mol Cell. 2003;11:619–633. doi: 10.1016/s1097-2765(03)00105-9. [DOI] [PubMed] [Google Scholar]
- Hipp MS, Patel CN, Bersuker K, Riley BE, Kaiser SE, Shaler TA, Brandeis M, Kopito RR. Indirect inhibition of 26S proteasome activity in a cellular model of Huntington's disease. J Cell Biol. 2012;196:573–587. doi: 10.1083/jcb.201110093. [DOI] [PMC free article] [PubMed] [Google Scholar]
- Holmberg CI, Staniszewski KE, Mensah KN, Matouschek A, Morimoto RI. Inefficient degradation of truncated polyglutamine proteins by the proteasome. EMBO J. 2004;23:4307–4318. doi: 10.1038/sj.emboj.7600426. [DOI] [PMC free article] [PubMed] [Google Scholar]
- Kakihana T, Nagata K, Sitia R. Peroxides and peroxidases in the endoplasmic reticulum: integrating redox homeostasis and oxidative folding. Antioxid Redox Signal. 2012;16:763–771. doi: 10.1089/ars.2011.4238. [DOI] [PubMed] [Google Scholar]
- Kakihana T, Araki K, Vavassori S, Iemura S, Cortini M, Fagioli C, Natsume T, Sitia R, Nagata K. Dynamic regulation of Ero1alpha and peroxiredoxin 4 localization in the secretory pathway. J Biol Chem. 2013;288:29586–29594. doi: 10.1074/jbc.M113.467845. [DOI] [PMC free article] [PubMed] [Google Scholar]
- Kirstein-Miles J, Scior A, Deuerling E, Morimoto RI. The nascent polypeptide-associated complex is a key regulator of proteostasis. EMBO J. 2013;32:1451–1468. doi: 10.1038/emboj.2013.87. [DOI] [PMC free article] [PubMed] [Google Scholar]
- Kitamura A, Kubota H, Pack CG, Matsumoto G, Hirayama S, Takahashi Y, Kimura H, Kinjo M, Morimoto RI, Nagata K. Cytosolic chaperonin prevents polyglutamine toxicity with altering the aggregation state. Nat Cell Biol. 2006;8:1163–1170. doi: 10.1038/ncb1478. [DOI] [PubMed] [Google Scholar]
- Knoefler D, Thamsen M, Koniczek M, Niemuth NJ, Diederich AK, Jakob U. Quantitative in vivo redox sensors uncover oxidative stress as an early event in life. Mol Cell. 2012;47:767–776. doi: 10.1016/j.molcel.2012.06.016. [DOI] [PMC free article] [PubMed] [Google Scholar]
- Levine CG, Mitra D, Sharma A, Smith CL, Hegde RS. The efficiency of protein compartmentalization into the secretory pathway. Mol Biol Cell. 2005;16:279–291. doi: 10.1091/mbc.E04-06-0508. [DOI] [PMC free article] [PubMed] [Google Scholar]
- van Lith M, Tiwari S, Pediani J, Milligan G, Bulleid NJ. Real-time monitoring of redox changes in the mammalian endoplasmic reticulum. J Cell Sci. 2011;124:2349–2356. doi: 10.1242/jcs.085530. [DOI] [PMC free article] [PubMed] [Google Scholar]
- Margittai E, Low P, Stiller I, Greco A, Garcia-Manteiga JM, Pengo N, Benedetti A, Sitia R, Banhegyi G. Production of H(2)O(2) in the endoplasmic reticulum promotes in vivo disulfide bond formation. Antioxid Redox Signal. 2012;16:1088–1099. doi: 10.1089/ars.2011.4221. [DOI] [PubMed] [Google Scholar]
- Markvicheva KN, Bilan DS, Mishina NM, Gorokhovatsky AY, Vinokurov LM, Lukyanov S, Belousov VV. A genetically encoded sensor for H2O2 with expanded dynamic range. Bioorg Med Chem. 2011;19:1079–1084. doi: 10.1016/j.bmc.2010.07.014. [DOI] [PubMed] [Google Scholar]
- Meusser B, Hirsch C, Jarosch E, Sommer T. ERAD: the long road to destruction. Nat Cell Biol. 2005;7:766–772. doi: 10.1038/ncb0805-766. [DOI] [PubMed] [Google Scholar]
- Nussbaum-Krammer CI, Park KW, Li L, Melki R, Morimoto RI. Spreading of a prion domain from cell-to-cell by vesicular transport in Caenorhabditis elegans. PLoS Genet. 2013;9:e1003351. doi: 10.1371/journal.pgen.1003351. [DOI] [PMC free article] [PubMed] [Google Scholar]
- Oka OB, Bulleid NJ. Forming disulfides in the endoplasmic reticulum. Biochim Biophys Acta. 2013;1833:2425–2429. doi: 10.1016/j.bbamcr.2013.02.007. [DOI] [PubMed] [Google Scholar]
- Olzscha H, Schermann SM, Woerner AC, Pinkert S, Hecht MH, Tartaglia GG, Vendruscolo M, Hayer-Hartl M, Hartl FU, Vabulas RM. Amyloid-like aggregates sequester numerous metastable proteins with essential cellular functions. Cell. 2011;144:67–78. doi: 10.1016/j.cell.2010.11.050. [DOI] [PubMed] [Google Scholar]
- van Oosten-Hawle P, Porter RS, Morimoto RI. Regulation of organismal proteostasis by transcellular chaperone signaling. Cell. 2013;153:1366–1378. doi: 10.1016/j.cell.2013.05.015. [DOI] [PMC free article] [PubMed] [Google Scholar]
- Prahlad V, Cornelius T, Morimoto RI. Regulation of the cellular heat shock response in Caenorhabditis elegans by thermosensory neurons. Science. 2008;320:811–814. doi: 10.1126/science.1156093. [DOI] [PMC free article] [PubMed] [Google Scholar]
- Prahlad V, Morimoto RI. Neuronal circuitry regulates the response of Caenorhabditis elegans to misfolded proteins. Proc Natl Acad Sci USA. 2011;108:14204–14209. doi: 10.1073/pnas.1106557108. [DOI] [PMC free article] [PubMed] [Google Scholar]
- Rhee SG. Cell signaling. H2O2, a necessary evil for cell signaling. Science. 2006;312:1882–1883. doi: 10.1126/science.1130481. [DOI] [PubMed] [Google Scholar]
- Rual JF, Ceron J, Koreth J, Hao T, Nicot AS, Hirozane-Kishikawa T, Vandenhaute J, Orkin SH, Hill DE, van den Heuvel S, Vidal M. Toward improving Caenorhabditis elegans phenome mapping with an ORFeome-based RNAi library. Genome Res. 2004;14:2162–2168. doi: 10.1101/gr.2505604. [DOI] [PMC free article] [PubMed] [Google Scholar]
- Schwarzer C, Illek B, Suh JH, Remington SJ, Fischer H, Machen TE. Organelle redox of CF and CFTR-corrected airway epithelia. Free Radic Biol Med. 2007;43:300–316. doi: 10.1016/j.freeradbiomed.2007.04.015. [DOI] [PMC free article] [PubMed] [Google Scholar]
- Sevier CS, Kaiser CA. Ero1 and redox homeostasis in the endoplasmic reticulum. Biochim Biophys Acta. 2008;1783:549–556. doi: 10.1016/j.bbamcr.2007.12.011. [DOI] [PubMed] [Google Scholar]
- Taylor RC, Dillin A. XBP-1 is a cell-nonautonomous regulator of stress resistance and longevity. Cell. 2013;153:1435–1447. doi: 10.1016/j.cell.2013.05.042. [DOI] [PMC free article] [PubMed] [Google Scholar]
- Vilchez D, Morantte I, Liu Z, Douglas PM, Merkwirth C, Rodrigues AP, Manning G, Dillin A. RPN-6 determines Caenorhabditis elegans longevity under proteotoxic stress conditions. Nature. 2012;489:263–268. doi: 10.1038/nature11315. [DOI] [PubMed] [Google Scholar]
- Vilchez D, Simic MS, Dillin A. Proteostasis and aging of stem cells. Trends Cell Biol. 2014;24:161–170. doi: 10.1016/j.tcb.2013.09.002. [DOI] [PubMed] [Google Scholar]
- Wiseman RL, Koulov A, Powers E, Kelly JW, Balch WE. Protein energetics in maturation of the early secretory pathway. Curr Opin Cell Biol. 2007;19:359–367. doi: 10.1016/j.ceb.2007.05.005. [DOI] [PMC free article] [PubMed] [Google Scholar]
- Zito E, Chin KT, Blais J, Harding HP, Ron D. ERO1-beta, a pancreas-specific disulfide oxidase, promotes insulin biogenesis and glucose homeostasis. J Cell Biol. 2010;188:821–832. doi: 10.1083/jcb.200911086. [DOI] [PMC free article] [PubMed] [Google Scholar]
Associated Data
This section collects any data citations, data availability statements, or supplementary materials included in this article.
Supplementary Materials
Expanded View Figures PDF
Source Data for Expanded View
Review Process File
Source Data for Figure 1
Source Data for Figure 2
Source Data for Figure 3
Source Data for Figure 4
Source Data for Figure 5
Source Data for Figure 6