Abstract
The Dnmt2 enzyme utilizes the catalytic mechanism of eukaryotic DNA methyltransferases to methylate several tRNAs at cytosine 38. Dnmt2 mutant mice, flies, and plants were reported to be viable and fertile, and the biological function of Dnmt2 has remained elusive. Here, we show that endochondral ossification is delayed in newborn Dnmt2-deficient mice, which is accompanied by a reduction of the haematopoietic stem and progenitor cell population and a cell-autonomous defect in their differentiation. RNA bisulfite sequencing revealed that Dnmt2 methylates C38 of tRNA AspGTC, GlyGCC, and ValAAC, thus preventing tRNA fragmentation. Proteomic analyses from primary bone marrow cells uncovered systematic differences in protein expression that are due to specific codon mistranslation by tRNAs lacking Dnmt2-dependent methylation. Our observations demonstrate that Dnmt2 plays an important role in haematopoiesis and define a novel function of C38 tRNA methylation in the discrimination of near-cognate codons, thereby ensuring accurate polypeptide synthesis.
Keywords: (cytosine-5) tRNA methylation, Dnmt2, haematopoiesis, MSCs, translation fidelity
Introduction
Dnmt2 is the most conserved member of the DNA methyltransferase family, and Dnmt2 homologues can be found in nearly all species (Schaefer & Lyko, 2010). However, the lack of consistent phenotypic abnormalities in Dnmt2-deficient laboratory models has been a major obstacle in defining the biological function of Dnmt2 enzymes. For example, Dnmt2 mutant mice, flies, and plants were reported to be viable and fertile under standard laboratory conditions (Goll et al, 2006), while Dnmt2 morphant zebrafish embryos displayed developmental defects in the brain, retina, and liver (Rai et al, 2007). Further studies suggested context-dependent phenotypes and associated Dnmt2 with stress signaling in Drosophila (Schaefer et al, 2010), with nutrient signaling in S. pombe (Becker et al, 2012) and with RNA-mediated transgenerational inheritance in mice (Kiani et al, 2013).
Mouse Dnmt2 is a protein of 415 amino acids that contain all the characteristic sequence motifs of (cytosine-5) DNA methyltransferases (Wilkinson et al, 1995; Okano et al, 1998; Yoder & Bestor, 1998). However, the protein shows no defined DNA methyltransferase activity (Goll et al, 2006; Raddatz et al, 2013). Indeed, several studies have established that Dnmt2 enzymes are (cytosine-5) tRNA methyltransferases (Goll et al, 2006; Schaefer et al, 2010). In higher eukaryotes, (cytosine-5) tRNA methylation is found at positions 48/49, and 72, and in the anticodon loop at positions 34 and 38 (Motorin et al, 2010). The absence of a methyl group at these positions has been suggested to interfere with tRNA folding and stability, codon–anticodon interactions, and reading frame maintenance (Motorin & Grosjean, 2001; Agris, 2004; Begley et al, 2007; Grosjean et al, 2010; El Yacoubi et al, 2012; Guy et al, 2014; Hori, 2014). However, the precise mechanistic functions of this modification are still unknown. We have shown previously that Dnmt2 methylates several tRNAs, specifically at C38, and that Dnmt2-mediated C38 methylation protects tRNAs against cleavage by the ribonuclease angiogenin (Schaefer et al, 2010).
Besides Dnmt2, the NSun2 enzyme currently represents the only other known cytosine-5 tRNA methyltransferase in higher eukaryotes (Blanco et al, 2011). NSun2 mediates the methylation of tRNAs at C34, C48, C49, and C50 (Blanco et al, 2011, 2014; Tuorto et al, 2012), and NSun2-mediated methylation also protects tRNAs against angiogenin-mediated cleavage (Blanco et al, 2014). NSun2 mutant mice are viable with male sterility and neuro-developmental defects (Blanco et al, 2011, 2014; Hussain et al, 2013). Mice that lack both Dnmt2 and NSun2 show a quantitative loss of cytosine-C5 tRNA methylation and are characterized by more pronounced developmental defects and lethality (Tuorto et al, 2012). Steady-state levels of unmethylated Dnmt2/NSun2 substrate tRNAs were substantially reduced, which was associated with reduced rates of protein synthesis and cellular proliferation (Tuorto et al, 2012). These findings suggested an important role of cytosine-C5 tRNA methyltransferases in the regulation of protein translation. We have now performed a detailed analysis of the Dnmt2 mutant mouse phenotype with a specific focus on the haematopoietic system as a paradigm for cellular proliferation and differentiation. Our observations demonstrate a role of Dnmt2 in haematopoiesis and define a novel function of C38 tRNA methylation in the fidelity of protein synthesis.
Results
Pathological examination of Dnmt2-deficient mice
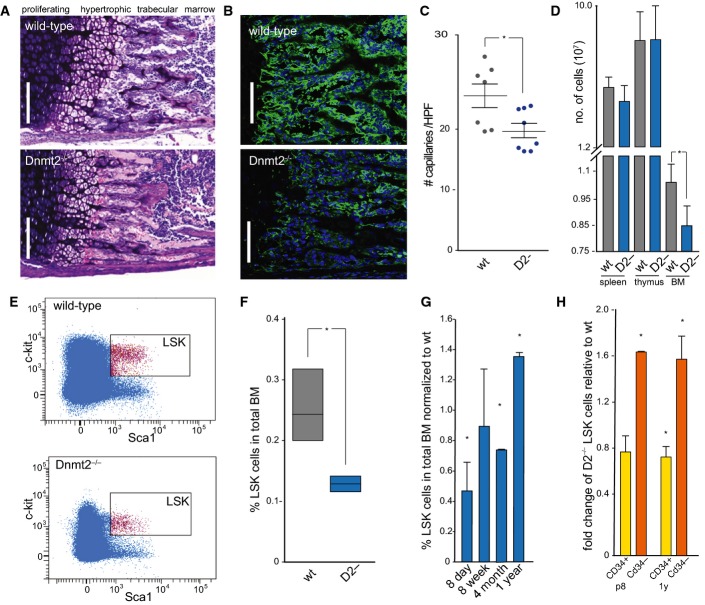
For a comprehensive phenotypical examination, Dnmt2−/− mice (Goll et al, 2006) were backcrossed into the C57BL/6 background for more than 10 generations, thus establishing a homogeneous genetic background for the evaluation of specific aberrant phenotypes. The resulting mice were viable and fertile with no overt phenotypic abnormalities. However, a detailed pathological examination of 8-day-old Dnmt2−/− mice revealed delayed endochondral ossification of the long bones (Fig 1A). We detected quantitative differences in the length of the zone of cell maturation and hypertrophy in the epiphyseal plate between wild-type (41.8 ± 1.9 μm, n = 10) and Dnmt2−/− mice (36.2 ± 1.7 μm, n = 8) as well as in the length of the trabecular zone between wild-type (86.4 ± 11.1 μm, n = 10) and Dnmt2−/− mice (74.3 ± 4.8 μm, n = 8). The trabecular structures were not only reduced in length but also appeared incorrectly interfaced with bone marrow cells (Fig 1A). Furthermore, the numbers of capillaries counted in the trabecular zone were significantly reduced (Fig 1B and C). Using GLS (Griffonia simplicifolia lectin), a specific marker for endothelial cells, we counted 21.2 ± 1.6 (n = 7) capillaries in wild-type and 16.4 ± 1.0 (n = 7) in femoral sections of Dnmt2−/− mice (Fig 1B and C). Further analysis also showed that the number of bone marrow cells that could be obtained from Dnmt2−/− femora was reduced by 20%, indicating that the bone marrow cellularity was significantly (P < 0.05, t-test) reduced in Dnmt2−/− mice (Fig 1D). This was confirmed by quantification of Lin(neg) Sca1+cKit+ (LSK) haematopoietic progenitor cells using flow cytometry, which revealed a 2.5-fold reduced frequency of LSK cells in Dnmt2−/− mice (Fig 1E and F).
Figure 1. Pathological examination of Dnmt2-deficient mice.
- Giemsa staining of a femoral section from 8-day-old mice showing endochondral ossification defects. Scale bar: 100 μm.
- Representative femur sections from 8-day-old wild-type and Dnmt2−/− mice. The staining of perivascular cells (GLS, green) is strongly reduced in Dnmt2−/− bone marrow. Nuclei are counterstained with DAPI. Scale bar: 100 μm.
- Quantitative analysis of capillary numbers. GLS-positive capillaries were counted in wild-type (wt) and Dnmt2−/− (D2-) mice, in three independent high-power fields (HPF) per mouse (n = 7).
- Quantification of cell numbers in haematopoietic tissues of 8-day-old mice (n = 8).
- Representative FACS plots of wild-type and Dnmt2−/− BM stained for Lin− Sca1+ and cKit+ cells.
- Quantification of bone marrow LSK cells in wild-type (three independent experiments, each with pooled BM samples from 4 to 6 mice) and Dnmt2−/− bone marrow (three independent experiments, each with pooled BM samples of 5–9 mice).
- Restoration of the LSK cell population in adult Dnmt2−/− mice. Frequencies of LSK cells were normalized to the frequencies of LSK cells from the bone marrow of wild-type littermates at the indicated age (2–3 independent experiments, each with pooled bone marrow samples from 3 to 9 mice).
- Increased LSK CD34− and reduced LSK CD34+ cell populations in 8-day- and 1-year-old Dnmt2−/− mice compared to wild-type (two independent experiments, each with pooled bone marrow samples from 3–9 mice).
LSK cells represent a heterogeneous cell population containing the most primitive haematopoietic cells that have self-renewal capacity and haematopoietic progenitors that give rise to all mature cell types found in peripheral blood for a lifetime (Ikuta & Weissman, 1992). However, in spite of the robust decrease in the number of LSK cells within the bone marrow of 8-day-old Dnmt2−/− mice, we could not observe any changes in frequencies or numbers of differentiated peripheral blood cell populations, neither in young (8 days) nor in adult (8 months) mice (Fig EV1A and B). We therefore asked whether the ratio of bone marrow LSK cells was still also altered in Dnmt2−/− mice with increasing age. Interestingly, we detected a restoration of the LSK cell population from 46.4 ± 19.01% (8 days) up to 130 ± 4.23% in 1-year-old Dnmt2−/− mice relative to wild-type (Fig G). The recovery of LSK cell numbers was also accompanied by a restoration of the bone marrow histology in adult mutants (Fig EV1C), which indicates that the decrease in the number of LSK cells in newborn mice is related to delayed niche development.
Figure EV1. Peripheral blood cell counts.
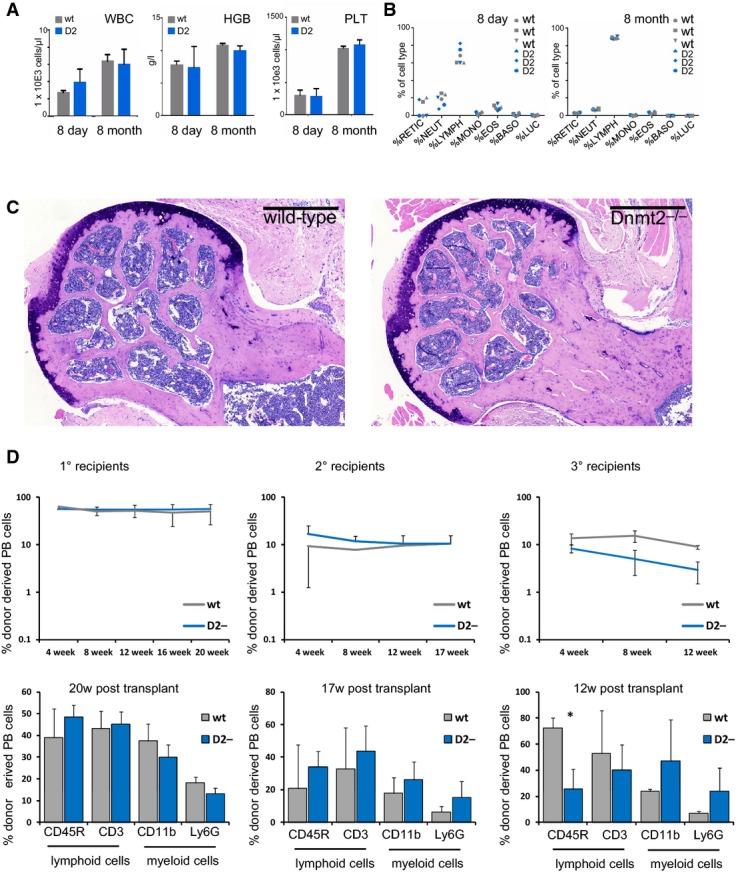
- Total blood cell counts of wild-type and Dnmt2−/− mice showing no significant differences. Total white blood cell counts, hemoglobin concentration, and platelet cell counts of wild-type and Dnmt2−/− mice (n = 3 mice per group). WBC: white blood cell counts; HGB: hemoglobin; PLT: platelets.
- Lineage distribution of peripheral blood analyzed by the ADVIA hematology analyzer system. RETIC: reticulocytes; NEUT: neutrophiles; LYMPH: lymphocytes; MONO: monocytes; EOS: eosinophiles; BASO: basophiles; LUC: large unstained cells.
- Giemsa staining of a representative femoral section from 4-month-old mice showing restoration of ossification defects. Scale bar: 500 μm.
- Stable engraftment (upper panels) and multi-lineage reconstitution (lower panels) in wild-type and Dnmt2−/− recipient mice. Donor chimerism is indicated by CD45.1 expression of peripheral blood (PB) cells using flow cytometry. Peripheral blood was collected monthly and analyzed for engraftment and lineage distribution (CD11b: macrophages; Ly6G: granulocytes; CD45R: B cells; CD3: T cells).
To further characterize the heterogeneous LSK cell fraction containing long-term self-renewing, non-self-renewing short-term reconstituting haematopoietic stem cells as well as multi-potent progenitors, we used CD34 marker expression (Osawa et al, 1996). This revealed a 0.8-fold decrease of the non-self-renewing stem and progenitor cell fraction (LSK CD34+) and a significant (P < 0.05, t-test) 1.6-fold increase of the LSK population enriched for self-renewing HSC (LSK CD34−), in both 8-day-old and 1-year-old Dnmt2 mutant mice (Fig 1H). These findings suggest a role of Dnmt2 in the regulation of self-renewal capacity versus differentiation.
Dnmt2 is required for cell-autonomous differentiation during haematopoiesis
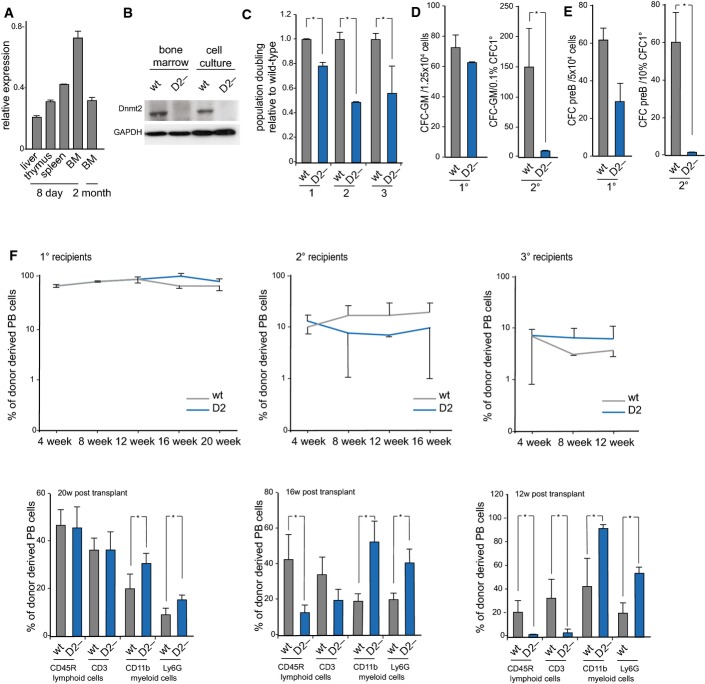
Dnmt2 is expressed in various mouse tissues (Okano et al, 1998; Yoder & Bestor, 1998), but little is known about its expression in the haematopoietic system. qPCR showed robust expression levels of Dnmt2 in the bone marrow during postnatal maturation, and lower levels in spleen, thymus, and adult bone marrow (Fig 2A). Dnmt2-specific antibodies detected the protein in extracts from wild-type bone marrow and primary bone marrow cell culture, while no protein was detected in extracts from Dnmt2−/− mice (Fig 2B). These data confirm the expression of Dnmt2 in cells and tissues that show a Dnmt2-dependent phenotype.
Figure 2. Characterization of the haematopoietic phenotype of Dnmt2−/− mice.
- qPCR analysis of Dnmt2 mRNA expression in haematopoietic tissues, normalized to GAPDH.
- Western blot analysis of Dnmt2 protein expression in haematopoietic tissues.
- Proliferation analysis of primary bone marrow suspension cells. Primary bone marrow suspension cells isolated from the femurs of 8-day-old mice were grown together with the attached stromal cells. Dnmt2−/− population doubling levels of three biological replicates, each plated three times, were calculated relative to wild-type culture.
- Reduced replating abilities of primary Dnmt2−/− bone marrow cells in a myeloid colony formation assay. For primary (1°) colony formation, 1.25 × 10⁴ total bone marrow cells were plated in semisolid medium allowing myeloid differentiation. For secondary (2°) colony formation, cells were harvested and 0.1% of primary colonies were replated into semisolid medium. Results are from two independent experiments analyzing 9 wild-type and 13 Dnmt2−/− mice in total.
- Reduced secondary CFU-preB colony formation of Dnmt2−/− cells. Numbers of CFU-preB-cell colonies are indicated per 5 × 10⁴ wild-type or Dnmt2−/− total bone marrow cells. 10% of primary colonies were replated into secondary CFU-preB assays.
- Stable engraftment (upper panel) and multi-lineage reconstitution (lower panel) of wild-type and Dnmt2−/− bone marrow transplants. CD11b: macrophages; Ly6G: granulocytes; CD45R: B cells; CD3: T cells.
Source data are available online for this figure.
Further analyses with primary bone marrow cultures from 8-day-old Dnmt2−/− mice revealed a significant reduction in their proliferative capacities in vitro (Fig 2C). We also used a granulocyte–monocyte colony-forming unit (CFU-GM) replating assay to investigate myeloid progenitor self-replication. Indeed, the clonogenic capacities of Dnmt2−/− cells were strongly reduced after replating. We detected 14.5 ± 2.5 secondary Dnmt2−/− colonies compared to 149 ± 65.7 wild-type colonies (Fig 2D, right panel). These findings are also in agreement with the reduced replating efficiency of secondary preB-cell colonies (1.5 ± 0.7 secondary preB colonies) of Dnmt2 mutant bone marrow compared to wild-type colonies (60.5 ± 13.4 secondary colonies, Fig 2E, right panel). The in vitro proliferative and clonogenic defects of Dnmt2 mutant primary cells indicate a cell-autonomous defect of the haematopoietic progenitors. However, a cell-extrinsic influence of the mutant bone marrow environment cannot be completely ruled out.
To further assess defect of Dnmt2−/− haematopoietic progenitor cells in vivo, we performed serial bone marrow transplantation experiments. The transplants of mutant and wild-type cells revealed a stable engraftment up to 12 weeks in tertiary recipient mice (Fig F, upper panels). However, a significant disproportional increase in myeloid versus lymphoid peripheral blood cells was observed in the primary and secondary recipients and appeared particularly pronounced in the tertiary recipients (Fig 2F, lower panels). These results confirm cell-autonomous defects within the Dnmt2−/− haematopoietic progenitors. We also asked whether the fate of haematopoietic progenitor cells is influenced by the Dnmt2−/− microenvironment. To this end, we examined the engraftment and differentiation capabilities of wild-type bone marrow cells in Dnmt2 mutant or wild-type recipients. We observed stable and similar engraftment rates of wild-type bone marrow cells in mutant or wild-type hosts up to tertiary recipients (Fig EV1D). In addition, we detected multi-lineage reconstitution in all mice analyzed. Nevertheless, upon the third round of transplantation, a bias toward myeloid differentiation could be observed in Dnmt2 mutants, including a 2.8-fold ± 0.9 reduction in B cells (Fig EV1D lower panels). These observations indicate an additional, minor extrinsic component of the Dnmt2 phenotype.
Dnmt2 is required for the proper differentiation of bone marrow MSCs
To further analyze the haematopoietic defect of Dnmt2−/− mice, purified MSCs (mesenchymal stromal cells) from 8-day-old mice were analyzed by flow cytometry. The results showed similar expression values of MSC markers between the genotypes (Fig 3A). To assess the clonogenic potential of wild-type and Dnmt2−/− MSCs, colony-forming unit fibroblast (CFU-F) assays were performed. CFU-F numbers were 60% higher (P < 0.05, t-test) for Dnmt2−/− cells (Fig 3B), indicating an elevated number of actively dividing MSCs in the bone marrow of Dnmt2−/− mice. Similarly, we observed significantly (P < 0.05, t-test) increased numbers of colonies that stained positive for alkaline phosphatase activity (CFU-F/ALP+, Fig 3C), suggesting an enlarged pool of osteo-progenitors in the bone marrow of Dnmt2−/− mice.
Figure 3. Characterization of Dnmt2−/− MSCs.
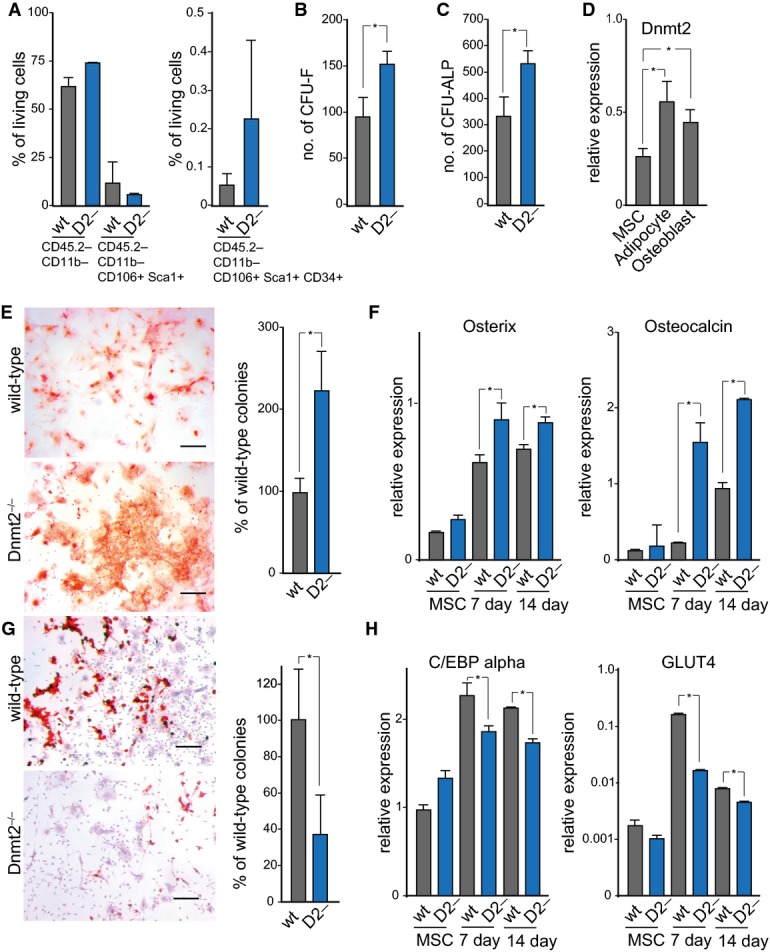
- Flow cytometry analysis of bone marrow primary mesenchymal cells.
- Quantification of fibroblast colony-forming units (CFU-F).
- Quantification of alkaline phosphatase colony-forming units (CFU-ALP).
- Dnmt2 expression after 3 days of mesenchymal cell differentiation.
- Alizarin Red staining, indicating enhanced osteoblast differentiation of primary stromal cells from Dnmt2−/− mice. Scale bar: 50 μm. Quantification was performed with three biological replicates.
- qPCR analysis of the osteoblast markers Osterix and Osteocalcin.
- Oil Red O/hematoxylin staining, showing reduced adipocyte differentiation of primary stromal cells from Dnmt2−/− mice. Scale bar: 50 μm. Quantification was performed with three biological replicates.
- qPCR analysis of the adipocyte markers CEBp alpha and Glut4.
qRT–PCR analysis revealed increased expression levels of Dnmt2 in both adipocytes and osteoblasts as compared to MSCs (Fig 3D), supporting a function of Dnmt2 in MSC differentiation. We therefore used specific and well-defined in vitro differentiation assays to further investigate the phenotype of Dnmt2−/− MSCs. The results showed a noticeable increase in Alizarin Red staining in differentiated Dnmt2-deficient cells, indicating that Dnmt2 normally suppresses osteogenic differentiation (Fig 3E). In agreement with this notion, mRNA expression levels of Osterix, an osteogenic transcription factor, and Osteocalcin, an established marker of mature osteoblasts, were significantly (P < 0.05, t-test) increased in Dnmt2−/− MSCs undergoing osteogenic differentiation (Fig 3F). We also found a pronounced reduction in Oil Red O staining in differentiated Dnmt2−/− cells (Fig 3G), suggesting a stimulatory role of Dnmt2 in adipogenic differentiation. Consistently, mRNA levels of C/EBP alpha, an early differentiation marker of adipocytes, and Glut4, a glucose transporter found primarily in adipose tissues, were significantly (P < 0.05, t-test) reduced in Dnmt2−/− cells during adipogenic differentiation (Fig 3H). These findings suggest that Dnmt2 is required for balancing the differentiation capacity of MSCs.
Dnmt2 methylates C38 of tRNA in the bone marrow and modulates the stability and fragmentation of substrate tRNAs
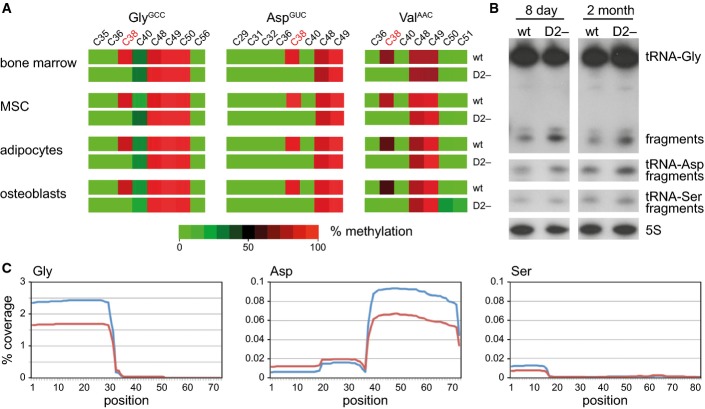
To determine the molecular activity of Dnmt2 in bone marrow, we used tRNA bisulfite sequencing. Robust (> 80%) site-specific and Dnmt2-dependent cytosine-5 methylation was observed at C38 of tRNA GlyGCC, AspGUC, and ValAAC in bone marrow cells as well as in MSCs and their differentiated derivatives (Fig A). Methylation of C48, C49, and C50 in the intersection of the variable loop and the TψC arm is mediated by Nsun2 (Blanco et al, 2011) and was not affected in Dnmt2 mutants (Fig 4A). No Dnmt2-dependent methylation was detected at C38 of tRNA-Leu, tRNA-Glu, tRNA-ValCAC, and tRNA-His (Appendix Fig S1), thus confirming the specific activity of Dnmt2.
Figure 4. Dnmt2 methylates C38 of tRNA in the bone marrow and modulates the stability and fragmentation of substrate tRNAs.
- Bisulfite sequencing maps of 454 reads showing the average methylation status of individual cytosines (boxes) within tRNAs from bone marrow (BM), mesenchymal stromal cells (MSC), and in vitro differentiated adipocytes and osteoblasts. Methylation levels are indicated on a color scale from green (unmethylated) to red (completely methylated).
- Representative Northern blot showing tRNA(Gly) and tRNA(Asp) fragmentation in bone marrow from 8-day-old and adult mice. tRNA(Ser) was included as a Dnmt2 non-substrate tRNA, and 5S rRNA was included as a loading control.
- tRNA fragment coverage for the Dnmt2 substrates tRNA(Gly) and tRNA(Asp), and the non-substrate tRNA(Ser) in bone marrow, as determined by deep sequencing. Wild-type coverage is represented in red, and Dnmt2−/− coverage is indicated in blue. The plots illustrate the specific increase of 5′-halves from tRNA-Gly and 3′-halves from tRNA-Asp fragments in Dnmt2 mutants.
Dnmt2-mediated tRNA methylation protects tRNA from endonucleolytic cleavage in mouse embryonic fibroblast cell lines (Schaefer et al, 2010). Likewise, Northern blot analysis of RNA from Dnmt2−/− bone marrow showed an increase in tRNA GlyGCC and AspGUC fragments (Fig B), which are likely to result from endonucleolytic cleavage of unmethylated tRNAs in the anticodon loop (Schaefer et al, 2010). We further confirmed this finding by using small RNA sequencing of bone marrow RNA from 8-day-old mice. The fraction of reads (12–50 nt) that aligned to genomic tRNA sequences increased from 2.9% in the wild-type to 3.7% in Dnmt2 mutants. We also observed specific changes for several fragments that were derived from Dnmt2 substrate tRNAs, including a pronounced increase of 5′-halves from tRNA-Gly and 3′-halves from tRNA-Asp in Dnmt2−/− bone marrow (Fig 4C, Appendix Fig S2). These findings further elucidate the molecular consequences of Dnmt2 deficiency and show that the absence of Dnmt2 causes specific changes in tRNA fragmentation patterns.
Dnmt2 is required for specific protein synthesis in the bone marrow
The effect of Dnmt2 on tRNA fragmentation suggests a possible function in protein synthesis (Ivanov et al, 2011, 2014). We therefore measured the global rate of protein translation in wild-type and Dnmt2−/− primary bone marrow stromal and haematopoietic cells by quantifying the incorporation of 3H-Gly into newly synthesized proteins. The results showed no significant differences between the genotypes (Fig EV2A), suggesting that the absence of C38 methylation does not affect global protein translation rates. In agreement with this notion, quantification of polysome profiles showed no appreciable reduction of polysomal ribosomes in Dnmt2−/− cells (Fig EV2B and C). These findings are consistent with the highly specific changes observed in tRNA fragmentation patterns and raise the possibility that Dnmt2 might be required for the translation of a specific subset of proteins.
Figure EV2. Analysis of protein synthesis rates.
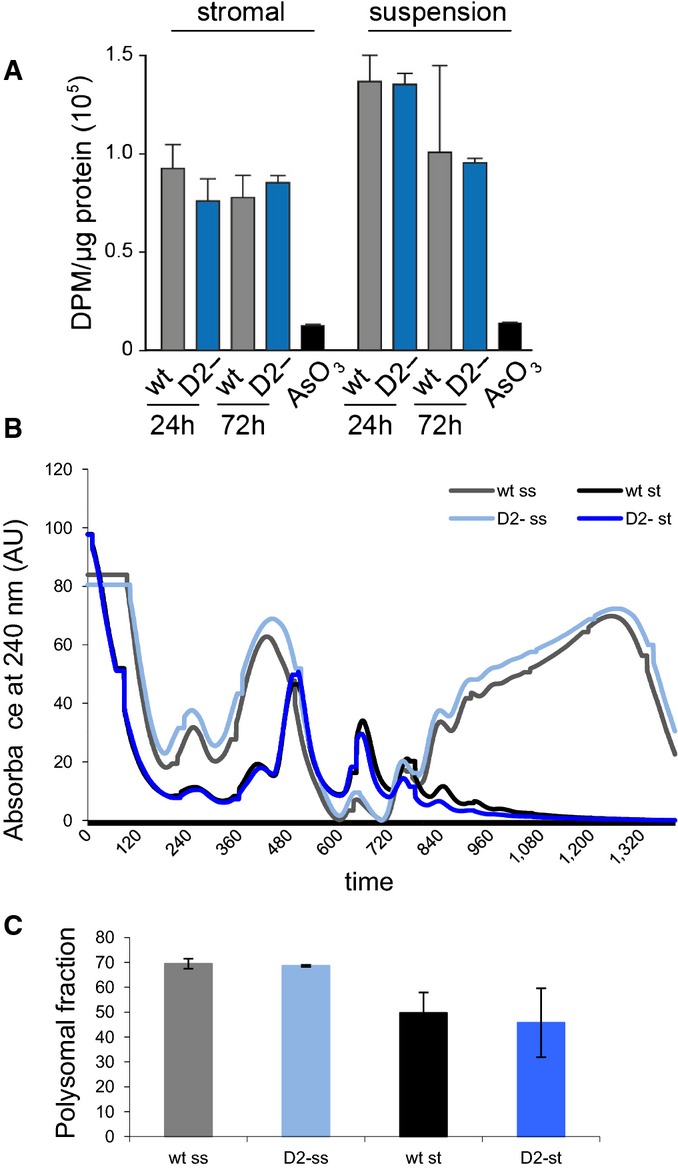
- Analysis of total protein synthesis in primary bone marrow stromal and haematopoietic cells by pulse-labeling with 3H-Gly. As a negative control, protein synthesis was blocked in wild-type cells by treatment with 250 μM sodium arsenite (AsO3). Results were obtained from three independent experiments, and error bars represent standard deviations.
- Representative polysome profiles from Dnmt2–/– and control primary bone marrow culture. Haematopoietic cells growing in suspension (ss) and attached stromal (st) cells were independently harvested and showed a higher proteins synthesis rate.
- As a measure for the global rate of translation, the fraction of polysomal ribosomes was quantified from polysome profiles. Results are shown for two independent biological replicates, and error bars represent standard deviations.
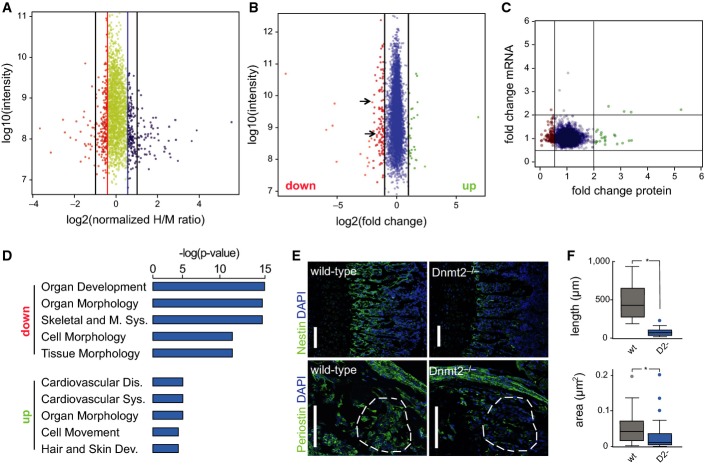
To identify differentially expressed proteins in Dnmt2−/− mice, we used two different proteomic approaches: dynamic stable isotope labeling by amino acids in primary cell culture (dSILAC) (Schwanhausser et al, 2009) and dimethyl-labeling (DML) quantitative proteomic analysis of mouse bone marrow tissue (Boersema et al, 2009). dSILAC is a variation of the SILAC method where labeled amino acids are added to the growth medium for only a short period of time to allow the detection of differences in de novo protein production. Primary haematopoietic bone marrow cells were cultivated together with the co-isolated stromal cells in light medium. At passage 3, wild-type cells were shifted to medium-heavy medium (M: Lys4, Arg6), while Dnmt2−/− cells were shifted to heavy medium (H: Lys8, Arg10), to allow genotype-specific labeling of newly synthesized proteins. The haematopoietic suspension cells and the attached stromal cells were then independently fractionated and analyzed by quantitative shotgun proteomics. Overall, 2,476 proteins were identified by dSILAC (2,351 from the haematopoietic cells and 2,095 from the stromal cells, Dataset EV2) corresponding to approximately 10% of the predicted mouse proteome. All samples showed significant amounts of labeled proteins, indicating that approximately 20% of the total proteins were newly synthesized during this time frame. We identified 223 up-regulated proteins, 62 of which showed a more than twofold increase in the synthesis rate. Likewise, we found 223 down-regulated proteins, 32 of which showed a more than twofold reduction in the synthesis rate (Fig A, Dataset EV1).
Figure 5. Dnmt2 is required for specific protein synthesis in the bone marrow.
- Analysis of protein synthesis by dynamic SILAC. The top 10% of proteins that are translated slower in Dnmt2−/− versus wild-type cells are indicated in orange. The top 10% of proteins that are translated faster in Dnmt2−/− versus wild-type cells are shown in blue. A change of > twofold is indicated by the black lines.
- Dimethyl-labeling analysis of 8-day-old mouse bone marrow tissue. Proteins that were down-regulated (< twofold change) in Dnmt2-deficient cells are indicated in red, and up-regulated proteins (> twofold change) are shown in green. Nestin and periostin are marked with arrows.
- Correlation between protein and mRNA expression for differentially expressed proteins. Proteins that were down-regulated (< twofold change) in Dnmt2-deficient cells are indicated in red, and up-regulated proteins (> twofold change) are shown in green. The Pearson correlation coefficient is −0.03.
- Gene ontology analysis (top 5 categories) of mis-regulated proteins. The top 5 categories are presented.
- Representative staining of nestin and periostin in femur sections from 8-day-old wild-type and Dnmt2−/− mice. The anti-periostin staining is comparable in the periosteum of wild-type and Dnmt2−/− mice, but is reduced in the bone marrow cells (compare the highlighted areas). Scale bar: 100 μm. Nuclei are counterstained with DAPI (blue).
- Quantitative differences in the length of the nestin-positive trabecular zone (upper panel) between wild-type (30 measurements, three mice) and Dnmt2−/− (21 measurements, two mice) and in bone periostin-positive marrow areas (lower panel) between wild-type (26 measurements, three mice) and Dnmt2−/− (45 measurements, three mice) in femur sections from 8-day-old mice. Data are presented as mean ± SD.
Our parallel DML analysis identified 153 significantly deregulated proteins among a total of 4,094 identified proteins. A total of 125 (82%) of the deregulated proteins were down-regulated and 28 (18%) up-regulated (Fig B, Dataset EV2). Among the most intense signals, we identified a group of down-regulated proteins (Fig 5B), which clearly shows that the loss of Dnmt2 affects highly abundant proteins. In agreement with previous results in mouse embryonic fibroblasts and livers (Tuorto et al, 2012), we observed only minor differences in mRNA abundance between wild-type and Dnmt2−/− bone marrow samples and could not significantly correlate (r = −0.03) protein expression changes with mRNA expression changes (Fig 5C). Together, these findings suggest that Dnmt2 can modulate protein levels through a mechanism that is independent of mRNA levels.
Gene ontology analysis of the down-regulated proteins from the DML analysis showed a strong enrichment for genes involved in pathways that are closely related to the observed phenotype, such as organ development and morphology, as well as skeletal and muscular system development and function (Fig 5D). In agreement with their comparably low overall number, we could not observe any robust functional enrichment for proteins that were up-regulated in Dnmt2-deficient bone marrow cells.
Finally, we also used immunohistochemistry to validate the mass spectrometry findings for two selected down-regulated proteins, nestin and periostin. The depletion of nestin-positive cells has been shown to rapidly reduce HSC content in the bone marrow (Mendez-Ferrer et al, 2010), which is in agreement with the reduction of HSC that we observed in Dnmt2−/− bone marrow. Indeed, we observed a robust reduction of nestin in perivascular regions of Dnmt2−/− mice (Fig 5E and F). Likewise, femurs from 8-day-old Dnmt2−/− mice showed a pronounced reduction of periostin staining in the bone marrow cells, while the expression in the periosteum did not appear to be affected (Fig 5E and F). Interestingly, periostin-deficient mice exhibit bone growth plate defects with a reduction of trabeculae within bones (Rios et al, 2005), which appears similar to the phenotype observed in Dnmt2−/− mice. Together, these results strongly suggest that reduced synthesis of selected proteins, including nestin and periostin, contributes to the phenotype of Dnmt2-deficient mice.
A role for Dnmt2 in the regulation of codon fidelity
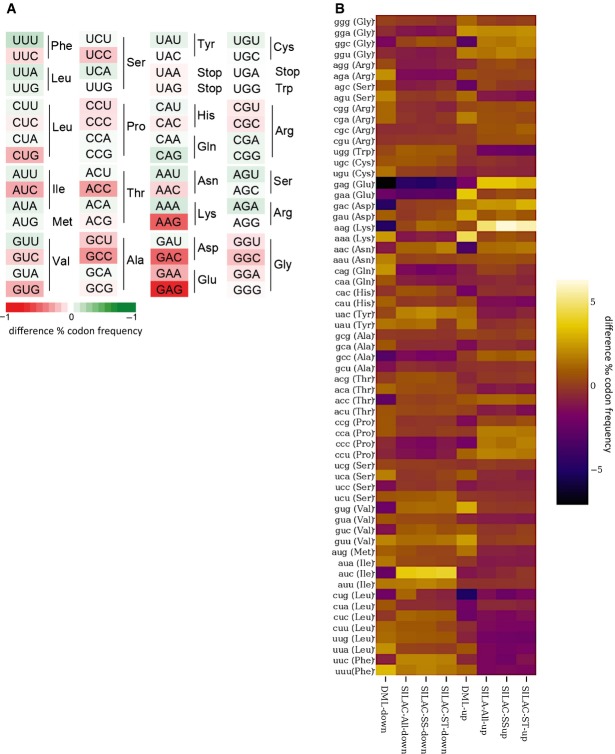
tRNA cytosine methylation has previously been linked to the decoding functions of tRNAs (Agris, 2004). We therefore analyzed the codon biases that were caused by the lack of Dnmt2 in bone marrow by calculating codon-frequency changes in the up- and down-regulated versus total proteins identified by dSILAC and DML. This revealed a codon bias for GAG(Glu) among the down-regulated proteins in both datasets. A codon bias for the second Glu(GAA) codon was also detectable in the dSILAC down-regulated proteins (Figs A and EV3). Moreover, a codon bias against Lys(AAG) was also identified, with an increase of Lys codon frequency in down-regulated and a reduction in up-regulated proteins (Figs A and EV3). Among the Dnmt2 tRNA substrates (Fig A), only Asp(GAC) appeared to be biased, while Gly(GGC) and Val(GUU) frequencies were not significantly different from their expected frequencies (Figs 6A and EV3). However, because Asp(GAC) and Glu(GAG) share the first two bases of the codon, we hypothesized that Dnmt2-mediated methylation at position C38 in the anticodon loop of tRNA-Asp may have a role in the discrimination between Asp and Glu near-cognate codons. We therefore compared the dSILAC dataset from Dnmt2−/− bone marrow with the wild-type to search for possible decoding errors, which were defined as peptides showing amino acid substitutions at non-synonymous near-cognate codons. This identified 59 aberrant peptides derived from non-synonymous near-cognate codon mistranslation (Table EV1). A total of 37 of these 59 errors involved Asp to Glu or Glu to Asp transitions. The remaining 22 errors involved 6 other transitions: Cys to Trp, Ser to Arg, Asn to Lys, His to Gln, Ile to Met, and Phe to Leu. Further data analysis revealed that the frequencies of Asp > Glu and Glu > Asp transitions were significantly (P = 0.003, Fisher's exact test) increased compared to control amino acid substitutions (Fig 6B). These data provide evidence for a novel function of Dnmt2 in maintaining codon fidelity.
Figure 6. A role for Dnmt2 in the regulation of codon fidelity.
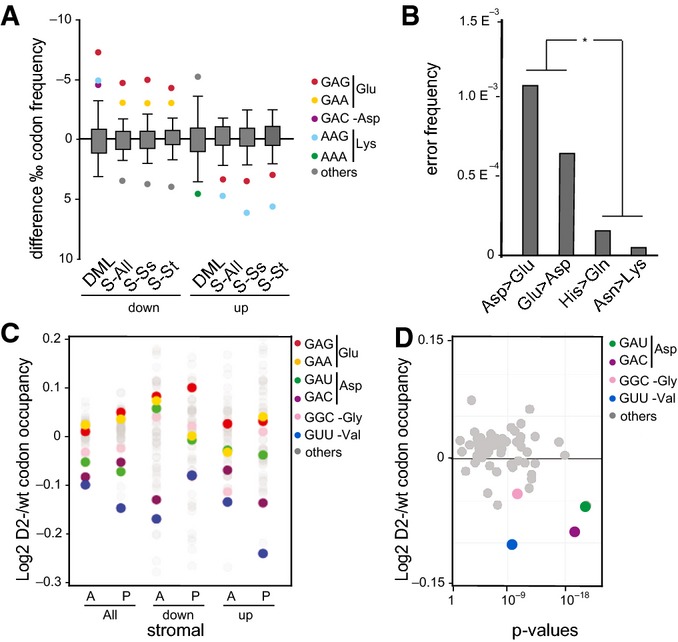
- Boxplots with outlier calling showing the significant codon biases in Dnmt2 down-regulated and up-regulated proteins in the DML and dSILAC datasets. For the dSILAC (S-All) dataset, we display the plot for all identified proteins or stromal (S-St) and suspension (S-Ss) cells. A significant increase or decrease of a codon frequency in up- or down-regulated proteins relative to the average frequency of that codon in all identified proteins is displayed as a colored dot. Codons showing no deviation from average values are grouped together in the box.
- Frequency of amino acid substitutions in the dSILAC dataset. Differences between Asp > Glu and Glu > Asp transitions versus Asn > Lys and His > Gln were found to be highly significant (P < 0.01, Fisher's exact test).
- Changes in bulk codon occupancy in Dnmt2−/− bone marrow primary stromal cells, compared to wild-type cells. Dnmt2 target codons and Glu codons are highlighted with the indicated colors. The two biological replicates of each cell type were pooled. A: ribosomal A-site; P: ribosomal P-site.
- Changes in bulk codon occupancy in Dnmt2−/− bone marrow primary stromal cells compared to wild-type cells in the A-site of ribosome were plotted against the P-values obtained in the Kolmogorov–Smirnov test. Dnmt2 target codons are highlighted with the indicated colors.
Figure EV3. Regulation of codon fidelity.
- Heatmaps showing the significant codon biases in Dnmt2 down-regulated proteins in the DML dataset. An increase of a codon frequency relative to the average frequency of that codon in all identified proteins is displayed in red, whereas a reduction is depicted in green. Codons showing no deviation from average values are displayed in white according to the scale provided in the figure.
- Heatmaps showing codon biases in all protein datasets. Changes of codon frequencies relative to the average frequency of the indicated codon are displayed according to the scale provided in the figure.
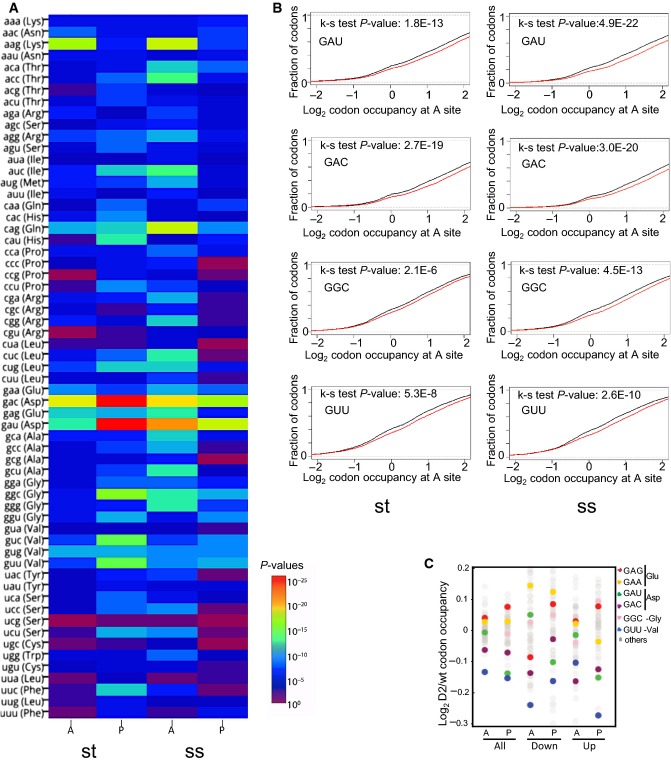
In order to determine the underlying cause for the observed Asp<>Glu amino acid exchange, we examined genome-wide codon occupancy in mutant and wild-type primary bone marrow cells using ribosome profiling. In this method, ribosome-protected mRNA fragments are sequenced to obtain ribosomal position-specific information at single-nucleotide resolution (Ingolia et al, 2011). Two independent biological replicates were analyzed and showed a strong correlation (Fig EV4A and B). The location of the ribosome-protected peak 12 nucleotides upstream of the start codon and the trinucleotide periodicity in our metagene plots (Fig EV4C) were consistent with previous results (Ingolia et al, 2011). Plot distributions for the start and stop codons indicated the correct assignment of ribosomal sites, and Metacodon patterns (Fig EV4D) were reproducible and again consistent with published data (Ingolia et al, 2011; Zinshteyn & Gilbert, 2013). Bulk occupancy for each codon in each ribosomal site was determined for wild-type and Dnmt2−/− cells. Strikingly, mutant cells showed a highly significant (P < 0.01, Kolmogorov–Smirnov test) decrease of ribosome density at specific codons (Figs C and D and EV5), corresponding to all three Dnmt2 substrate codons Asp(GAC)/(GAU), Gly(GGC), and Val(GUU). Notably, codons corresponding to Dnmt2 substrate tRNAs had P-values that were several fold smaller than those for other codons (Figs D and EV5A and B), which further confirmed that the observed effects were related to the absence of Dnmt2 function.
Figure EV4. Reproducibility and quality control of ribosome profiling.
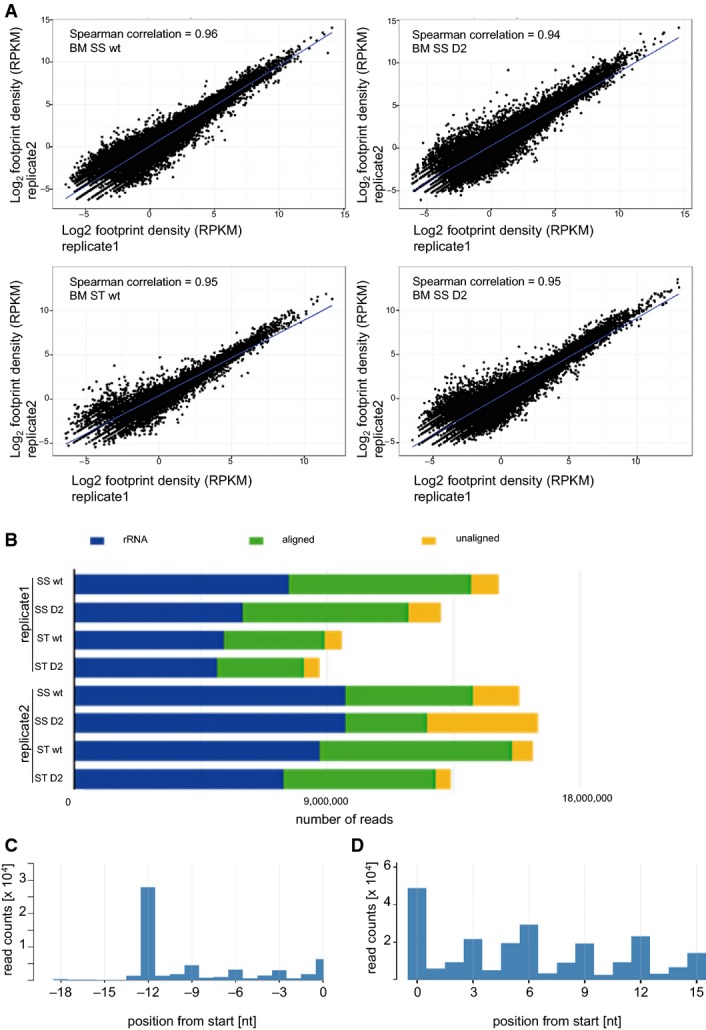
- Correlation between ribosome profiling dataset replicates. Haematopoietic cells growing in suspension (ss) and attached stromal cells (st) were independently harvested.
- Mapping results from the two independent ribosome profiling replicates.
- Representative metaplot of wild-type haematopoietic (ss) cells. 28-mer ribosome footprint reads were summed across all start codons.
- Representative in-frame 28-mer ribosome footprint abundance in wild-type haematopoietic (ss) cells showing the correct periodicity.
Figure EV5. Single-codon occupancy metric shows that differences in ribosome footprint occupancy at Dnmt2 target codons are statistically significant.
- Heatmap of P-values (Kolmogorov–Smirnov test) for all sense codons in wild-type and Dnmt2−/− ribosome A and P sites. The two biological replicates of each cell type were pooled. A: ribosomal A-site; P: ribosomal P-site; st: stromal cells, ss: suspension cells.
- Cumulative distributions of single-codon occupancy for select codons in wild-type and Dnmt2−/− stromal (st) and suspension (ss) cells.
- Changes in bulk codon occupancy in Dnmt2−/− bone marrow suspension cells versus wild-type cells. Dnmt2 target codons and Glu codons are highlighted with the indicated colors. The two biological replicates of each cell type were pooled. A: ribosomal A-site; P: ribosomal P-site.
Taken together, the ribosome profiling data suggest that during translation of Asp(GAC)/(GAU) codons, the lack of C38 methylation reduces the ability of tRNA-Asp to compete with near-cognate tRNAs at the A-site of the ribosome, thereby allowing amino acid misincorporation. As a consequence, we observed a pausing of ribosomes on Asp(GAU) codons when we considered only footprints matching the dSILAC down-regulated proteins (Figs C and EV5C). This would increase the probability for tRNA-Glu to decode Asp codons, thus explaining the Asp>Glu amino acid substitution. The mirror image was observed for the decoding of Glu(GAA/GAG) codons, where non-modified tRNA-Asp competes with the near-cognate tRNA-Glu. Here, we observe a consistent increase in A-site occupancy among the footprints matching the Dnmt2 down-regulated proteins (Figs C and EV5C). We hypothesize that ribosome pausing at GAA/GAG codons in down-regulated proteins reflects the incorrect loading of tRNA-Asp at these codons. This is consistent with the identified GAA/GAG codon biases and with the high Glu<>Asp mistranslation rate. Taken together, the observed alterations of codon occupancy in Dnmt2 mutants suggest a reduced translation fidelity due to the lack of C38 methylation on tRNA-Asp. Hence, we conclude that cytosine-5 tRNA methylation in the anticodon loop enables discrimination of near-cognate codons and thereby contributes to the accuracy of polypeptide synthesis.
Discussion
Even though Dnmt2 is a highly conserved enzyme, its functional significance has remained unresolved. This is largely due to the fact that the various known Dnmt2-deficient models present divergent and rather subtle phenotypes (Schaefer & Lyko, 2010). Our analysis revealed that Dnmt2−/− mice are born with an immature haematopoietic system (Fig 1). We also observed delayed endochondral ossification of the long bones, in agreement with the more pronounced effects seen in newborn Dnmt2−/−; Nsun2−/− double-knockout mice (Tuorto et al, 2012). In both stem cell populations analyzed (LSK and the MSC), we observed a cell-autonomous differentiation defect of Dnmt2-deficient cells (Figs 2 and 3), which is in agreement with the finding that differentiation defects have been described in Dnmt2 mutant zebrafish (Rai et al, 2007).
Various studies have suggested a role of Dnmt2 and the functionally interacting RNA methyltransferase NSun2 in the regulation of protein synthesis (Schaefer et al, 2010; Tuorto et al, 2012; Blanco et al, 2014). Mechanistically, this has been linked to the finding that Dnmt2 and NSun2 protect tRNAs against endonucleolytic cleavage (Schaefer et al, 2010; Blanco et al, 2014). Indeed, Dnmt2−/−; Nsun2−/− double-knockout mice, which lack detectable cytosine-5 tRNA methylation, showed lower steady-state levels for various tRNAs and a reduced rate of global protein translation (Tuorto et al, 2012). However, the effects appeared to be more subtle in Dnmt2−/− and in Nsun2−/− single-knockout mice, where tRNA steady-state levels were largely unaffected (Tuorto et al, 2012) and where increased amounts of tRNA fragments appeared to be responsible for some of the observed phenotypes (Durdevic et al, 2013; Blanco et al, 2014).
Our combined analysis of dSILAC and ribosome footprinting data from phenotypically affected tissues of Dnmt2−/− mice uncovered an additional function of Dnmt2 in the regulation of polypeptide synthesis. Our results suggest that the lack of C38 methylation diminishes the capacity of tRNAs to properly discriminate between Asp and Glu codons, leading to translational infidelity (Fig 7). We observed elevated rates of Glu and Asp amino acid mistranslation, which directly supports the notion that C38 methylation of tRNAs is required for codon fidelity. Misincorporation of amino acids leads to the production of mistranslated or aborted nascent polypeptides, which triggers lysine ubiquitination, proteasome activation, and degradation of mistranslated proteins (Lee et al, 2006; Drummond & Wilke, 2008). Consistent with this notion, we also observed corresponding Lys codon biases with an increase of Lys codons in down-regulated and a reduction in up-regulated proteins.
Figure 7. Model illustrating the role for Dnmt2 in the codon fidelity.
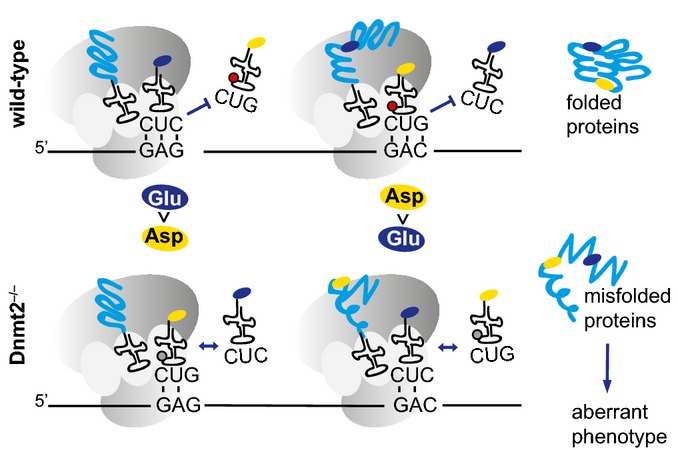
In Dnmt2 wild-type cells, C38 tRNA methylation (red circle) promotes the fidelity of tRNA(Glu) and tRNA(Asp) codons, thus resulting in the translation of correctly folded proteins. In Dnmt2−/− cells, the lack of C38 tRNA methylation (gray circle) reduces the capacity of tRNAs to properly discriminate between Asp and Glu codons, leading to decreased translational fidelity, the production of unfolded proteins, and an aberrant phenotype.
Posttranscriptional modifications in the anticodon loop of tRNAs are essential for the translation process (Motorin & Grosjean, 2001; Grosjean et al, 2010). In particular, position 34 corresponding to the first base of the anticodon loop of tRNAs, the so-called wobble base (Crick, 1966; Agris et al, 2007), is subject to various modifications, depending on the associated tRNA isoacceptor and the organism (Motorin & Grosjean, 2001; Grosjean et al, 2010; El Yacoubi et al, 2012). Some of these modifications have been shown to be important for the fine-tuning of protein translation and for the maintenance of proteome integrity in yeast and in C. elegans (Rezgui et al, 2013; Zinshteyn & Gilbert, 2013; Nedialkova & Leidel, 2015).
Furthermore, the ribosome discriminates between correct and incorrect aminoacyl-tRNAs according to the match between anticodon and mRNA codon in the A-site of the ribosome. However, the difference in thermodynamic stability between cognate and near-cognate tRNAs is too small to explain the accuracy of decoding. Consequently, a two-step process, consisting of initial selection and subsequent proofreading, has been proposed (Rodnina & Wintermeyer, 2001). Of note, Dnmt2−/− primary bone marrow cells showed a decrease of codon occupancy in the ribosome A-site for all Dnmt2 target codons in the ribosome footprint assay. This can be explained by a model where the absence of C38 methylation in the anticodon loop reduces the available time for the discrimination between the near-cognate tRNA-Asp/Glu codons, thereby reducing translational fidelity (Fig 7). The lower accuracy of decoding is also reflected in the elevated ribosome pausing at Glu/Asp codons in the specific set of proteins that is down-regulated in the absence of Dnmt2.
The homeostasis of haematopoietic tissue is maintained by balancing stem cell self-renewal and differentiation (Seita & Weissman, 2010), but the role of tRNA modifications in this process has been unknown. Differential codon usage in proliferating versus differentiating cells has recently been described for a variety of cells (Gingold et al, 2014). In this context, Dnmt2 could play a role in adapting tRNAs to codons during differentiation, thus functioning as a “canalizer” of translation.
Materials and Methods
Histomorphometry
Bone histomorphometric analyses were performed using a semiautomatic image analyzing system (Leica Q600 Qwin; Leica Microsystems, Cambridge, UK). The pictures were taken with the Mirax Viewer imaging system (Carl Zeiss MicroImaging GmbH). Each value of trabecular and hypertrophic zone length is the average of three measurements on the same femoral section per mouse. GLS positively stained capillaries were counted in three independent high-power fields (HPF) per mouse. The lengths of the nestin-positive trabecular zone and periostin-positive bone marrow areas were measured in femur sections from 8-day-old mice using the ImageJ program.
Primary bone marrow harvest, culture, and flow cytometry
Tibiae and femora were harvested from wild-type and Dnmt2−/− mice. Bone marrow was flushed and cells were counted. Mononuclear cells were cultured in fully supplemented IMDM containing 20% FBS (Invitrogen), 5 ng/ml thrombopoietin, 10 ng/ml FLT-3L, and SCF (Biomol) at 37°C, 5% CO2 under humidified conditions. Suspension cells were counted and replated every 4–6 days. Viable cells were counted using a Casy Cell Counter (Roche Diagnostics). For haematopoietic marker expression, bone marrow cells were harvested, washed with HBSS (Sigma) supplemented with 2% FBS (PAN Biotech) and stained with fluorochrome-conjugated monoclonal antibodies against differentiated lineages (Becton Dickinson; 558074), Sca-1 (eBioscience; 56-5981-82), c-Kit (Becton Dickinson; 553355), and CD34 (Becton Dickinson; 560238), and analyzed by fluorescence-activated cell sorting (LSRII; Becton Dickinson). Dnmt2 protein expression (Santa Cruz; 1:500) was analyzed by standard Western blotting using 100 μg of total protein extract.
Bone marrow transplantation
Bone marrow cells were harvested from Dnmt2−/−, wild-type, or Boy/J mice as described previously (Ball et al, 2007). In brief, bone marrow cells from tibias and femurs were harvested and washed in HBSS (Sigma) supplemented with 2% FBS (PAN Biotech, Germany), mixed with 105 competitor cells, and injected via the tail vein into lethally irradiated (950 cGy) female Boy/J or C57Bl6/J mice (106 Dnmt2 mutant or wild-type cells together with 105 carrier cells per mouse, n = 5 per group). Every 4 weeks, cell lineages were stained with fluorochrome-conjugated monoclonal antibodies (Becton Dickinson, CD45.1, 553776; CD45.2 558702; CD45R/B220, 557957; CD3. 560527; Ly6G, 561236; CD11b, 550993) and analyzed by fluorescence-activated cell sorting (LSRII; Becton Dickinson).
Isolation and characterization of MSC
A total of 107 bone marrow mononuclear cells were seeded in 10-cm dishes with DMEM low glucose (Sigma-Aldrich) containing 15% FBS, 10 μM hydrocortisone, 100 μM β-mercaptoethanol, 100 IU/ml pen/strep, and L-glutamine and incubated at 37°C, 5% CO2 under humidified conditions for 14–21 days. Non-adherent cells were removed every other day, and fresh medium was added. The mesenchymal stromal cell characteristics were determined by FACS analysis for the expression CD45.2 (Becton Dickinson; 558702), CD11b (Becton Dickinson, 550993), CD106 (Becton Dickinson; 561613), Sca1 (eBioscience; 56-5981-82), and CD34 (Becton Dickinson; 560238) markers. After 8 days of incubation, colonies of 50 cells or more (CFU-F) were counted by light microscopy in four different plates per genotype, and alkaline phosphatase colony-forming unit (CFU-ALP) assays were carried out using the SIGMA 86R kit. Osteogenic and adipogenic differentiation assays of MSC are described in the Appendix Supplementary Methods.
Total bone marrow RNA isolation and analysis
Tibia and femora were harvested in RNAlater (Qiagen) solution. Bone marrow was dissected and RNA extracted with TRIzol (Invitrogen). Northern blot and gene expression profiling were performed as described previously (Tuorto et al, 2012). Northern probes are listed in Appendix Table S1.
RNA bisulfite sequencing
Bisulfite conversion was performed using the EZ RNA Methylation™ Kit (Zymo Research). Amplicons for 454 (Roche) sequencing were generated and analyzed as described previously (Tuorto et al, 2012).
tRNA fragment sequencing
Libraries were generated from mouse total bone marrow isolated from 2 male and 2 female 8-day-old mice. Two independent biological replicates were analyzed. Total RNA was extracted using TRIzol (Invitrogen) and treated with DNase I (Ambion). RNA was end-repaired with T4 polynucleotide kinase (TaKaRa). Small RNA libraries were generated using the NEB NEXT Small RNA Library Prep Set from Illumina. The library was size-selected (120–170 bp) before sequencing. For sequence analysis, adapters were removed, and the 12- to 50-nt fragments were aligned to the mouse tRNA genomic database (mm10, http://gtrnadb.ucsc.edu). Reads that matched to multiple gene regions were distributed proportionally to the fraction of uniquely matching reads at these regions. The per-base coverage of the tRNAs was computed and divided by the total number of reads and then multiplied by 100, leading to values that are comparable between samples (percentage).
Analysis of protein synthesis
A total of 2.5 × 10⁵ primary bone marrow haematopoietic cells were plated in triplicate in 12-well plates and were cultivated together with the attached stromal cells. At passage p3, cells were metabolically labeled by incubation at 37°C with 10 μCi/ml of 3HGly (Perkin-Elmer) in 400 μl of MEM Gly-free medium (Sigma), supplemented with 10% of dialyzed fetal bovine serum and a cocktail of antibiotics and cytokines. Measurements were performed as previously described (Tuorto et al, 2012).
Polysome analysis and ribosome profiling
A total of 2 × 10⁷ primary haematopoietic cells from each genotype at passage p2 were used for both polysome analysis and footprinting. Haematopoietic cells growing in suspension were harvested independently from the attached stromal cells. Polysome analysis was performed as described previously (Tuorto et al, 2012), with two independent biological replicates. Ribosome profiling was performed according to Ingolia et al (2011); see Appendix Supplementary Methods for details.
Dynamic SILAC
Samples were cultivated in light medium. At the beginning of the labeling experiment, the cells were shifted to medium-heavy (Lys4—L-lysine-D4; Arg6—L-arginine-13C6) or heavy medium (Lys8—L-lysine-13C6,15N2; Arg10—L-arginine-13C6,15N4) for wild-type or mutant cells, respectively. The top 10% differentially expressed proteins were considered as significantly regulated (10% strongest differences between H/M labeling). Haematopoietic cells growing in suspension were harvested independently from the attached stromal cells.
Dimethyl-labeling (DML) analysis
A total of 5 × 10⁷ cells from flushed femora bone marrow of two male and two female 8-day-old mice were resuspended in urea buffer, sonified with seven pulses, and precipitated with MeOH/CHCl3. A total of 100 μg of male and female protein extract was pooled and subjected to an in-solution digest (de Godoy et al, 2008); see Appendix Supplementary Methods for details. The purified peptides were N-terminally labeled and, on the lysine side chain, dimethyl-labeled using light or isotopically marked formaldehyde (Boersema et al, 2009). Both procedures were performed in an automated setup using a PAL system. Peptides were then eluted from the C18 stage-tips and lyophilized in a speed-vac. After reconstitution with 100 μl 100 mM tri-ethyl ammonium bicarbonate (TEAB), dimethyl-labeling was performed in solution (Boersema et al, 2009) using heavy formaldehyde at a final concentration of 0.15% (v/v) in the presence of 0.8% (w/v) sodium cyanoborohydride. The reaction was carried out overnight and quenched by adding 16 μl ABC buffer and acidified by adding 8 μl 50% TFA. The labeled samples were mixed in a 1:1 ratio and purified using a C18 stage-tip. After DML, the samples were pooled. One-third of the sample was desalted and measured as “unfractionated” sample. The remaining two-thirds of the sample was fractionated using strong-anion exchange (SAX) material (3M) on stage-tips producing seven fractions (elution at pH 11, pH 8, pH 6, pH 5, pH 4, and pH 3) including the flow-through. Mass spectrometry details are provided in the Appendix Supplementary Methods.
Codon usage analysis
Codon numbers for all mRNA transcripts were calculated, using the Mm38.1 CCDS archive from NCBI. The numbers are represented as frequency of the complete coding sequence. R software was used to analyze the data. Differences in the frequency of single codons in all identified proteins in the dataset with respect to the up- and down-regulated proteins were used to identify codon biases. Statistically significant codon biases were identified as outliers using the “Parody” Bioconductor package for finding “parametric and resistant outlier detection.”
Statistical analysis
If not otherwise stated, the significance of quantitative data was tested using unpaired, two-tailed Student's t-tests.
Data access
Gene expression, tRNA fragment sequencing, and ribosome profiling sequencing data are available in the NCBI GEO database: http://www.ncbi.nlm.nih.gov/geo/query/acc.cgi?acc=GSE65758
Proteomic data are available at: https://www.proteomicsdb.org/#projects/4218?accessCode=b76cde20c76128282b5f4806dad0a92461182315a5285b074ee356df210d52ad
Acknowledgments
We thank Matthias Schaefer for valuable advice and helpful comments on the manuscript. We also thank Oliver Heil for help with mRNA expression profiling and Tanja Musch, Claudia Schmidt, Annika Mengering, and Nina Hofmann for technical assistance. This work was supported by grants from the Deutsche Forschungsgemeinschaft (FOR1082, SPP1463), the CellNetworks Cluster of Excellence (EcTop5) and Epigenetics@dkfz. F.T. is supported by the Institute of Genetics and Biophysics A. Buzzati-Traverso, C.N.R., Italy.
Author contributions
FT and FL conceived the study. FT, FH, GF, and HJG performed the mouse analysis. FT and RL performed the RNA bisulfite sequencing. OP and GD performed the mass spectrometry analysis. FT, FH, OP, GS, GD, HG NA, SR, GS, and FL designed the experiments and interpreted the results. NA and SB performed bioinformatical analyses. FT and FL wrote the manuscript with the contribution of the other coauthors.
Conflict of interest
The authors declare that they have no conflict of interest.
Supporting Information
Appendix
Expanded View Figures PDF
Table EV1
Dataset EV1
Dataset EV2
Review Process File
Source Data for Figure 2
Source Data for Figure 4
References
- Agris PF. Decoding the genome: a modified view. Nucleic Acids Res. 2004;32:223–238. doi: 10.1093/nar/gkh185. [DOI] [PMC free article] [PubMed] [Google Scholar]
- Agris PF, Vendeix FA, Graham WD. tRNA's wobble decoding of the genome: 40 years of modification. J Mol Biol. 2007;366:1–13. doi: 10.1016/j.jmb.2006.11.046. [DOI] [PubMed] [Google Scholar]
- Ball CR, Pilz IH, Schmidt M, Fessler S, Williams DA, von Kalle C, Glimm H. Stable differentiation and clonality of murine long-term hematopoiesis after extended reduced-intensity selection for MGMT P140K transgene expression. Blood. 2007;110:1779–1787. doi: 10.1182/blood-2006-11-053710. [DOI] [PMC free article] [PubMed] [Google Scholar]
- Becker M, Muller S, Nellen W, Jurkowski TP, Jeltsch A, Ehrenhofer-Murray AE. Pmt1, a Dnmt2 homolog in Schizosaccharomyces pombe, mediates tRNA methylation in response to nutrient signaling. Nucleic Acids Res. 2012;40:11648–11658. doi: 10.1093/nar/gks956. [DOI] [PMC free article] [PubMed] [Google Scholar]
- Begley U, Dyavaiah M, Patil A, Rooney JP, DiRenzo D, Young CM, Conklin DS, Zitomer RS, Begley TJ. Trm9-catalyzed tRNA modifications link translation to the DNA damage response. Mol Cell. 2007;28:860–870. doi: 10.1016/j.molcel.2007.09.021. [DOI] [PMC free article] [PubMed] [Google Scholar]
- Blanco S, Kurowski A, Nichols J, Watt FM, Benitah SA, Frye M. The RNA-methyltransferase Misu (NSun2) poises epidermal stem cells to differentiate. PLoS Genet. 2011;7:e1002403. doi: 10.1371/journal.pgen.1002403. [DOI] [PMC free article] [PubMed] [Google Scholar]
- Blanco S, Dietmann S, Flores JV, Hussain S, Kutter C, Humphreys P, Lukk M, Lombard P, Treps L, Popis M, Kellner S, Holter SM, Garrett L, Wurst W, Becker L, Klopstock T, Fuchs H, Gailus-Durner V, Hrabe de Angelis M, Karadottir RT, et al. Aberrant methylation of tRNAs links cellular stress to neuro-developmental disorders. EMBO J. 2014;33:2020–2039. doi: 10.15252/embj.201489282. [DOI] [PMC free article] [PubMed] [Google Scholar]
- Boersema PJ, Raijmakers R, Lemeer S, Mohammed S, Heck AJ. Multiplex peptide stable isotope dimethyl labeling for quantitative proteomics. Nat Protoc. 2009;4:484–494. doi: 10.1038/nprot.2009.21. [DOI] [PubMed] [Google Scholar]
- Crick FH. Codon–anticodon pairing: the wobble hypothesis. J Mol Biol. 1966;19:548–555. doi: 10.1016/s0022-2836(66)80022-0. [DOI] [PubMed] [Google Scholar]
- Drummond DA, Wilke CO. Mistranslation-induced protein misfolding as a dominant constraint on coding-sequence evolution. Cell. 2008;134:341–352. doi: 10.1016/j.cell.2008.05.042. [DOI] [PMC free article] [PubMed] [Google Scholar]
- Durdevic Z, Mobin MB, Hanna K, Lyko F, Schaefer M. The RNA methyltransferase Dnmt2 is required for efficient Dicer-2-dependent siRNA pathway activity in Drosophila. Cell Rep. 2013;4:931–937. doi: 10.1016/j.celrep.2013.07.046. [DOI] [PubMed] [Google Scholar]
- El Yacoubi B, Bailly M, de Crecy-Lagard V. Biosynthesis and function of posttranscriptional modifications of transfer RNAs. Annu Rev Genet. 2012;46:69–95. doi: 10.1146/annurev-genet-110711-155641. [DOI] [PubMed] [Google Scholar]
- Gingold H, Tehler D, Christoffersen NR, Nielsen MM, Asmar F, Kooistra SM, Christophersen NS, Christensen LL, Borre M, Sorensen KD, Andersen LD, Andersen CL, Hulleman E, Wurdinger T, Ralfkiaer E, Helin K, Gronbaek K, Orntoft T, Waszak SM, Dahan O, et al. A dual program for translation regulation in cellular proliferation and differentiation. Cell. 2014;158:1281–1292. doi: 10.1016/j.cell.2014.08.011. [DOI] [PubMed] [Google Scholar]
- de Godoy LM, Olsen JV, Cox J, Nielsen ML, Hubner NC, Frohlich F, Walther TC, Mann M. Comprehensive mass-spectrometry-based proteome quantification of haploid versus diploid yeast. Nature. 2008;455:1251–1254. doi: 10.1038/nature07341. [DOI] [PubMed] [Google Scholar]
- Goll MG, Kirpekar F, Maggert KA, Yoder JA, Hsieh CL, Zhang X, Golic KG, Jacobsen SE, Bestor TH. Methylation of tRNAAsp by the DNA methyltransferase homolog Dnmt2. Science. 2006;311:395–398. doi: 10.1126/science.1120976. [DOI] [PubMed] [Google Scholar]
- Grosjean H, de Crecy-Lagard V, Marck C. Deciphering synonymous codons in the three domains of life: co-evolution with specific tRNA modification enzymes. FEBS Lett. 2010;584:252–264. doi: 10.1016/j.febslet.2009.11.052. [DOI] [PubMed] [Google Scholar]
- Guy MP, Young DL, Payea MJ, Zhang X, Kon Y, Dean KM, Grayhack EJ, Mathews DH, Fields S, Phizicky EM. Identification of the determinants of tRNA function and susceptibility to rapid tRNA decay by high-throughput in vivo analysis. Genes Dev. 2014;28:1721–1732. doi: 10.1101/gad.245936.114. [DOI] [PMC free article] [PubMed] [Google Scholar]
- Hori H. Methylated nucleosides in tRNA and tRNA methyltransferases. Front Genet. 2014;5:144. doi: 10.3389/fgene.2014.00144. [DOI] [PMC free article] [PubMed] [Google Scholar]
- Hussain S, Tuorto F, Menon S, Blanco S, Cox C, Flores JV, Watt S, Kudo NR, Lyko F, Frye M. The mouse cytosine-5 RNA methyltransferase NSun2 is a component of the chromatoid body and required for testis differentiation. Mol Cell Biol. 2013;33:1561–1570. doi: 10.1128/MCB.01523-12. [DOI] [PMC free article] [PubMed] [Google Scholar]
- Ikuta K, Weissman IL. Evidence that hematopoietic stem cells express mouse c-kit but do not depend on steel factor for their generation. Proc Natl Acad Sci USA. 1992;89:1502–1506. doi: 10.1073/pnas.89.4.1502. [DOI] [PMC free article] [PubMed] [Google Scholar]
- Ingolia NT, Lareau LF, Weissman JS. Ribosome profiling of mouse embryonic stem cells reveals the complexity and dynamics of mammalian proteomes. Cell. 2011;147:789–802. doi: 10.1016/j.cell.2011.10.002. [DOI] [PMC free article] [PubMed] [Google Scholar]
- Ivanov P, Emara MM, Villen J, Gygi SP, Anderson P. Angiogenin-induced tRNA fragments inhibit translation initiation. Mol Cell. 2011;43:613–623. doi: 10.1016/j.molcel.2011.06.022. [DOI] [PMC free article] [PubMed] [Google Scholar]
- Ivanov P, O'Day E, Emara MM, Wagner G, Lieberman J, Anderson P. G-quadruplex structures contribute to the neuroprotective effects of angiogenin-induced tRNA fragments. Proc Natl Acad Sci USA. 2014;111:18201–18206. doi: 10.1073/pnas.1407361111. [DOI] [PMC free article] [PubMed] [Google Scholar]
- Kiani J, Grandjean V, Liebers R, Tuorto F, Ghanbarian H, Lyko F, Cuzin F, Rassoulzadegan M. RNA-mediated epigenetic heredity requires the cytosine methyltransferase Dnmt2. PLoS Genet. 2013;9:e1003498. doi: 10.1371/journal.pgen.1003498. [DOI] [PMC free article] [PubMed] [Google Scholar]
- Lee JW, Beebe K, Nangle LA, Jang J, Longo-Guess CM, Cook SA, Davisson MT, Sundberg JP, Schimmel P, Ackerman SL. Editing-defective tRNA synthetase causes protein misfolding and neurodegeneration. Nature. 2006;443:50–55. doi: 10.1038/nature05096. [DOI] [PubMed] [Google Scholar]
- Mendez-Ferrer S, Michurina TV, Ferraro F, Mazloom AR, Macarthur BD, Lira SA, Scadden DT, Ma'ayan A, Enikolopov GN, Frenette PS. Mesenchymal and haematopoietic stem cells form a unique bone marrow niche. Nature. 2010;466:829–834. doi: 10.1038/nature09262. [DOI] [PMC free article] [PubMed] [Google Scholar]
- Motorin Y, Grosjean H. Nature Encyclopedia of Life Sciences. Chichester, UK: John Wiley & Sons, Ltd; 2001. Transfer RNA modification. In. [Google Scholar]
- Motorin Y, Lyko F, Helm M. 5-methylcytosine in RNA: detection, enzymatic formation and biological functions. Nucleic Acids Res. 2010;38:1415–1430. doi: 10.1093/nar/gkp1117. [DOI] [PMC free article] [PubMed] [Google Scholar]
- Nedialkova DD, Leidel SA. Optimization of codon translation rates via tRNA modifications maintains proteome integrity. Cell. 2015;161:1606–1618. doi: 10.1016/j.cell.2015.05.022. [DOI] [PMC free article] [PubMed] [Google Scholar]
- Okano M, Xie S, Li E. Dnmt2 is not required for de novo and maintenance methylation of viral DNA in embryonic stem cells. Nucleic Acids Res. 1998;26:2536–2540. doi: 10.1093/nar/26.11.2536. [DOI] [PMC free article] [PubMed] [Google Scholar]
- Osawa M, Hanada K, Hamada H, Nakauchi H. Long-term lymphohematopoietic reconstitution by a single CD34-low/negative hematopoietic stem cell. Science. 1996;273:242–245. doi: 10.1126/science.273.5272.242. [DOI] [PubMed] [Google Scholar]
- Raddatz G, Guzzardo PM, Olova N, Fantappié MR, Rampp M, Schaefer M, Reik W, Hannon GJ, Lyko F. Dnmt2-dependent methylomes lack defined DNA methylation patterns. Proc Natl Acad Sci USA. 2013;110:8627–8631. doi: 10.1073/pnas.1306723110. [DOI] [PMC free article] [PubMed] [Google Scholar]
- Rai K, Chidester S, Zavala CV, Manos EJ, James SR, Karpf AR, Jones DA, Cairns BR. Dnmt2 functions in the cytoplasm to promote liver, brain, and retina development in zebrafish. Genes Dev. 2007;21:261–266. doi: 10.1101/gad.1472907. [DOI] [PMC free article] [PubMed] [Google Scholar]
- Rezgui VA, Tyagi K, Ranjan N, Konevega AL, Mittelstaet J, Rodnina MV, Peter M, Pedrioli PG. tRNA tKUUU, tQUUG, and tEUUC wobble position modifications fine-tune protein translation by promoting ribosome A-site binding. Proc Natl Acad Sci USA. 2013;110:12289–12294. doi: 10.1073/pnas.1300781110. [DOI] [PMC free article] [PubMed] [Google Scholar]
- Rios H, Koushik SV, Wang H, Wang J, Zhou HM, Lindsley A, Rogers R, Chen Z, Maeda M, Kruzynska-Frejtag A, Feng JQ, Conway SJ. Periostin null mice exhibit dwarfism, incisor enamel defects, and an early-onset periodontal disease-like phenotype. Mol Cell Biol. 2005;25:11131–11144. doi: 10.1128/MCB.25.24.11131-11144.2005. [DOI] [PMC free article] [PubMed] [Google Scholar]
- Rodnina MV, Wintermeyer W. Fidelity of aminoacyl-tRNA selection on the ribosome: kinetic and structural mechanisms. Annu Rev Biochem. 2001;70:415–435. doi: 10.1146/annurev.biochem.70.1.415. [DOI] [PubMed] [Google Scholar]
- Schaefer M, Lyko F. Solving the Dnmt2 enigma. Chromosoma. 2010;119:35–40. doi: 10.1007/s00412-009-0240-6. [DOI] [PubMed] [Google Scholar]
- Schaefer M, Pollex T, Hanna K, Tuorto F, Meusburger M, Helm M, Lyko F. RNA methylation by Dnmt2 protects transfer RNAs against stress-induced cleavage. Genes Dev. 2010;24:1590–1595. doi: 10.1101/gad.586710. [DOI] [PMC free article] [PubMed] [Google Scholar]
- Schwanhausser B, Gossen M, Dittmar G, Selbach M. Global analysis of cellular protein translation by pulsed SILAC. Proteomics. 2009;9:205–209. doi: 10.1002/pmic.200800275. [DOI] [PubMed] [Google Scholar]
- Seita J, Weissman IL. Hematopoietic stem cell: self-renewal versus differentiation. Wiley Interdiscip Rev Syst Biol Med. 2010;2:640–653. doi: 10.1002/wsbm.86. [DOI] [PMC free article] [PubMed] [Google Scholar]
- Tuorto F, Liebers R, Musch T, Schaefer M, Hofmann S, Kellner S, Frye M, Helm M, Stoecklin G, Lyko F. RNA cytosine methylation by Dnmt2 and NSun2 promotes tRNA stability and protein synthesis. Nat Struct Mol Biol. 2012;19:900–905. doi: 10.1038/nsmb.2357. [DOI] [PubMed] [Google Scholar]
- Wilkinson C, Bartlett R, Nurse P, Bird A. The fission yeast gene pmt1+ encodes a DNA methyltransferase homologue. Nucleic Acids Res. 1995;23:203–210. doi: 10.1093/nar/23.2.203. [DOI] [PMC free article] [PubMed] [Google Scholar]
- Yoder JA, Bestor TH. A candidate mammalian DNA methyltransferase related to pmt1p of fission yeast. Hum Mol Genet. 1998;7:279–284. doi: 10.1093/hmg/7.2.279. [DOI] [PubMed] [Google Scholar]
- Zinshteyn B, Gilbert WV. Loss of a conserved tRNA anticodon modification perturbs cellular signaling. PLoS Genet. 2013;9:e1003675. doi: 10.1371/journal.pgen.1003675. [DOI] [PMC free article] [PubMed] [Google Scholar]
Associated Data
This section collects any data citations, data availability statements, or supplementary materials included in this article.
Supplementary Materials
Appendix
Expanded View Figures PDF
Table EV1
Dataset EV1
Dataset EV2
Review Process File
Source Data for Figure 2
Source Data for Figure 4


