

Abstract
Amyloid deposits of light-chain proteins are associated with the most common form of systemic amyloidosis. We have studied the effects of single point mutations on amyloid formation of these proteins using explicit solvent model molecular dynamics simulations. For this purpose, we compare the stability of the wild-type immunoglobulin light-chain protein REI in its native and amyloid forms with that of four mutants: R61N, G68D, D82I, and A84T. We argue that the experimentally observed differences in the propensity for amyloid formation result from two effects. First, the mutant dimers have a lower stability than the wild-type dimer due to increase exposure of certain hydrophobic residues. The second effect is a shift in equilibrium between monomers with amyloid-like structure and such with native structures. Hence, when developing drugs against light-chain associated systemic amyloidosis, one should look for components that either stabilize the dimer by binding to the dimer interface or reduce for the monomers the probability of the amyloid form.
Keywords: systemic amyloidosis, light-chain proteins, aggregation, molecular dynamics
Introduction
Amyloidosis is a disorder caused by the accumulation of amyloid fibrils in tissues.1,2 The mechanism of fibril formation and the cause of toxicity of these fibrils, or their oligomeric intermediates, is not yet understood.3,4 Most of the research over the last decades has focused on neurodegenerative diseases such as Alzheimer's, Huntington's, or Parkinson's disease.5–7 These illnesses are examples of localized amyloidosis where the deposits are concentrated at the site of synthesis of the precursor protein.8,9 In neurological diseases, this site is the brain, and hence, the fibril samples can only be collected in a post mortem.10 This is different in cases of systemic amyloidosis where multiple organs are affected, and the fibril samples can be collected from living patients.11,12 Hence, while less common than neurological diseases such as Alzheimer's, there may be advantages in using systemic amyloidosis for studying the mechanism of fibril and oligomer formation.
While only 8.9 cases per million persons are reported in a given year, light-chain amyloidosis is still the most frequent form of systemic amyloidosis.13 It is related to the overproduction of free monoclonal light-chains (κ and λ proteins) plasma cells in the bone marrow, and therefore strikes mostly in patients with blood cancer.14 Light-chain proteins tend to form dimers where each chain consists of a constant C-terminal domain (CL) and a variable N-terminal domain (VL).2 In the majority of patients, the amyloid deposits are made of the VL domain.15 Unfolding and aggregation of this domain can be caused by change in pH, temperature, protein concentration, or certain mutations.16–18 In this process, the dimer dissociates and partially unfolded monomers, rich in β-sheets, assemble as oligomers that grow into fibrils or amorphous aggregates.19 Several in vitro and in vivo studies have identified critical residues whose mutation will interfere with folding and dimerization of the light-chain protein, but the mechanism that leads to the formation of amyloid-like fibrils or amorphous aggregates is not well understood.19–21
Nowak et al. got some insight into this mechanism by comparing in molecular dynamics simulations the stability of wild-type and single point mutants R61N and D82I of the Bence-Jones immunoglobulin κ I light-chain protein REI (PDB ID: 1REI).22 They find that the lower stability of the mutants leads to partially folded, aggregation-prone, intermediates. However, their study is limited by the small number of mutants and the very short simulation time: wild type and mutants were sampled for only 5 ns. As a consequence, their analysis does not explain why the mutant R61N forms an amyloid fibril while the D82I mutation leads only to an amorphous aggregate.
The purpose of this article is to go beyond the limitations of Nowak et al.'s investigation, increasing considerably the simulation times, and extending them by additional mutants, G68D and A84T, that were found in experiments to have increased amyloidogenecity.20,23 By studying the wild type and the four mutants R61N, D82I, G68D, and A84T, we want to identify the various interactions that stabilize the dimers, and that for the monomers lead to a preference of the native state over the amyloid form. Unlike the previous work by Nowak et al. and others,22,24,25 which relied on simulations at elevated temperatures, acidic pH, and high salt concentration, our simulations are done at room temperature and neutral pH. Modeling in this way a more realistic environment, we can go beyond previous work and explore why certain single point mutations destabilize regions of the REI light-chain protein in its dimer form and/or lead to structural differences between various mutants and wild type in the native and amyloid forms. For instance, our simulations allow us to suggest an explanation for why the mutant R61N forms fibril while D82I forms amorphous aggregates.
Results
Mass scaling of solvent and side chains
Preliminary simulations of a REI wild-type monomer at various λ values have been used to determine the effect of mass reduction of the solvent and side chains on the overall dynamics of the system. For this purpose, we have run over 40 ns of explicit solvent model molecular dynamics simulations starting from the PDB structure as initial configuration. The average root-mean-square deviation (RMSD), radius of gyration Rg, and solvent-accessible surface area (SASA) values of two independent trajectories are tabulated in Supporting Information Table S1. The calculated values for λ = 0.4, 0.5, 0.6, and 0.8 are compared with that of the reference system (λ =1). While the averaged RMSD, radius of gyration, and solvent-accessible surface area values are similar for all mass-reduced systems, and are within the error bars of the reference system, there is a systematic increase in SASA and RMSD values with decreasing λ. Comparing these differences as function of the scaling parameter, we selected λ = 0.5 s for our simulations as this value allows us to be consistent with our previous work.26
Stability of REI wild-type and mutant dimers
In solution, the Bence-Jones immunoglobulin κ I light-chain protein REI forms a dimer that at room temperature and neutral pH is in equilibrium with the monomers which in turn can form amyloids by an unknown process. In principle, one can think of two possibilities by that mutations lead to increased fibril formation. First, mutations can reduce the stability of the dimers, raising in this way the frequency of monomers and as a consequence the probability to form amyloids. The second possibility is that the mutations shift for the monomers the equilibrium between native and amyloid state, raising again the probability for fibril formation.
We start by investigating the first of these two potential mechanisms through probing the stability of the dimers formed by wild type and mutants. For each system, our data rely on three independent trajectories of 100 ns. An initial visual analysis of trajectories indicated that in all cases, the systems appear to be thermalized after 50 ns (data not shown). For this reason, we rely for our analysis on the last 50 ns of our trajectories. The average RMSD and average radius of gyration are calculated for all dimer systems. The quantity ΔRg is calculated by subtracting the average radius of gyration from the corresponding value of the start configuration, and ΔΔRg, is the difference between the ΔRg of a mutant to that of the wild-type dimer. The so-obtained values are listed in Table I. Note that the change in the listed quantity is rather small. While our simulations are much longer than the ones in previous work by Nowak et al.,22 we cannot exclude the possibility that the smallness of these changes indicates that our simulations got trapped in a local minimum. However, as our data rely on three independent trajectories and our results are consistent with experimental data (see below), we believe that despite our still short trajectories a thermodynamically relevant ensemble of structures has been sampled.
Table I.
Average Root-Mean-Square-Deviations (RMSD), Radius of Gyration ΔRg, and ΔΔRg for All Dimers as Calculated Using Last 50 ns of the Trajectories
| System | RMSD (Å) | ΔRg (Å) | ΔΔRg (Å) |
|---|---|---|---|
| WT | 1.16 (0.12) | 0.10 (0.08) | |
| R61N | 1.22 (0.14) | 0.07 (0.09) | −0.03 |
| G68D | 1.24 (0.13) | 0.16 (0.08) | 0.06 |
| D82I | 0.97 (0.09) | 0.12 (0.08) | 0.02 |
| A84T | 0.99 (0.11) | 0.17 (0.08) | 0.07 |
Standard deviations are calculated over three independent runs and shown in parentheses.
ΔRg = average radius of gyration − Rg of initial configuration, and ΔΔRg = (ΔRg)mutant − (ΔRg)WT.
Differences in solvent exposure
While the average RMSD values are similar in all five systems, the radius of gyration increases more for the mutants than for the wild-type dimer. This larger increase in volume may indicate higher exposure to the solvent and therefore could be a signal for the lower stability of the mutant dimers. This can be seen from the average hydrophobic, hydrophilic, and total solvent-accessible surface area values listed in Table II. In all mutants, the total solvent-accessible surface area values are higher than that of the wild type, with most of the contribution coming from the hydrophilic residues. However, the differences are small, and with the exception of the G68D mutant within the standard deviations of the measurements. Still, these solvent-accessible surface area values suggest that the mutant dimers are less stable than the wild-type dimer as they indicate a weakening of the dimer interface. For instance, in the wild type, the loop (39–44) and strand F of one subunit and loop (91–100) of the other subunit are in contact at the dimer interface [Fig. 1(B)]. In the majority of the mutants, the decrease in the solvent exposure of the loop (39–44, subunit 1/2) makes the loop (91–100, subunit 2/1) more exposed to the solvent (data not shown). Due to the mutations R61N, G68D, D82I, and A84T, the contacts between various residues of the loop (39–44) or strand F of one subunit and the loop (91–100) of another subunit are lost. Similarly, number of the main-chain-side-chain contacts between the residues Ala43–Phe98, Pro44–Phe98, and Leu46–Pro95, and side-chain–side-chain contacts between Ala43–Leu94, Ala43–Phe98, Pro44–Phe98, and Leu46–Pro95, and Tyr49–Leu94 (where the first residue is from subunit 1/2 and second one is from subunit 2/1) are smaller than for the wild-type dimer.
Table II.
Average Hydrophobic, Hydrophilic, and Total Solvent-Accessible Surface Area of Wild Type (WT) and Mutants of the Various Dimers in (Å2) as Calculated Using Last 50 ns of the Trajectories
| System | SASAHPHOB | ΔSASAHPHOB | SASAHPHIL | ΔSASAHPHIL | SASA | ΔSASA |
|---|---|---|---|---|---|---|
| WT | 3475 (80) | 7502 (83) | 10977 (146) | |||
| R61N | 3399 (83) | −76 | 7575 (126) | 73 | 10974 (153) | −3 |
| G68D | 3468 (89) | −7 | 7628 (129) | 126 | 11096 (157) | 119 |
| D82I | 3449 (84) | −26 | 7604 (122) | 102 | 11053 (144) | 76 |
| A84T | 3453 (86) | −22 | 7554 (124) | 52 | 11007 (149) | 30 |
Standard deviations are calculated over three independent runs and shown in parentheses.
HPHOB = hydrophobic; HPHIL = hydrophilic; ΔSASA = SASAmutant − SASAWT.
Figure 1.
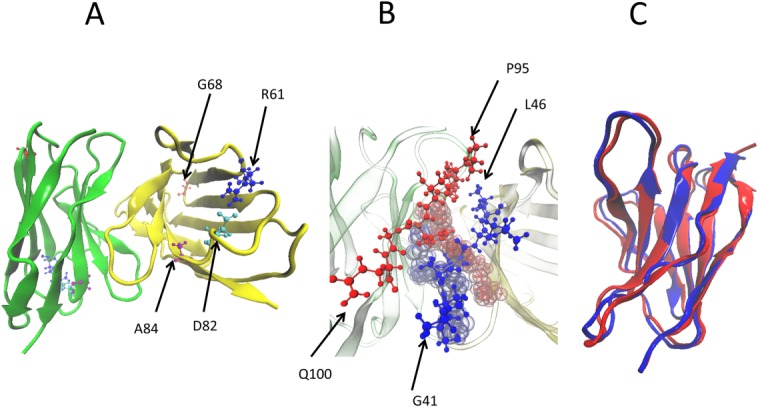
(A) Structure of dimer of the light-chain protein REI where yellow marks chain 1 and green does chain 2. The mutated residues are highlighted as blue = R61, red = G68, cyan = D82, and purple = A84. (B) The dimer interface of the REI light-chain protein. The second dimer interface is shown in the background, red = residues 94–101 of chain 1 and blue = residues 41–49 of chain 2. (C) Structural overlap of native and amyloid form of the REI light-chain protein.
Hydrogen bonding
A mutation occurring at a particular strand, loop, or region in the light-chain protein REI leads to a structural reorganization of the neighboring region and nearby loops or strands. This change in local conformation influences the hydrogen bonds formed between the mutated strand/loop region and nearby strands, or with the solvent. In order to determine the local effect, the number of hydrogen bonds between exposed loops or strands and the solvent are compared between the mutant dimers and the wild-type dimer. As shown in Supporting Information Table S2, the number of hydrogen bonds between the two chains differs little between wild type and mutants. However, all mutant dimers with the exception of the nonamyloidogenic D82I form more hydrogen bonds with the solvent than the wild-type dimer, but the effect is again small and within error bars.
Root-mean-square fluctuations
The solvent-accessible surface area calculations and protein–solvent hydrogen bond analysis confirm that the mutant dimers are less stable than the REI wild-type dimer. This can be also seen from the root-mean-square fluctuations (RMSF) shown in Figure 2. In this figure, we display for each residue the difference ΔRMSF between the average RMSF measured for a given mutant (where the average is taken over the three independent runs) and the corresponding value for the wild type. One can see from this figure that the fluctuations of the N-terminal residues are for all mutants higher than for the wild type. A similar observation is found for the E–F region (residues 45–54, consisting with the exception of Tyr49, Glu50, Ser52, and Asn53 of hydrophobic residues). Hence, due to the mutations R61N, G68D, D82I, or A84T, the E–F region of the protein gets more exposed to the solvent, increasing chances for dissociation of the dimer. This tendency is strongly enhanced for the R61N mutant where the fluctuations of the residues in the loop (76–84) (which joins C and H strands) of R61N have larger fluctuation than other mutants. Similarly, the R61N mutation disturbs the salt bridge between R61 and D82, and the residue D82 has higher fluctuation than other residues of R61N. The salt-bridge cannot be formed in the mutant D82I, where therefore the residue R61 has much higher fluctuation than the other residues. This can be seen in Figure 3 where we overlay a snapshot of R61N and D82I mutant dimers, taking in the last nanosecond of one trajectory, with the start configuration of the corresponding run. The regions which have shown structural changes or high fluctuations are indicated in the figure. Based on the above analysis, we suggest that N-terminal residues, E–F fragment, and loop (76–84) plays a greater role to initiate the dissociation process in the REI mutant than in the other mutants, and reduces further the stability of the dimer.
Figure 2.
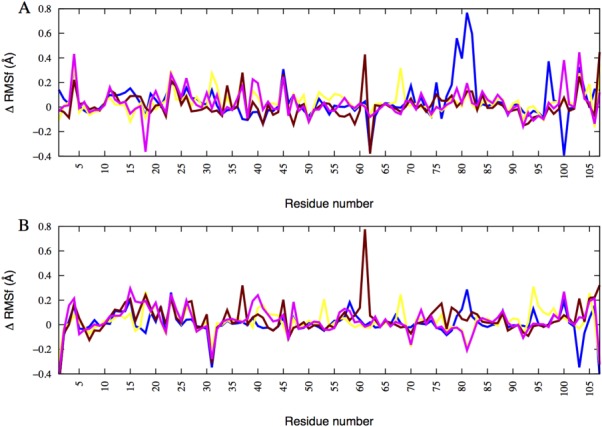
Difference (ΔRMSF = RMSFmutant − RMSFwild type) between the average root-mean-square-fluctuation of a mutant and wild type. A = chain 1 and B = chain 2. Blue = R61N, yellow = G68D, maroon = D82I, and magenta = A84T.
Figure 3.
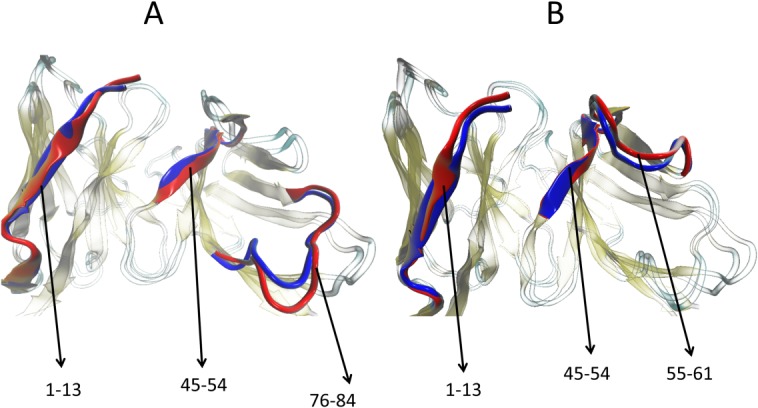
Overlap of a snapshot of (A) R61N and (B) D82I mutant dimers taken in the last nanosecond with the corresponding start configuration. The residues 1–13 are part of subunit 1 and residues 45–54, 55–61, or 76–84 belong to subunit 2.
Summary
In the above analysis, we find that, in the mutants, residues located in the N-terminus, E–F region, or the loop (76–84), regions that are more exposed to the solvent, have higher fluctuations than the wild type. They have a smaller number of main-chain–side-chain and side-chain-side-chain contacts between the residues of the loop (39–44) or strand F of one of the subunit and the residues 91–100 of another subunit in the mutants, and on average a larger distance between the participating residues at the dimer interface that form these contacts. As a consequence, there is an increased tendency for dissociation of dimer upon mutations that has been also observed in experiments.16,19,20
Stability analysis of REI wild type and mutant monomers in native and amyloid forms
We have suggested in the previous part that the equilibrium between dimers and monomers is shifted in the mutants toward the monomers, which in turn may cause in the mutants a higher rate of amyloid formation. However, this shift in equilibrium may not be the only factor leading to increased aggregation rates, and it cannot explain why, for instance, R61N forms amyloids while D82I rather forms amorphous aggregates. The probability for amyloid formation may also be raised in certain mutants because of a shift in the equilibrium between monomers in their “native” form and such in an amyloid form.
Role of salt bridges
In the REI wild type, a salt bridge is formed between Arg61 and Asp82. According to Nowak et al., the salt bridge between these two residues was broken in the early phase of the simulation, under both neutral and acidic conditions. For this reason, we have monitored in our simulations also the occurrence of salt bridges between either residues Arg61 and Asp82, or the alternative possibility of a salt bridge between residues Lys45 and Asp82. The salt bridge formation is followed during the last 50 ns of our trajectories. In general, there are two kinds of salt bridges, direct or indirect. A direct salt bridge is formed between two residues around 4.3 Å and an indirect or which is mediated by water molecules has a range of 4.3–7.0 Å.27,28 With these definitions, we do observe—in contradiction to Nowak et al.—the Arg61–Aps82 salt bridge in all systems (wild type and mutants, in both native and amyloid states—see next paragraph), except R61N and D82I where it cannot be formed. In no case do we find the Lys45–Asp82 salt bridge seen by Nowak et al. Hence, we believe that the Lys45–Asp82 salt bridge is not important for the stability of the monomers in either native or amyloid form, and likely does affect the aggregation tendencies of wild-type or mutant REI proteins.
Structural changes in native and amyloid monomer forms
In order to compare the relative stabilities of native and amyloid forms of wild type and mutants, we have generated amyloid models of the five proteins using the procedure described in the method section. These amyloid forms of the wild type and the four mutants were also followed in molecular dynamics simulations over 100 ns. The average RMSD to the start configurations, differences ΔRg in radius of gyration to the start configurations, and ΔΔRg between native and amyloid forms, as calculated from the last 50 ns of our trajectories, are shown in Table III. The average RMSD of all monomers are similar to each other. More interesting is the behavior of the radius of gyration. For the monomers in their native form, its value decreases, and with the exception of the D82I mutant, always more in the mutants than in the wild type. On the other hand, the radius of gyration increases in the simulations of both wild type and mutants in their amyloid form. The relative radius of gyration (ΔΔR) for each REI light-chain amyloid is calculated with respect to the corresponding difference in radius of gyration ΔRg of the REI protein in its native form. Clearly, the radius of gyration of amyloids is higher than that of the nonamyloid form, with the smallest values for the D82I mutants.
Table III.
Average Root-Mean-Square-Deviation (RMSD) and Radius of Gyration Rg of REI Light-Chain Monomers in the Native and Amyloid Forms as Calculated Using Last 50 ns of the Trajectories
| System | RMSD (Å) | ΔRg (Å) | ΔΔRg (Å) | ΔΔR (Å) |
|---|---|---|---|---|
| WT | 1.10 (0.12) | −0.29 (0.06) | ||
| R61N | 1.15 (0.11) | −0.36 (0.05) | −0.07 | |
| G68D | 1.05 (0.10) | −0.31 (0.05) | −0.02 | |
| D82I | 1.11 (0.11) | −0.22 (0.06) | 0.07 | |
| A84T | 1.04 (0.10) | −0.29 (0.05) | 0 | |
| WT (amyloid) | 1.16 (0.14) | 0.10 (0.07) | 0.39 | |
| R61N (amyloid) | 1.11 (0.11) | 0.14 (0.06) | 0.04 | 0.50 |
| G68D (amyloid) | 0.94 (0.08) | 0.03 (0.05) | −0.07 | 0.34 |
| D82I (amyloid) | 1.00 (0.11) | 0.06 (0.05) | −0.04 | 0.28 |
| A84T (amyloid) | 1.05 (0.13) | 0.11 (0.06) | 0.01 | 0.40 |
Standard deviations are calculated over three independent runs and shown in parentheses.
ΔΔRg = (ΔRg)mutant − (ΔRg)WT; ΔΔR = (ΔRg)amyloid form − (ΔRg)native form.
The last 20 ns of the trajectories are used to calculate the fluctuations of various loops and strands, comparing the RMSF for all residues between the native and amyloid forms of wild type and mutants. Similar as for the dimers, the RMSF of a residue is averaged for each system over all three independent trajectories. We then calculate for each residue in a mutant the difference in the RMSF between a monomer in the native form and when in amyloid form: ΔRMSFmutant = RMSFnative − RMSFamyloid. Subtracting the corresponding value ΔRMSFWT for the wild type allows us to characterize the influence of the various mutations on the relative fluctuations of residues in native and amyloid form by the so-defined quantity ΔΔRMSF shown in Figure 4. A pattern that we observe in this figure for all amyloid-forming mutants is that the RMSF of residues belonging to loops connecting the strands within one of the two beta-sheets are lower in the amyloid form than in the native form. One example is the Gly16 in the loop that connects strands A and B, other examples are the loops made out of residues 39–44 or 91–100. Especially interesting is the loop (39–44) that connects strands G and F, as the difference between the amyloid-forming mutants and D82I is most prominent. The relative fluctuations of residues in this loop are for the D82I mutant much larger while they are smaller in the amyloidognic mutants. The increased RMSF may indicate that the β-sheet made out of strands E, F, G, and H is for the D82I mutant not stable in the amyloid form leading to the observed preference for this mutant.
Figure 4.
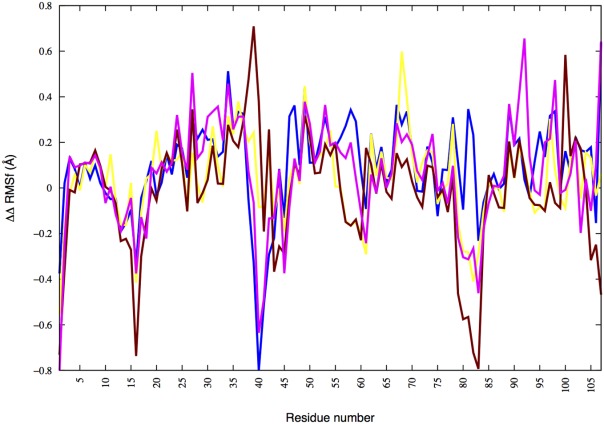
Relative root means square fluctuation (ΔΔRMSF) of mutants in the monomer form for native and amyloid forms calculated with respect to that of the wild type. The quantity ΔΔRMSF is defined in the main text. Blue = R61N, yellow = G68D, maroon = D82I, and magenta = A84T.
Free-energy differences between native and amyloid monomer forms
In order to probe whether the differences in volume growth and RMSF correspond to differences in stability, we have calculated the free-energy differences between amyloid and native forms of wild type and mutants. We define this free-energy difference as ΔΔG╪ = ΔGamyloid − ΔGnative, where the free energies of amyloid and native forms ΔGamyloid and ΔGnative are calculated by the MM-PBSA approach as described in the method section. These free energies for wild type and mutants in native and amyloid forms are tabulated in Table IV. Note that in calculating these values, we have neglected the configurational entropy as we are mostly interested in relative binding free energies of similar molecules, where this term is less important than when one considers absolute free energies, or if significant conformational changes occur upon binding.29,30 We believe that this assumption is justified as in our case the single point mutations lead in both native and amyloid form only to local conformational changes, that is, mutated loop or strand and its surrounding region while secondary and tertiary structure change little (see Table III and the previous subsection). In addition, in previous computational studies of short segments of the wild type and single-point-mutant amyloid aggregates, it was shown that the entropic contribution are negligible and only contribute a small fraction to the total free energy. This is also because the shorter peptides do not lose much conformational entropy upon incorporating into a β-sheet bilayer.31 Since at the same time, estimation of the entropy by normal mode analysis or quasi-harmonic approximation is inaccurate and prone to large errors, we have not included this term in our free-energy calculations.
Table IV.
Average Free Energies of REI Light-Chain Monomers in Their Native and Amyloid Forms as Obtained from MM-PBSA Calculations that Rely on the Last 10 ns of the Corresponding Trajectories
| System | Native | Difference | Amyloid | Difference | ΔΔG╪ |
|---|---|---|---|---|---|
| WT | −1964 (31) | −1943 (31) | |||
| R61N | −1842 (30) | 122 | −1827 (31) | 116 | −6 |
| G68D | −2015 (31) | −51 | −1999 (30) | −56 | −5 |
| D82I | −1884 (30) | 80 | −1848 (31) | 95 | 15 |
| A84T | −1988 (31) | −24 | −1979 (31) | −36 | −8 |
Data are in (kcal mol−1). Standard deviations are calculated over three independent runs and shown in parentheses.
ΔΔG╪ = Difference (amyloid) – Difference (native).
Note that in Table IV, the free energy of the native states is in all cases lower than that of the amyloid forms. However, the relative differences are smaller for the mutants R61N, G68D, and A84T than for the wild type (WT), suggesting that the amyloid formation is easier for these mutants than for the wild type. However, the accuracy of our free-energy calculations is not good enough to reproduce the relative ranking in aggregation propensity that has been observed in experiments, where R61N has the largest propensity followed by A84T, G68D, and the wild type. However, the free-energy differences show that for the mutant D82I in the amyloid form is more disfavored than the wild type. At the same time, the free energy of the mutant in its native form is higher than that of the wild type in the same state by 80 kcal mol−1, suggesting that D82I in its native form is much less stable than the wild type. Hence, the free-energy differences describe the experimental observation that D82I has a tendency to form amorphous (nonamyloid) aggregates, while R61N, G68D, and A84T prefer to form amyloids when losing their native structure.
In order to understand the differences in the stability, we have measured the solvent-accessible surface area of wild type and mutants in both native and amyloid state. We list in Table V both the total surface area of the start configuration and averages over the last 50 ns of the corresponding trajectories. For wild type and mutants in their amyloid form, the solvent-accessible surface area does not change significantly over the course of the simulations. However, the solvent-accessible area of the proteins in their native form decreases by about 700 Å2, until it approaches the corresponding value of the molecules in their amyloid form. Hence, once thermalized, the native form of wild type and most mutants differ little between themselves and that of the molecules in their amyloid form. The exception is the D82I mutant, where the loss of solvent-accessible surface area in the native form is considerably smaller than that for the other molecules in their native structure. As a consequence, the D82I mutant in its native form is much more exposed to the solvent than wild type and the other mutants. On the other hand, the solvent-exposed surface of the D82I mutant in its amyloid form does not differ significantly from that of the wild type. This makes the burial of residue 82 in the amyloid form even less favorable for this mutant than for the wild type, and therefore explains why this mutant does not aggregate into an amyloid. The solvent exposure is largest in the amyloid states for the mutant R61N making this state for this mutant more favorable than it is for the wild type. Note that the differences in solvent exposure for the other mutants are within the error bars, and therefore do not allow one to rank the mutants according their solvent exposure.
Table V.
Solvent-Accessible Surface Area (SASA) of Start Configuration and Averaged Over the Last 50 ns of the Respective Trajectories
| Initial | Last 50 ns | ||
|---|---|---|---|
| System | SASA | SASA | |
| WT | 6878 | 6160 (110) | |
| R61N | 6897 | 6132 (102) | |
| G68D | 6855 | 6203 (107) | |
| D82I | 6841 | 6336 (115) | |
| A84T | 6867 | 6158 (102) | |
| WT(amyloid) | 6205 | 6312 (138) | |
| R61N(amyloid) | 6243 | 6362 (119) | |
| G68D(amyloid) | 6198 | 6164 (109) | |
| D82I(amyloid) | 6214 | 6195 (110) | |
| A84T(amyloid) | 6220 | 6248 (112) | |
Data are for wild-type and mutant REI protein in the native and amyloid forms, and are given in (Å2). Standard deviations are calculated over three independent runs and shown in parentheses.
Solvent exposure of residues in native and amyloid monomer forms
In order to better understand the reasons for the differences in the stability of native and amyloid forms of wild type and mutants, we have calculated also the surface area of individual strands and connecting loops. These values are tabulated in Table VI. We note that in wild type and all mutants, the N-terminal residues are more exposed to solvent in the amyloid form than they are in their native forms, however, in the mutants this additional exposure is smaller than in the wild type. A similar effect is observed for the C-terminal residues where unlike the wild type, the corresponding differences are even negative in the mutants G68D and D82I. The larger exposure of the hydrophobic residues to solvent in the terminals is destabilizing the wild type in its amyloid form, and this effect is reduced in the mutants where these residues can form contacts with surrounding loops and strands. In a similar way is the amyloid state destabilized by exposure of strand B (residues 19–25) to water. For all five molecules is this strand, which is made out of three hydrophobic residues (Val19, Ile21, and Ala25) and polar residues (Thr20, Thr22, and Gln24), less exposed to solvent in the amyloid form than in the native form. However, the reduction in area is larger for the more amyloid-forming mutants than for the wild type. As the strand B is located in between the strands A and C, this reduction in area limits movement of this strand, and consequently are the fluctuation of strand B in wild type and mutants lower in the amyloid state than in the native state (Fig. 4). An opposite effect is seen for residues 26–38, where a larger exposure of the loop made by residues 26–32 (including the hydrophobic residues Ile29 and Ile30) or a smaller burial of the mostly polar residues of strand G (residues 33–38) in the mutants seems to stabilize the amyloid form over the native one. Hence, we observe again for the REI protein in the amyloid state that in all amyloid-forming mutants, the loops connecting the strands within one of the two beta-sheets are less exposed to solvent than the wild type. Examples are the loops made out of residues 14–18, 39–44, or 91–100. On the other hand, the difference in solvent exposure between molecules in amyloid and native state is for the residues in loop (26–32) that connect strands of different sheets (B and G) in these mutants even larger than the wild type.
Table VI.
Difference in Solvent-Accessible Surface Area of Various Strands and Loops (measured in Å2) Between Amyloid and Native State of the Various REI Light-Chain Proteins Calculated Using the Last 50 ns of the Sampling Process and Averaged Over All Trajectories
| Amyloid form − Native form |
|||||
|---|---|---|---|---|---|
| ΔSASA╪ |
|||||
| Position | WT | R61N | G68D | D82I | A84T |
| 1–13 | 37.36 | 21.99 | 24.44 | 9.91 | 7.86 |
| 14–18 | 14.17 | 1.62 | −5.67 | −15.95 | 2.90 |
| 19–25 | −12.68 | −15.77 | −21.54 | −18.14 | −12.58 |
| 26–32 | 41.24 | 74.55 | 46.75 | 54.38 | 54.85 |
| 33–38 | −17.66 | 2.94 | −5.49 | −13.12 | 3.62 |
| 39–44 | −2.99 | 6.40 | −1.27 | 36.86 | 0.72 |
| 45–49 | 11.28 | 10.37 | −1.92 | −11.21 | 8.74 |
| 50–54 | 22.64 | 17.72 | 1.77 | −8.02 | −5.23 |
| 55–61 | 0.50 | 8.59 | −11.93 | −8.18 | 6.70 |
| 62–68 | −4.41 | 17.41 | 2.52 | 4.63 | 6.65 |
| 69–75 | −2.40 | 19.51 | 0.16 | 0.18 | 1.26 |
| 76–84 | 43.88 | 53.10 | −1.39 | −124.35 | 23.96 |
| 85–90 | −10.99 | 8.27 | −14.75 | −21.42 | 5.16 |
| 91–100 | −5.58 | −6.83 | −10.25 | 7.08 | −6.96 |
| 101–104 | 7.86 | 3.09 | −6.18 | −17.49 | −11.40 |
| 105–107 | 27.97 | 2.58 | −0.73 | −8.68 | −1.58 |
ΔSASA╪ = SASAamyloid − SASAnative.
The effect of solvent exposure on the stability is most dramatic for the residues 76–84 (a loop which connects strands G and H), which for wild type and most mutants are more exposed to solvent in the amyloid state. The exception is D82I where the charged Asp82 is mutated to a hydrophobic Ile. In this mutant, the solvent-accessible area is reduced by about 130 Å2 in the amyloid state over the native form, which does not only change the structural arrangement of the loop (76–84) but also reduce its contact with the residues 34–39 (belonging to strand G and loop 39–44). In the wild type and amyloid-forming mutants, the side-chain of Gln37 (polar) interacts with the one of Asp82 (charged), with the interaction being stronger in the amyloid state than in the native state. The difference is largest for R61N, where the average side-chain–side-chain distance between Gln37 and Asp82 is 5.7 (0.9) Å in the amyloid state, and 6.4 (1.0) Å in the native state. However, in the D82I mutant, the corresponding average side-chain–side-chain distance (here between Gln37 and Ile82) is in the amyloid state is with 10.1 (1.4) Å much larger. The increase is more modest in the native state where one measures for this mutant a distance of 7.2 (1.0) Å. Because of the weaker side-chain–side-chain interactions are the residues 37–39 in the D82I mutant more flexible, reducing the stability of the β-sheet made out of strands E, F, G, and H in the amyloid form, and therefore leading to a preference for an unstructured aggregate in this mutant. This is different in the amyloid-forming mutants where in the amyloid state the loop (76–84) is more exposed to the solvent than in the native state, but does not loses the stabilizing contact with the residues 37–39. For instance, in the R61N mutant there are 7 side-chain–side-chain contacts between the loop (76–84) and residues 37–39 in the native structure, but nine in the amyloid state. The exposure of the residues (76–84) and their contacts with the residues 37–39 seem to form a stabilizing element in the amyloid structure. This backbone is largest in R61N—the mutant with the highest propensity to form amyloids—where it compromises residues 26–90 and exposes in the amyloid state a multitude of hydrophobic residues.
Summary
Comparing between wild type and four mutants, the relative stability of monomers in their native form over that of the monomers in an amyloid form, we derived a reasoning that explains why some mutations lead to a higher tendency of amyloid formation than others, and why the D82I mutant forms amorphous aggregates. We argue that these differences result to a large extend from the constraints that these mutations put on the contacts that residues in loop (76–84) can form with residues 37–39. This hypothesis may explain why the mutant R61N forms fibril while D82I forms amorphous aggregates. At the same time, we do not find evidence for the hypothesis by Nowak et al.22 who assume that the differences between the mutants (and the wild type) result from the way these mutant affects the salt bridge Arg61 and Asp82, or the alternative possibility of forming a salt bridge between residues Lys45 and Asp82.
Discussion
Using molecular dynamics simulations, we have studied factors that modulate amyloid formation in light-chain proteins, a class of proteins implicated in the most common form of systemic amyloidosis. In order to probe these factors, we have compared the stability of wild type and mutants of the light-chain protein REI, both as monomer and as dimers. We find that two processes contribute to the amyloid formation. The first one is the dissociation of the dimers. As already known from experimental investigations, all four mutants (R61N, G68D, A84T, and D82I mutants) shift the equilibrium from dimers to monomers. We show that this is because certain hydrophobic residues are more exposed in the mutant dimers than in the wild type reducing the relative stability of the dimer. The second process is the transition of monomers from their native state into an amyloid form. This is a complex process, likely involving nucleation and growth phases that our computational resources did not allow us to study. Instead we have compared the relative stabilities of native and amyloid structures for the wild type and four mutants. Free-energy calculations using a MM-PBSA approximation indicate that in all cases (wild-type and mutants), the native structure is favored over the amyloid state, however, in the three amyloid-forming mutants R61N, G68D, and A84T less than in the wild type. On the other hand, the amyloid state is for the D82I mutant, which is known to form unstructured aggregates, even more disfavored over the native one than it is in the case of the wild type. As the native structure of this mutant is also less stable than the wild type, our free energies reflect the experimental observation19 that this mutant tends to form amorphous, nonamyloid aggregates when losing its native structure. We argue that these differences in free energy again can be explained by the relative exposure of the molecules to the solvent. For instance, the hydrophobic Ile82 induces a reduction of the solvent-accessible surface area that destabilizes the amyloid structure as it reduces the chances for association with other chains. On the other hand, in the most amyloid-forming R61N mutant, a backbone of mostly hydrophobic residues is exposed in the amyloid form, allowing for easy association of chains in amyloids. In summary, our analysis suggest that for the development of drugs targeting light-chain-associated systemic amyloidosis, one should look for components that either stabilize the dimer by binding to the dimer interface, or reduce the probability for the amyloid form in the monomers.
Materials and Methods
Model preparation
In order to compare our results with previous studies, we use the same light-chain protein as that of Nowak et al. The Bence-Jones immunoglobulin κ I light-chain protein REI was extracted from a urine sample of a patient suffering with multiple myeloma32 and its structure has been resolved by X-ray crystallography for the wild type (PDB-ID: 1REI) and for a number of mutants (PDB-ID: 1BWW, 1AR2, and 4L1H).32–34 In solution, the protein forms a dimer that at room temperature and neutral pH is in equilibrium with potentially amyloid-forming monomers.19 Each unit of the folded REI light-chain protein is build out of nine β-strands (A–I, following the notation in Nowak et al.), wherein the β-strands E, F, G, H, and I belongs to β-sheet 1 and A, B, C, and D to β-sheet 2.2 The β-sheets are arranged in a sandwich model as shown in Figure 5. There is a disulfide bond between Cys23 and Cys88, and a salt bridge between Arg61 and Asp82. The prolines and charged residues of the edge strands, the β-bulge in strand I, and the region made out of residues 40–61 (which includes the E and F strands) protect the protein against solvent.35 In Figure 1(A,B) we show the REI dimer, marking the location of the various mutations (R61, G68, D82, and A84) considered in this study. The two chains interact at two interfaces: the residues 41–46 in one unit, belonging to the loop (39–44) that connects the strands G and F and to strand F (45–49) interact with the loop (91–100) of the other unit, which connects the strands H and I. The residues R61 and D82 form a salt bridge and one can see that the residues D82 and A84 are close. Note that none of the mutated residues are located at the dimer interface. For both monomers and dimers, we generate models of the mutant structures by replacing in the wild-type structure (1REI) wild-type residues with mutant residues where they differ. Using the tleap module of Amber1236 and the ff99SB37 force field, we have generated in this way the four mutant structures: R61N, G68D, D82I, and A84T.
Figure 5.
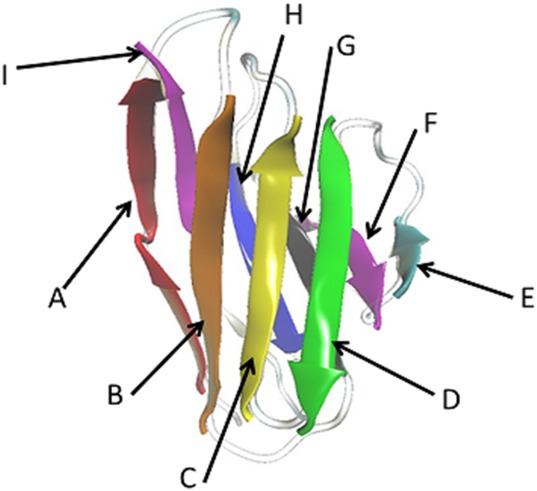
Structure of the light-chain protein REI, with the β-strands made out of residues: A = 4–13, B = 19–25, C = 69–75, D = 62–67, E = 53–54, F = 45–49, G = 33–38, H = 85–90, and I = 101–104. The β-strands A, B, C, and D belong to β-sheet 2 and E, F, G, H, and I belong to β-sheet 1.
As the structure of the REI light-chain in its amyloid form has not been resolved, we had to construct a model using as template the fibril model of another, similar, light-chain protein. This κ I light-chain protein has been characterized using the urine sample of a patient with systemic amyloidosis. It has an 86% sequence identity with the REI protein, 38 the positions and types of residues by that the two proteins differ are listed in Table VII. Two fibril models of BRE are available in the Protein Data Bank. In both structures (PDB-ID: 1BRE and 1QP1),38,39 the chains are arranged in a pseudohexagonal shape that contains six dimers in a 180° turn. The diameter is about 100 Å and is in agreement with electron microscopy measurements of amyloid fibrils. The crystal structure of 1QP1 is made of three monomers, whereas 1BRE has six monomers or three dimers. Hence, in order to decrease the finite-size effects, we chose as template a central monomer (chain D) of the larger 1BRE structure. This is reasonable as both proteins exist as dimers and have similar number of β-sheets, loops, and connectivity, and each of the monomer contains 107 residues. Using again the tleap module of Amber12 and the ff99SB37 force field, we have generated from this template the fibril-form of the REI light-chain by replacing in the 1BRE chain the residues listed in Table VII with that of the REI protein. We have named the so-generated model WT (amyloid) as opposed to its native structure which we call just WT. An overlap of both structures is also shown in Figure 1(C). In a similar way, we have then generated the fibril forms of the four mutants: R61N (amyloid), G68D (amyloid), D82I (amyloid), and A84T (amyloid).
Table VII.
Comparison of Altered Residues Between REI and BRE
| Residue | 1BRE | 1REI |
|---|---|---|
| 30 | Ser | Ile |
| 31 | Asp | Lys |
| 34 | Ile | Asn |
| 39 | Lys | Thr |
| 40 | Leu | Pro |
| 45 | Asn | Lys |
| 50 | Asp | Glu |
| 53 | Thr | Asn |
| 55 | Glu | Gln |
| 56 | Thr | Ala |
| 70 | Glu | Asp |
| 92 | Asp | Gln |
| 93 | Asp | Ser |
| 104 | Val | Leu |
| 105 | Glu | Gln |
| 107 | Lys | Thr |
Computational setup
The above generated protein models are simulated using the program package Gromacs 4.6.240 and the ff99SB37 force field. Each system is put into the center of a truncated octahedron box (monomers) or cubic box (dimers) with at least 12 Å distance between the molecule and the boundary. The box is then filled with TIP3P41,42 water molecules, and an appropriate number of Na+ ions are added to neutralize the system. Because of periodic boundary conditions, the electrostatic interactions are calculated using Particle–Mesh–Ewald summation. Hydrogen atoms are constrained using the LINCS algorithm,43 and the TIP3P water molecules with the Settle algorithm.44 The temperature of 298.15 K is kept constant by the Parrinello–Donadio–Bussi algorithm45 (τ = 0.1 fs), which is similar to Berendsen coupling but adds a stochastic term that ensures a proper canonical ensemble.45,46 In a similar way, the pressure is kept constant at 1 bar by the Parrinello–Rahman algorithm (τ = 1 fs).47,48 All models are initially minimized and equilibrated for 100 ps under NVT and then for 200 ps under NPT ensemble at 298.15 K. Measurements are then taken from a simulation of 100 ns under NVT conditions. For each system, three independent trajectories are simulated with a 2 fs time step, using different initial velocities.
Molecular dynamics simulations of proteins are often limited by insufficient sampling and slow convergence. A simple way to speed up sampling by modest factors of 2–8 is to reduce the mass of solvent and side chain atoms. Such mass-scaling is equivalent to lowering the viscosity of the system, and therefore allows the system to cross more efficiently high energy barriers.49,50 In order to test the effect of mass scaling, we have simulated the REI wild-type monomer in initial benchmark simulations with the settings described above. The masses of solvent and side chain were rescaled using various λ values (λ = 0.4, 0.5, 0.6, 0.8, and 1.0, where λ = m/mo, m is the parameterized atomic mass, and mo is the standard atomic mass). From these initial simulations, we conclude that a factor λ = 0.5 in the mass scaling is optimal, and this scaling factor is used by use in subsequent simulations for data generation.
The postsimulation analyses are performed using the tool set of the Gromacs package, that is, RMSD, radius of gyration (Rg), RMSF, hydrogen bonding, salt-bridges, solvent-accessible surface area (SASA), and secondary structure analysis using DSSP. For all systems, the ΔG values are calculated using the MM-PBSA approach.51,52 For this purpose, we have chosen randomly a configuration collected in the last nanosecond of the trajectory previously derived with Gromacs 4.6.2. The selected snapshots serve as a start point for three independent trajectories (with different velocity distributions) of 50 ns length that relies on the Amber12 software and the ff99SB37 forcefield.26,53 Approximations of the ΔG values are calculated from the last 10 ns of these trajectories and exclude contributions from the conformational entropy. This is an often used approximation in amyloid studies29,30 and partially motivated by the difficulties in estimating the conformational entropy from a normal mode analysis using a rigid-rotor harmonic-oscillator ideal-gas approximation of the system that leads to large systematic and statistical errors. As the contributions by this term are expected to be small,31 and as one is usually interested only in the relative free-energy differences between systems that differ little in structure, it seems justified to neglect this term in the estimation of free-energy differences.
Acknowledgments
The simulations were done on the BOOMER cluster of The University of Oklahoma. This work used the Computing resources of the Extreme Science and Engineering Discovery Environment (XSEDE), which is supported by National Science Foundation.
Supporting Information
Additional Supporting Information may be found in the online version of this article.
Supporting Information
References
- 1.Merlini G, Seldin DC, Gertz MA. Amyloidosis: pathogenesis and new therapeutic options. J Clin Oncol. 2011;29:1924–1933. doi: 10.1200/JCO.2010.32.2271. [DOI] [PMC free article] [PubMed] [Google Scholar]
- 2.Poshusta TL, Sikkink LA, Leung N, Clark RJ, Dispenzieri A, Ramirez-Alvarado M. Mutations in specific structural regions of immunoglobulin light chains are associated with free light chain levels in patients with AL amyloidosis. Plos One. 2009;4:e5169. doi: 10.1371/journal.pone.0005169. [DOI] [PMC free article] [PubMed] [Google Scholar]
- 3.Baden EM, Randles EG, Aboagye AK, Thompson JR, Ramirez-Alvarado M. Structural insights into the role of mutations in amyloidogensis. J Biol Chem. 2008;283:30950–30956. doi: 10.1074/jbc.M804822200. [DOI] [PMC free article] [PubMed] [Google Scholar]
- 4.Fändrich M. Oligomeric intermediates in amyloid formation: structure determination and mechanisms of toxicity. J Mol Biol. 2012;421:427–440. doi: 10.1016/j.jmb.2012.01.006. [DOI] [PubMed] [Google Scholar]
- 5.Sisodia SS, Price DL. Role of the beta-amyloid protein in Alzheimer's disease. Faseb J. 1995;9:366–70. doi: 10.1096/fasebj.9.5.7896005. [DOI] [PubMed] [Google Scholar]
- 6.Winner B, Jappelli R, Maji SK, Desplats PA, Boyer L, Aigner S, Hetzer C, Loher T, Vilar M, Campioni S. In vivo demostration of alpha-synuclein oligomers are toxic. Proc Natl Acad Sci USA. 2011;108:4194–4199. doi: 10.1073/pnas.1100976108. [DOI] [PMC free article] [PubMed] [Google Scholar]
- 7.Ross CA, Tabrizi SJ. Huntington's disease: from molecular pathogenesis to clinical treatment. Lancet Neurol. 2011;10:83–98. doi: 10.1016/S1474-4422(10)70245-3. [DOI] [PubMed] [Google Scholar]
- 8.Athanasou NA, West L, Sallie B, Puddle B. Localized amyloid deposition in cartilage is glycosaminoglycans-associated. Histopathology. 1995;26:267–272. doi: 10.1111/j.1365-2559.1995.tb01441.x. [DOI] [PubMed] [Google Scholar]
- 9.Beyreuther K, Bush AI, Dyrks T, Hilbich C, Konig G, Monning U, Multhaup G, Prior R, Rumble B, Schubert W. Mechanisms of amyloid deposition in Alzheimer's disease. Ann N Y Acad Sci. 1991;640:129–139. doi: 10.1111/j.1749-6632.1991.tb00204.x. [DOI] [PubMed] [Google Scholar]
- 10.Paleolgou KE, Kragh CL, Mann DMA, Salem SA, Al-Shami R, Allsop D, Hasan AH, Jensen PH, El-Agnaf OMA. Detection of elevated levels of soluable alpha-synuclein oligiomers in post-morterm brain extracts from patients with dementia with Lewy bodies. Brain. 2009;132:1093–1101. doi: 10.1093/brain/awn349. [DOI] [PubMed] [Google Scholar]
- 11.Kyle RA, Gertz MA. Primary systemic amyloidosis: clinical and laboratory features in 474 cases. Semin Hematol. 1995;32:45–59. [PubMed] [Google Scholar]
- 12.Sanchorawala V. Light-chain (AL) amyloidosis: diagnosis and treatment. Clin J Am Soc Nephrology. 2006;1:1331–1341. doi: 10.2215/CJN.02740806. [DOI] [PubMed] [Google Scholar]
- 13.Rosenzweig M, Giralt S, Landau H. Light-chain anyloidosis: SCT, novel agents and beyond. Bone Marrow Transplant. 2013;48:1022–1027. doi: 10.1038/bmt.2012.199. [DOI] [PubMed] [Google Scholar]
- 14.Rajkumar SV, Dispenzieri A, Kyle RA. Monoclonal gammopathy of undetermined significance, Waldenstrom macroglobulinemia, AL amyloidosis, and related plasma cell disorders: diagnosis and treatment. Mayo Clin Proc. 2006;81:693–703. doi: 10.4065/81.5.693. [DOI] [PubMed] [Google Scholar]
- 15.Olsen KE, Sletten K, Westermark P. Fragments of the constant region of immunoglobulin light chains are constituents of AL-amyloid proteins. Biochem Biophys Res Commun. 1998;251:642–647. doi: 10.1006/bbrc.1998.9508. [DOI] [PubMed] [Google Scholar]
- 16.Souillac PO, Uversky VN, Millett IS, Khurana R, Doniach S, Fink AL. Effect of association state and conformational stability on the kinetics of immunoglobulin light chain amyloid fibril formation at physiological pH. J Biol Chem. 2002;277:12657–12665. doi: 10.1074/jbc.M109230200. [DOI] [PubMed] [Google Scholar]
- 17.Qin Z, Hu D, Zhu M, Fink AL. Characterization of the partially folded intermediates of an immunoglobulin light chain leading to amyloid fibrillation and amorphous aggregation. Biochemistry. 2007;46:3521–3531. doi: 10.1021/bi061716v. Structutal. [DOI] [PubMed] [Google Scholar]
- 18.Khurana R, Gillespie JR, Talapatra A, Minert LJ, Ionescu-Zanetti C, Millett I, Fink AL. Partially folded intermediates as critical precursors of light chain amyloid fibrils and amorphous aggregates. Biochemistry. 2001;40:3525–3535. doi: 10.1021/bi001782b. [DOI] [PubMed] [Google Scholar]
- 19.Helms LR, Wetzel R. Specificity of abnormal assembly in immunoglobulin light chain deposition disease and amyloidosis. J Mol Biol. 1996;257:77–86. doi: 10.1006/jmbi.1996.0148. [DOI] [PubMed] [Google Scholar]
- 20.Hurle MR, Helms LR, Li L, Chan W, Wetzel R. A role for destabilizing amino acid replacements in light-chain amyloidosis. Proc Natl Acad Sci USA. 1994;91:5446–5450. doi: 10.1073/pnas.91.12.5446. [DOI] [PMC free article] [PubMed] [Google Scholar]
- 21.Hernandez-Santoyo A, Yauner LP, Fuentes-Silva D, Ortiz E, Rudino-Pinera E, Sanchez-Lopez R, Horjales E, Becerril B, Roriguez-Romero A. A single mutation at the sheet switch region results in conformational changes favoring lambda6 light-chain fibrillogenesis. J Mol Biol. 2010;396:280–292. doi: 10.1016/j.jmb.2009.11.038. [DOI] [PubMed] [Google Scholar]
- 22.Nowak M. Immunoglobulin kappa light chain and its amyloidogenic mutants: a molecular study. Proteins. 2004;55:11–21. doi: 10.1002/prot.10606. [DOI] [PubMed] [Google Scholar]
- 23.Kobayashi Y, Tsutsumi H, Abe T, Ikeda K, Tashiro Y, Unzai S, Kamikubo H, Kataoka M, Hiroaki H, Hamada D. Decreased amyloidogencity caused by mutational modulation of surface properties of the immunoglobulin light chain BRE variable domain. Biochemistry. 2014;53:5162–5173. doi: 10.1021/bi5007892. [DOI] [PubMed] [Google Scholar]
- 24.Pastor N, Millan-Pacheco C, Murphy-Perez F, Fernandez-Velasco DA. Amyloid fiber precursors in native and denaturing MD simulations of an IG light chain domain. Biophys J. 2010;98:200a. [Google Scholar]
- 25.Buck PM, Kumar S, Singh SK. Insights into the potential aggregation liabilities of the b12 Fab fragment via elevated temperature molecular dynamics. Protein Engin Des Sel. 2013;26:195–206. doi: 10.1093/protein/gzs099. [DOI] [PubMed] [Google Scholar]
- 26.Alred EJ, Scheele EG, Berhanu WM, Hansmann UHE. Stability of Iowa mutant and wild type Aβ-peptide aggregates. J Chem Phys. 2014;141:175101. doi: 10.1063/1.4900892. [DOI] [PMC free article] [PubMed] [Google Scholar]
- 27.Luo JH, Marechal JD, Warmlander S, Graslund A, Peralvarez- MA. In silico analysis of the apolipoprotein E and the amyloid beta peptide interaction:misfolding induced by frustration of the salt bridge network. PLoS Comput Biol. 2010;6:e100663. doi: 10.1371/journal.pcbi.1000663. [DOI] [PMC free article] [PubMed] [Google Scholar]
- 28.Dzubiella J. Salt-specific stability and denaturation of a short salt-bridge forming alpha helix. J Am Chem Soc. 2008;130:14000–14007. doi: 10.1021/ja805562g. [DOI] [PubMed] [Google Scholar]
- 29.Wang J, Morin P, Wang W, Kollman PA. Use of MM-PBSA in reproducing the binding free energies to HIV-1 RT of TIBO derivatives and predicting the binding mode to HIV-1 RT of Efavirenz by docking and MM-PBSA. J Am Chem Soc. 2001;123:5221–5230. doi: 10.1021/ja003834q. [DOI] [PubMed] [Google Scholar]
- 30.Homeyer N, Gohlke H. Free energy calculations by the molecular mechanics Poisson–Boltzmann surface area method. Mol Informat. 2012;31:114–122. doi: 10.1002/minf.201100135. [DOI] [PubMed] [Google Scholar]
- 31.Park J, Kahng B, Hwang W. Thermodynamic selection of steric zipper patterns in the amyloid cross-beta spine. PLoS Comput Biol. 2009;5:e10000492. doi: 10.1371/journal.pcbi.1000492. [DOI] [PMC free article] [PubMed] [Google Scholar]
- 32.Epp O, Lattman EE, Schiffer M, Huber R, Palm W. Molecular structure of a dimer composed of the variable portions of the Bence-Jones protein REI refined at 2.0-Å resolution. Biochemistry. 1975;14:4943–4952. doi: 10.1021/bi00693a025. [DOI] [PubMed] [Google Scholar]
- 33.Uson I, Bes MT, Sheldrick GM, Schneider TR, Hartsch T, Fritz HJ. X-ray crystallography reveals stringent conservation of protein fold after removal of the only disulfide bridge from a stabilized immunoglobulin variable domain. Fold Des. 1997;2:357–361. doi: 10.1016/S1359-0278(97)00049-7. [DOI] [PubMed] [Google Scholar]
- 34.Uson I, Pohl E, Schneider TR, Dauter Z, Schmidt A, Fritz HJ, Sheldrick GM. 1.7 A structure of the stabilized REIv mutant T39K. Application of local NCS restraints. Acta Cryst. 1999;D55:1158–1167. doi: 10.1107/s0907444999003972. [DOI] [PubMed] [Google Scholar]
- 35.Richardson JS, Richardson DC. Natural beta-sheet proteins use negative design to avoid edge-to-edge aggregation. Proc Natl Acad Sci USA. 2002;99:2754–2759. doi: 10.1073/pnas.052706099. [DOI] [PMC free article] [PubMed] [Google Scholar]
- 36.Case DA, Darden TA, Cheatham TE, Simmerling CL, Wang J, Duke RE, Luo R, Walker RC, Zhang W, Merz KM. AMBER 12. San Francisco: University of California; 2012. [Google Scholar]
- 37.Hornak V, Abel R, Okur A, Strockbine B, Roitberg A, Simmerling C. Comparison of multiple Amber force fields and development of improved protein backbone parameters. Proteins. 2006;65:712–25. doi: 10.1002/prot.21123. [DOI] [PMC free article] [PubMed] [Google Scholar]
- 38.Schormann N, Murrell JR, Liepnieks JJ, Benson MD. Tertiary structure of an amyloid immunoglobulin light chain protein: a proposed model for amyloid fibril formation. Proc Natl Acad Sci USA. 1995;92:9490–9494. doi: 10.1073/pnas.92.21.9490. [DOI] [PMC free article] [PubMed] [Google Scholar]
- 39.Steinrauf LK, Chiang MY, Shiuan D. Molecular structure of the amyloid-forming protein kappa I Bre. J Biochem. 1999;125:422–429. doi: 10.1093/oxfordjournals.jbchem.a022303. [DOI] [PubMed] [Google Scholar]
- 40.Pronk S, Pall S, Schulz R, Larsson P, Bjelkmar P, Apostolov R, Shirts MR, Smith JC, Kasson PM, van der Spoel D. GROMACS 4.5: a high-throughput and highly parallel open source molecular simulation toolkit. Struct Bioinformat. 2013;29:845–854. doi: 10.1093/bioinformatics/btt055. [DOI] [PMC free article] [PubMed] [Google Scholar]
- 41.Zachariae U, Schneider R, Briones R, Gattin Z, Demers JP, Giller K, Maier E, Zweckstetter M, Griesinger C, Becker S. Beta-barrel mobility underlies closure of the voltage-dependent anion channel. Structure. 2012;20:1540–1549. doi: 10.1016/j.str.2012.06.015. [DOI] [PMC free article] [PubMed] [Google Scholar]
- 42.Kutzner C, Grubmuller H, de Groot BL, Zachariae U. Computational electrophysiology: the molecular dynamics of ion channel permeation and selectivity in atomistic detail. Biophys J. 2011;101:809–817. doi: 10.1016/j.bpj.2011.06.010. [DOI] [PMC free article] [PubMed] [Google Scholar]
- 43.Hess B. P-LINCS: a parallel linear constraint solver for molecular simulation. J Chem Theory Comput. 2008;4:116–122. doi: 10.1021/ct700200b. [DOI] [PubMed] [Google Scholar]
- 44.Miyamoto S, Kollman PA. Settle: an analytical version of the SHAKE and RATTLE algorithm for rigid water models. J Comp Chem. 1992;13:952–962. [Google Scholar]
- 45.Bussi G, Donadio D, Parrinello M. Canonical sampling through velocity rescaling. J Chem Phys. 2007;126:014101. doi: 10.1063/1.2408420. [DOI] [PubMed] [Google Scholar]
- 46.Bussi G, Zykova-Timan T, Parrinello M. Isothermal-isobaric molecular dynamics using stochastic velocity rescaling. J Chem Phys. 2009;130:074101. doi: 10.1063/1.3073889. [DOI] [PubMed] [Google Scholar]
- 47.Parrinello M, Rahman A. Polymorphic transitions in single-crystals - a new molecular-dynamics method. J Appl Phys. 1981;52:7182–7190. [Google Scholar]
- 48.Berhanu WM, Yasar F, Hansmann UHE. In silico cross seeding of a beta and amylin fibril-like oligomers. ACS Chem Neurosci. 2013;4:1488–1500. doi: 10.1021/cn400141x. [DOI] [PMC free article] [PubMed] [Google Scholar]
- 49.Lin IC, Tuckerman ME. Enhanced conformational sampling of peptides via reduced side-chain and solvent masses. J Phys Chem B. 2010;114:15935–15940. doi: 10.1021/jp109865y. [DOI] [PubMed] [Google Scholar]
- 50.Schulz JCF, Schmidt L, Best RB, Dzubiella J, Netz RR. Peptide chain dynamics in light and heavy water: zooming in on internal friction. J Am Chem Soc. 2012;134:6273–6279. doi: 10.1021/ja211494h. [DOI] [PubMed] [Google Scholar]
- 51.Sun H, Li Y, Tian S, Xu L, Hou T. Assessing the performance of MM/PBSA and MM/GBSA methods. 4. Accuracies of MM/PBSA and MM/GBSA methodologies evaluated by various simulation protocols using PDBbind data set. Phys Chem Chem Phys. 2014;16:16719–16729. doi: 10.1039/c4cp01388c. [DOI] [PubMed] [Google Scholar]
- 52.Rastelli G, Del Rio A, Degliesposti G, Sgobba M. Fast and accurate predictions of binding free energies using MM-PBSA and MM-GBSA. J Comput Chem. 2010;31:797–810. doi: 10.1002/jcc.21372. [DOI] [PubMed] [Google Scholar]
- 53.Berhanu WM, Hansmann UHE. The stability of cylindrin b-barrel amyloid oligomer models—a molecular dynamics study. Proteins. 2013;81:1542–1555. doi: 10.1002/prot.24302. [DOI] [PMC free article] [PubMed] [Google Scholar]
Associated Data
This section collects any data citations, data availability statements, or supplementary materials included in this article.
Supplementary Materials
Supporting Information