

Abstract
The System for Continuous Observation of Rodents in Home-cage Environment (SCORHE) was developed to demonstrate the viability of compact and scalable designs for quantifying activity levels and behavior patterns for mice housed within a commercial ventilated cage rack. The SCORHE in-rack design provides day- and night-time monitoring with the consistency and convenience of the home-cage environment. The dual-video camera custom hardware design makes efficient use of space, does not require home-cage modification, and is animal-facility user-friendly. Given the system’s low cost and suitability for use in existing vivariums without modification to the animal husbandry procedures or housing setup, SCORHE opens up the potential for the wider use of automated video monitoring in animal facilities. SCORHE’s potential uses include day-to-day health monitoring, as well as advanced behavioral screening and ethology experiments, ranging from the assessment of the short- and long-term effects of experimental cancer treatments to the evaluation of mouse models. When used for phenotyping and animal model studies, SCORHE aims to eliminate the concerns often associated with many mouse-monitoring methods, such as circadian rhythm disruption, acclimation periods, lack of night-time measurements, and short monitoring periods. Custom software integrates two video streams to extract several mouse activity and behavior measures. Studies comparing the activity levels of ABCB5 knockout and HMGN1 overexpresser mice with their respective C57BL parental strains demonstrate SCORHE’s efficacy in characterizing the activity profiles for singly- and doubly-housed mice. Another study was conducted to demonstrate the ability of SCORHE to detect a change in activity resulting from administering a sedative.
Keywords: Video monitoring, Home-cage behavior, Mouse behavior, Mouse activity profiling
There has been increased interest in automated video-based monitoring of laboratory mice. This is evidenced by both the commercial availability of monitoring systems such as PhenoTyper (Noldus Information Technology), Home Cage Environment (CleverSys Inc), ANY-maze Cage (Stoelting Co), and PhenoRack (ViewPoint Life Sciences Inc), along with the corresponding video processing algorithms EthoVision XT, HomeCageScan, ANY-maze, and VideoTrack used to extract behavior measures. Additionally, several noncommercial mouse-monitoring systems or methods have been developed (Branson & Belongie, 2005; de Chaumont et al., 2012; Jhuang et al., 2010; Zarringhalam et al., 2012; Zurn, Xianhua, & Motai, 2005b). The noninvasive nature of video-based monitoring systems combined with the precision and granularity of behavioral measures afforded by such systems enables more advanced and thorough studies in comparison to basic systems limited to a running wheel or photobeam detectors (Baker, 2011; Zurn, Hohmann, Dworkin, & Motai, 2005a; Zurn et al. 2005b). Studies have shown the importance of monitoring mice in the home-cage to eliminate the stress-induced effects caused by transplanting a mouse into a specialized test environment (Baker, 2011; Goulding et al., 2008; Schaefer & Claridge-Chang, 2012; Spruijt & DeVisser, 2006; Steele, Jackson, King, & Lindquist, 2007). The video analysis algorithms developed are highly automated, thereby eliminating the need for manual observation or scoring, which avoids processing variation caused by human factors or multiple scorers (Noldus, Spink, & Tegelenbosch, 2001; Schaefer & Claridge-Chang, 2012). The data generated by these algorithms complements data collected by other means (e.g., physiological signals, weight/size, food consumption) to provide a more extensive phenotype of the mice, and/or a more rigorous assessment of the effect of novel treatments. These measurements could also function as a streamlined screening tool, such as to provide a quick comparative determination (with a previously recorded baseline) of the viability of a mouse to undergo further treatment or experimentation.
The System for Continuous Observation of Rodents in Home-cage Environment (SCORHE) was designed to demonstrate the feasibility of integrating large scale video surveillance methods in animal facilities by means of efficient mechanical design leveraging a non-traditional camera configuration. The SCORHE design addresses three challenges likely encountered when considering large scale or high-throughput video monitoring of rodents: the cost of procuring custom cages and racks, the need for additional vivarium real-estate, and the increase in staff workload for operating and maintaining specialized monitoring equipment. SCORHE is specifically designed for monitoring mice housed in commercial home-cages placed in compatible ventilated vivarium racks while maintaining the full cage-rack functionality intended by the manufacturer. Rack-based ventilation systems not only maintain proper air-circulation in individual cages, the systems also aim to prevent contamination across cages by exhausting spent air out of the whole room. Hence, SCORHE operation in ventilated racks helps to mitigate biosecurity concerns associated with disease transmission within the vivarium. In contrast to SCORHE’s seamless integration with a standard commercial home-cage (with corresponding rack system), many commercially available monitoring systems require custom cages such as the PhenoTyper and ANY-maze Cage. A few rack-based commercial monitoring systems are available, such as PhenoRack. However, these racks are custom, nonventilated, and have reduced cage capacity as compared to standard commercial racks. These disadvantages limit the large-scale use of currently available commercial systems, as well as known noncommercial (i.e., research prototype) systems, for automated monitoring in typical existing vivariums. Overcoming these limitations, the novel SCORHE design does not reduce the number of cages that can be accommodated by the rack, nor require custom rack mechanical modifications. When compared with other systems, the SCORHE mechanical design results in two key advantages: negligible footprint and compatibility with ventilated racks.
Contrary to commercial home-cage video-monitoring system designs (see Table 1 in the Appendix), which are limited to a top-down view and/or side-view perspective of the cage, SCORHE cameras provide a bird’s-eye view of the cage. The choice of camera perspective affects three, often conflicting, output video desiderata: provide sufficient mouse shape detail, improve the accuracy of tracking multiple mice, and facilitate detection of mice in images despite frequent changes in bedding position and appearance. A camera with a side-view perspective is placed at mid-cage height with the image plane parallel to the side wall of the cage. The resulting video has sufficient detail to enable resolving fine-grained behavior such as grooming (Edelman, 2011). Video processing for side-view systems is particularly challenging due to occlusions and background variations resulting from bedding moved around by the mouse (Branson, 2007; Farah, Langlois, & Bilodeau, 2012; Zarringhalam et al., 2012). A greater challenge inherent to camera side-view systems is the difficulty of developing behavior analysis methods for a cage housing multiple mice (Branson & Belongie, 2005; Edelman, 2011). More specifically, with a side-view perspective, the frequency of severe or total occlusion of one mouse by another significantly impedes the development of robust automated video-based behavior detection methods. For this reason, all existing video processing methods for single camera side-view systems are effectively limited to a solitary housed animal. The sole known attempt to analyze video of multiple mice in a camera sideview system (Branson & Belongie, 2005) was limited to tracking the mouse position and contour in a 1,000-frame sequence (~33 s), as opposed to processing a long-term recording or analyzing behavior. A camera with a top-down perspective and corresponding video processing is more tolerant to bedding changes and more informative for mouse floor-position tracking, but offers less detail for detecting micro-movements such as grooming (Edelman, 2011). Additionally, the mechanical constraints resulting from operation in a ventilated rack using the typical commercial cages preclude the use of a camera with a top-down perspective, whether for a single camera design or to augment a side-view camera. The vantage point of SCORHE cameras provides more suitable video detail for behavior detection than do top-down-view systems, and increased tolerance to bedding changes, as well as improved ability to resolve two-mouse occlusions, than do side-view systems.
Software methods were developed to automate analysis of SCORHE output video. One implementation of the software is specific to processing videos of solitary housed mice, whereas the other derives activity measures for cages housing two mice. The software methods were applied to SCORHE recordings of three studies. The results reported in this article demonstrate the utility of SCORHE in profiling behavior over long durations.
Hardware description
A primary focus of the SCORHE mechanical design was to achieve compatibility, maintain efficiency, and increase functionality when integrating SCORHE with commercially available ventilated racks. The National Cancer Institute (NCI) vivariums predominantly use the Maxi-Miser Rack Systems (Thoren Caging Systems Inc, Hazleton, PA) populated with the Model 5 Expanded Mouse Cage (Fig. 1). SCORHE hardware is constrained by the remaining space between adjacent cages, as well as the space between opposing (i.e., back-to-back) cages in double-bay racks.
Fig. 1.

Thoren Caging Systems Maxi-Miser ventilated double-bay racks found in National Cancer Institute vivariums. The cage features are typical of a mouse home-cage, including a bedding material, b a wire-bar lid, which has both c an integral water bottle basket and d a food basket. The cage is also fitted with e a cage cover, which also serves as an air filter cap
The wire-bar lid (Fig. 1) inevitably presents a viewing obstruction to any video capture system design limited to a single camera. Consequently, the SCORHE video acquisition system design employs two cameras to reduce system blind spots caused by the hanging food and water baskets.
The prototype SCORHE unit (Fig. 2) is powered by a single 12-V DC supply and outputs two analog video signals—one from each of two cameras. Three main features of the system include (1) dual cameras with fish-eye lenses, (2) near-infrared (NIR) illumination, and (3) easy cage access.
Fig. 2.

a SCORHE 3-D computer-aided design model, with component functions indicated by color codes. The unit’s dimensions are given in the Appendix. b A more detailed design drawing of the side assembly, showing placement of the two near-infrared (IR) illumination bars, as well as the assembly covers, which serve three purposes: to secure the two acrylic diffusors, to fasten the side assemblies to the back-plate, and to provide a hinged mount and latch for the front door
The two camera/lens pairs are configured in opposing directions at the center front and rear of the cage. To limit SCORHE’s rear hardware space consumption to that available between two opposing cages in double-bay racks (i.e., two cages situated back-to-back in racks), remote-head cameras were chosen (P/N: STC-HR170; Sensor Technologies America, Carrollton, TX) to minimize the overall depth of the video capture system. The rear camera remote sensor paired with a lens occupies the limited available space while allowing the cage in the opposite rack cage slot to be fully inserted from the back of the rack. For the front camera, the thin profile afforded by the use of a remote-head sensor keeps the SCORHE unit from protruding too far forward into the limited walkway between racks, which minimizes the likelihood of vivarium staff bumping into the system.
The space constraints necessitated lens placement close (<3 mm) to the cage front and rear surfaces. The close proximity of the lenses to the cage then mandated the use of fish-eye lenses (DSL215B-NIR; Sunex Inc., Carlsbad, CA) to provide a panoramic view sufficiently wide so as to image the entire cage volume. The close proximity of the lenses to the cage surfaces is also advantageous because this minimizes reflections (off the front and rear cage surfaces) being captured by the imaging system.
The chosen camera and lens pair, along with the pair placement and orientation, results in three relatively small spatial regions in the cage volume that are not visible through either camera. When in these areas, a portion of the mouse is effectively hidden from the video capture, and, therefore, not fully accounted for in the video processing algorithms. Within these areas (Fig. 3), the food and water baskets prevent a direct line of sight to the lens for imaging. The three blind spots include the left and right partial regions bounded by the side plates of the food hopper and the cage walls (blue), as well as the partial volume directly beneath the center of the hopper (magenta).
Fig. 3.

Cage drawing, illustrating the overlapping region visible to both SCORHE cameras (green), as well as the occluded regions: directly beneath the center of the food hopper (pink) and, on both sides of the cage, the partial volume bounded by the cage wall and the side plate of the food hopper (blue)
The lenses are placed near the top of the cage front and rear walls, with a downward tilt of approximately 25 deg. This configuration, when compared to a lens placed at midcage height without a tilt, minimizes field-of-view blockage due to bedding pile-ups. In a home-cage, bedding displaced by the mouse walking, foraging, or digging (Branson, 2007; Farah et al., 2012; Zarringhalam et al., 2012) is at times piled up against the wall through which the cage is viewed. Furthermore, in cages housing multiple mice, the SCORHE’s elevated position and downward-angled lens decreases the likelihood and severity of mouse–mouse occlusions.
The NIR panels (Fig. 2) consist of a pair of high-flux LED strips (P/N: IR12-850; Environmental Lights, San Diego, CA) placed at opposite ends (i.e., top and bottom) sandwiched between a parallel set of quarter-inch-thick white acrylic sheets (P/N: 12129 [PlexiGlas G, color code W7328]; Altuglas International, Briston, PA; see Fig. 2b). The total side assembly thickness is limited to less than the distance between cages placed side-by-side in consecutive rack cage slots. Even with SCORHE units installed in a rack, this side assembly thickness design constraint ensures that a rack can still be loaded to the manufacturer-intended full capacity of cages. The top LED strip illuminates downward, and the bottom LED strip illuminates upward. The acrylic sheets diffuse the NIR strip series of discrete LED sources to provide sufficiently uniform illumination in the cage volume.
The SCORHE camera sensor heads do not include a NIR-blocking filter that is routinely found in visible-spectrum cameras. Without a NIR-blocking filter, the SCORHE cameras provide sufficient NIR sensitivity, resulting in video of brightness and contrast sufficient for reliable downstream image processing. In addition, a (human) visible-light-blocking filter (Kodak Wratten Infrared Filter, P/N: NT54-518; Edmund Optics, Barrington, NJ) was installed between the lens and camera sensor. Blocking the visible spectrum limits the effective video capture illumination to only that from the uniform NIR panel sources, therefore enabling consistent captured video brightness and contrast throughout dark and light cycles, as well as other lighting variations caused by a specific cage’s physical location and temporal shadowing in the animal room. Because vivarium diurnal-cycle light levels have no effect on the SCORHE output video, a single video-processing algorithm (e.g., image pixel threshold level) can be used, independent of the time of acquisition. Reliance on NIR imaging results in grayscale video output.
SCORHE integrates seamlessly with the cage racks without hindering access to the cages. The SCORHE assembled unit is simply slid into the rack cage slot (Fig. 4) by guiding the side assemblies (i.e., NIR illumination panels) into the channels that normally separate (i.e., unused open space) neighboring cages. The SCORHE unit includes a hinged door with a magnetic latch to allow for effortless cage insertion and removal from the rack as required for routine animal care procedures. The door incorporates two large window cutouts, ensuring that the internal home-cage light levels coincide with the diurnal cycling ambient light in the vivarium rooms. Furthermore, the windows enable the animal care staff to conduct routine visual inspections of the mice without disrupting the SCORHE monitoring.
Fig. 4.

a SCORHE installed (yellow arrows) in the cage rack, demonstrating seamless integration while maintaining the full rack cage capacity and b providing easy access to the cage via the hinged door with windows
The output video is input to a four-channel digital video recorder (P/N: DX-TL4U; Mitsubishi Electric, Irvine, CA). The quad-video tiled output of the digital video recorder is then digitized via an analog-to-USB video converter (DVD EZMaker USB Gold; AVerMedia Technologies Inc., Fremont, CA) and saved to file via the software bundled with the converter (CyberLink PowerDirector v5; CyberLink USA, Santa Clara, CA). Subsequent processing, described in the Algorithms section, was accomplished on a computer (Dell Precision T3500, Windows 7 Platform, Intel Xeon 3.47-GHz processor) running MathWorks MATLAB and Simulink.
In summary, the SCORHE hardware’s mechanical integration with ventilated racks helps to eliminate the prohibitive costs, real-estate concerns, and air-management issues that would otherwise impede large-scale and long-term use of mouse monitoring in animal facilities.
Software methods
The viability of the SCORHE as a behavior analysis tool hinges on the ability to automate processing of the two video outputs. The SCORHE output video is inherently different from that of other monitoring systems, due to camera perspective and close proximity, as well as the effect of fish-eye lenses. These differences preclude the use of current academic or commercial video analysis software to process the SCORHE video. Specialized algorithms were developed to demonstrate the potential for accurate automated processing of SCORHE video. The methods employed were kept simple, since the aim was not to attain an upper limit on accuracy or the number of measurable behaviors. More elaborate methods would enhance the accuracy of analysis and increase the level of detail (e.g., measurement variety and subtle behavior discrimination). The SCORHE algorithms were developed using MATLAB and Simulink (The Mathworks Inc., Natick, MA). Currently, the SCORHE output video is saved to a hard disk, and the algorithms are run in postprocessing mode.
Singly-housed mouse video analysis
A thoroughly validated SCORHE algorithm (Fig. 5) was developed for use with singly-housed mice to measure the distance traveled by the mouse, as well as to report the time durations of the mouse placement (i.e., on-floor, off-floor, or on-hind legs in a rearing posture). The processing algorithm for a singly housed mouse is based on the fusion of information derived from both SCORHE cameras. A nearest-neighbor classifier (Malley, Malley, & Pajevic, 2011) is employed to determine whether the mouse is completely on the floor, totally off the floor (i.e., on the wire-bar lid), or in a rearing posture with only the hind legs on the floor (except during scratching or grooming, in which case the mouse is considered to be on the floor). The training data set consisted of approximately 120,000 frames acquired from many SCORHE video clips, with each image being manually assigned one of the three possible designations. The feature set on which the automated classification is reliant is composed of basic binary silhouette (blob) statistics—namely, centroid, area, and the end points of the ellipse fit parameters’ major and minor axes. If the mouse is in the field of view of both cameras, blob data from both views (i.e., front and rear) are fused, and the prediction is based on the concatenated features set. The output of this three-category classifier, already a coarse measure of activity, is a necessary parameter for estimating the mouse’s physical coordinates within the cage space. In conjunction with temporal information, the physical coordinates provide the means to measure the distance traveled by the mouse, and could also be used to estimate the speed of mouse movement.
Fig. 5.

SCORHE processing algorithm for a singly-housed mouse. a Read front- and rear-view images from the video files. b Mouse pixels are isolated by the subtraction of fixed background intensities. For each view, the segmentation step retains the single largest binary silhouette (blob). c Features derived from the binary silhouette statistics (e.g., the centroid and ellipse fit parameters, as shown in the middle image) are input to a classifier to automatically determine the placement of the mouse. d If the mouse is found to be on-floor or off-floor, the centroid physical coordinates are estimated via learned mappings (see Fig. 6). e Placement classification and coordinate estimation results are used to calculate and report the mouse activity measures
The physical coordinates of the mouse center are needed to compute the distance traveled by the mouse. The SCORHE camera arrangement does not provide multiple (e.g., orthogonal) views of the whole cage space, and thus precludes the use of traditional rigorous mathematical models for recovering physical coordinates from output images (Forsyth & Ponce, 2003). Mathematical modeling is further hindered by ambiguities, not unique to SCORHE, due to self-occlusion (i.e., when the posture of the mouse renders parts of the same mouse unobservable in video). Yet another challenge in generating a mouse’s physical coordinates in the cage is the nonlinear distortion introduced by the SCORHE fish-eye lens.
To address these challenges and to enable the acquisition of training data sets that would aid in estimating the mouse’s physical coordinates, a custom training and validation system, hereinafter referred to as the “validation system,” was designed and constructed (Fig. 6). Operating simultaneously and without interfering with the SCORHE video acquisition, the validation system provides multiple video views into the cage that more readily yield the physical coordinates (along the width and length of the cage, but not the height) of the mouse. The validation system’s translucent acrylic construction houses NIR illumination bars (P/N: IR12-850; Environmental Lights, San Diego, CA) and two cameras (P/N: STC-H172; Sensor Technologies America, Carrollton, TX) fitted with standard lenses (DSL115A-NIR; Sunex Inc., Carlsbad, CA). A mouse is placed in a cage fitted with a clear plastic grid on the floor instead of bedding. The cage is placed in the SCORHE unit, which in turn is placed on the validation system. Video feeds from both the SCORHE and validation system units are simultaneously recorded. The recordings are processed as outlined in Fig. 6 to generate a learning set for pairing the projection of the mouse in the SCORHE image plane to the actual physical position obtained via the validation system imaging. One learning set was constructed for frames in which the mouse was on the cage floor. Another learning set was constructed for frames in which the mouse was on the ceiling. When the mouse is on-hind legs, no mapping for position is sought, and hence no learning set was constructed. Instead of using the same validation setup to gather on-ceiling mouse position data, the validation system was placed in an inverted orientation on top of the cage, and the normal cage lid was removed to render the cage visible to the validation system cameras. The primary reason for using the top-down view of the cage was to avoid the negative effects (e.g., no hanging from ceiling) on mouse behavior in the absence of cage bedding.
Fig. 6.

Validation system fabricated to obtain precise physical coordinates of the mouse as it moves around the cage, simultaneous to SCORHE video acquisition. a The SCORHE unit is raised by b a clear acrylic box pedestal so that the fields of view of standard lens-equipped cameras c and d encompass the entire cage. The cameras and near-infrared illumination are housed in the e translucent white acrylic base. Views g and i are concatenated, and background subtraction is performed to locate the mouse (annotated with yellow ellipses). The coordinates of the mouse silhouette in the concatenated image are converted to actual physical coordinates via a mapping function obtained through a previous camera calibration procedure. The mouse is simultaneously viewed in the SCORHE images f and h. The blob statistics of the mouse appearing in the SCORHE views are paired with the physical coordinates obtained via the validation system imaging to form a learning set. The learning set is used to generate a mapping function for estimating physical coordinates solely based on SCORHE view blob statistics
Two mapping functions were utilized, one for the floor plane (i.e., when the mouse is on the floor) and another for the ceiling plane (i.e., when the mouse is hanging on the ceiling). For on-floor position estimation, a third-degree polynomial least-squares fit was employed to model the relation between SCORHE’s blob centroid and the physical position. The fit was generated on the basis of 6,000 sets of coordinate pairs (i.e., the physical coordinates extracted from the validation system video, and the corresponding blob image centroid extracted from SCORHE video). When the mouse is on the ceiling, the SCORHE blob centroid was not sufficient to correlate image coordinates to physical coordinates. Instead, all blob statistics are utilized in estimating position. The estimate is obtained through a weighted k-nearest-neighbor method, with k=20. The on-ceiling learning set is composed of approximately 5,000 measured coordinates paired with the corresponding set of SCORHE blob statistics. When a frame showing the mouse on the ceiling is captured by SCORHE, the extracted blob statistics are compared against the onceiling learning set. The Euclidean distance between the extracted set of blob statistics and each element of the learning set is computed. An average of the coordinates of the nearest 20 data points weighted by the inverse distance is taken to be the on-ceiling position estimate. The resulting physical coordinates’ estimates are used to compute the distance traveled on-floor and off-floor via temporal subtraction.
The results from the SCORHE singly housed mouse algorithm are reported in 1-h increments over the complete circadian cycle. The time allotments corresponding to each of the three placement classifier outputs (i.e., on-floor, off-floor, on-hind legs) are simply the fractions of frames assigned to each of the three categories during each hour. To compute the distance traveled each hour, the difference in the mouse positions at 2-s intervals is computed using the Euclidean metric and summed over the entire hour. Depending on the application, a different position sampling-time interval could be used for the computation of the distance traveled. For example, hyperactive mice would likely require a shorter sampling interval to avoid underestimating the distance traveled. When the mouse is classified to be on-hind legs, no physical-coordinate estimate is generated. The contribution to the distance traveled measure in this case is the difference between the mouse position immediately prior to standing on-hind legs and the position immediately after fully returning to the floor or climbing to the ceiling.
The SCORHE algorithm developed for singly-housed mouse video processing was evaluated for accuracy. To quantify the accuracy of the distance traveled measure, video feeds from both the SCORHE and the validation system units were simultaneously recorded. The validation system video was processed to extract the precise coordinates of the mouse. For each hour, the cumulative sum of the difference in physical coordinates at 2-s intervals was regarded as the actual distance traveled. This actual distance traveled was compared to the distance traveled estimate generated by the SCORHE video-processing algorithm. The ratio of the estimated distance and the actual distance traveled was defined as the SCORHE accuracy ratio. A 60,000-frame sequence recording was used to establish an accuracy measure for the on-floor distance traveled estimation. The mouse was on-floor for a total of 18,524 frames, distributed throughout the entire sequence, and on-hind legs for the remaining frames. The SCORHE on-floor distance traveled measure accuracy ratio was 97 %. A 2,900-frame-sequence recording was used to establish an accuracy measure for the on-ceiling distance traveled estimation. The mouse was on ceiling for the full duration of the sequence. The accuracy for the SCORHE on-ceiling distance traveled measure was 90 %.
To assess the performance of the SCORHE mouse placement classifier, out-of-bag cross-validation methods were used. Namely, 100 cases were randomly selected for testing and classified against the remaining cases in the training set. This process was repeated 1,000 times, and the errors were averaged to obtain the error rates. When the mouse was visible to both cameras, and hence binary silhouette features from both views were used as features for the classification, the error rate was 0.8 %. When the mouse was only visible to the front camera, the classification error rate was 0.9 %. When the mouse was only visible to the rear camera, the classification error rate was 1.0 %. To further quantify the error rates, a set of independent video clips totaling 88,811 frames were manually labeled. The accuracy of the mouse placement classifier was determined by comparing the automated SCORHE classifier output with manual scoring. The three different behaviors (i.e., mouse placement on-floor, off-floor, or on-hind legs) were represented almost uniformly within the chosen video clips (Fig. 7).
Fig. 7.
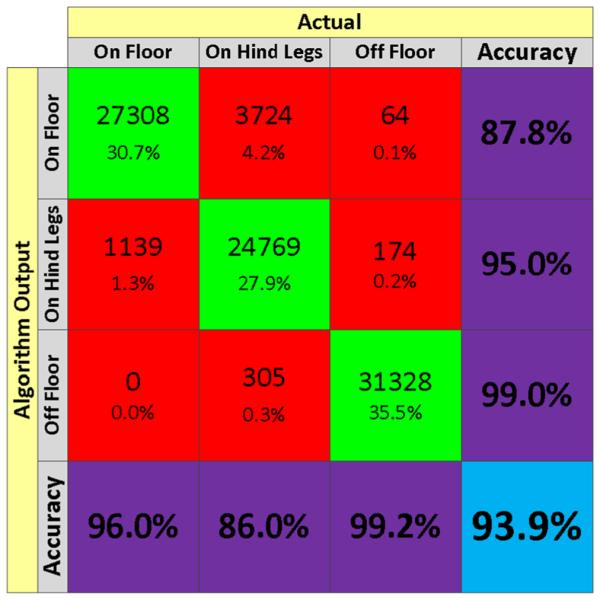
Confusion matrix for SCORHE’s processing of the placement class of a singly-housed mouse. The matrix is based on the automated classifier output for 88,811 manually scored frames
Doubly-housed mice video analysis
A separate algorithm was developed to process SCORHE videos of doubly-housed mice (Fig. 8). However, besides qualitative visual validation and achieving the expected result, the two-mouse algorithm was not thoroughly validated, and is only reported to demonstrate the feasibility of developing the SCORHE video analysis software that would be required when housing more than one mouse per home cage.
Fig. 8.

SCORHE processing algorithm for doubly-housed mice. a Read front- and rear-view images from the video files. The dashed red circles enclose a mouse that is visible to both cameras (i.e., overlapping region between camera views). b Segmentation is performed to isolate fore-ground objects (mouse blobs colored in red and blue) in both views. The blobs are assigned identities on the basis of the presence in overlapping (highlighted in green) and nonoverlapping (highlighted in yellow) regions. Blobs appearing in the overlapping region are matched and assigned the same identity (indicated by the red color), whereas blobs appearing at least partially in nonoverlapping regions are assigned another identity (indicated by the blue color). c If the number of blobs with unique identities is two, then the status is one of no occlusion. If, however, only one unique identity has been assigned, then the status is two occluding mice (i.e., each mouse does not result in a binary silhouette isolated from that of the other mouse). For a status of occlusion, a rough assessment of the occlusion’s severity is obtained by comparing the size of the convex hull of the occluded blob to the overall size of the blob. Occluded blobs in which the size ratio does not exceed an empirically chosen threshold (e.g., the green-colored blob in the middle image) are deemed to be severely occluded, and there is no subsequent attempt to resolve the occlusion. For other occluded blobs with a size ratio exceeding the threshold (e.g., the segmentation output of the left set of frames, shown in red and blue), the perpendicular (solid pink line) to the (dashed pink) line connecting the extreme points (green X annotations) having the longest distance to the blob perimeter is used to identify the occlusion junction (dashed yellow circle). The occluded blob is split along a line passing through the occlusion junction point and parallel to the radial line of a circle centered at the centroid of the occluded blob. All pixels on one side of the dividing line are considered to belong to one mouse, whereas pixels on the other side of the line are considered to belong to the other mouse. d The minimum Euclidean distance between blob centroids in successive frames is used to maintain the identities of the mice in cases of no occlusion or resolved occlusion. If, however, the mice are determined to be severely occluded, the mouse identities are lost. e The blob identities, combined with the blob properties, are used to compute activity measures. One measure of interest is the number of times that a mouse exceeds a vertical threshold (yellow annotation)
One of the desired mouse-monitoring measures is the count of rearing events. A rearing event is marked by the mouse changing posture from all forelimbs on the floor to an elevated bipedal stance. Detecting a rearing event in video involves checking when mouse pixels cross a line in the image (Fig. 8e) that approximates a vertical threshold plane. Other activity measures are the number of crossings along both the shorter dimension of the cage (i.e., side-to-side) as well as the longer dimension (i.e., front-to-rear, and vice versa) with appropriate hysteresis regions around the virtual planes dividing front/rear and left/right spaces within the cage. Because the motion of a blob encompassing two occluding mice is due to the displacement of both mice, the crossing counts are incremented by two when such a blob crosses from one portion of the cage to another. This is contrary to the rearings count, in which case overestimation is avoided by singly incrementing the count when a blob encompassing two occluding mice goes above the vertical threshold. Finally, the duration of time that the mice remain motionless is also computed by comparing changes in the perimeter of the mouse blob every 2 s. If the number of perimeter pixels that have changed position is within an empirically set tolerance, the mouse is considered as having been inactive for the past 2 s. An inactive single occluded blob is regarded as both mice being inactive.
Study 1: Solitary-housed mice
Subjects
The first study was designed to compare the mouse activity profiles of singly-housed mice of the ABCB5 knockout (KO) strain and the C57BL/6J wild-type (WT) strain (Gillet & Gottesman, 2011). Four-month-old mice, five male and five female, of each strain were used.
Method
The study utilized two SCORHE units. A home-cage with the WT strain was placed in one of the SCORHE units, whereas the cage housing the KO strain was placed in the other, both at the start of a dark cycle. Both strains were allowed 24 h for acclimation and were subsequently recorded for two full diurnal cycles. The SCORHE video recordings were later processed to generate the activity measures discussed in the Software Methods section.
The animal facility daily light cycle was 12 h of darkness followed by 12 h of light. The study conformed to the guidelines of the National Institutes of Health (NIH) Animal Care and Use Committee (ACUC).
Results
The SCORHE video-processing algorithm was applied to the video recordings of the singly housed ABCB5 KO strain mice and the corresponding C57BL/6J WT strain. Two of the three output mouse placement classes of the singly-housed mouse processing algorithm (i.e., on-floor, on-hind legs, off-floor) are shown for female KO and WT mice in Fig. 9a. To compactly display the mouse placement proportions for both strains (i.e., KO and WT), each bar is generated by stacking the five-day averaged off-floor and on-hind leg placement percentages. The remainder of each hour (i.e., the area above the bar to 100 %), although not explicitly shown in the graph, logically corresponds to a mouse’s on-floor placement. The mouse distance traveled measure (inches/hour) is shown in Fig. 9b. The processing rate is approximately 23 frames per second. A linear mixed model for repeated measures (LMMRM) statistical analysis was applied to all measures to reveal any significant difference due to the genetic manipulation. In all cases, the difference was not significant (degrees of freedom = 8, F value = 0.331, p = .58, for the distance traveled measure; degrees of freedom = 8, F values = 0.007, 0.123, and 0.806, p = .40, .73, and .94, for the on-floor, off-floor, and on-hind legs placement durations, respectively). The similarity between the activity profiles is useful information when comparing the behavior of these parental and knockout C57BL/6J mice.
Fig. 9.

Mouse activity profile comparison for five sets of singly-housed wild-type C57BL/6J strain (WT) and ABCB5 knockout strain (KO). Plot a shows the percentages of time for off-floor and on-hind legs placement. Plot b is the distance traveled measure. The start time for both plots corresponds to the start of the vivarium dark cycle, as indicated by the gray shading
Discussion
Overall, the accuracy reported in this article for the singly-housed mouse algorithm demonstrates the capability of over-coming the added complexity introduced by the use and downward orientation of fish eye lenses.
The geometry of the cage fitted with a food hopper prevented a single-camera design, because large regions of the cage would be hidden from the camera view. Despite SCORHE using two cameras, a few small spatial regions of the cage still remained out of view of both cameras. For example, depending on a mouse’s size and orientation, the mouse in the cage regions adjacent to the side plates of the food hopper could be unobservable. Because these hidden regions are rather small, the behavior of the mouse within them is very restricted, and therefore the mouse is simply characterized as being “off-floor.” Furthermore, the time duration that a mouse typically occupies these hidden regions is small (e.g., less than 0.5 % in the 972 h of video). The development of more advanced SCORHE processing algorithms will help mitigate the effects of video blind spots. For example, the time duration occupying a blind spot could be accounted for by reliably detecting entry into and exit from the blind spots. Algorithm-based detection of entry and exit into blind spots can also be extended to scenarios in which cage enrichment results in additional hidden zones within the cage.
Study 2: Sedation of doubly-housed mice
Subjects
The subjects of the second study were two C57BL/J6 wild-type strain mice. The mice were five months old.
Method
This experiment was designed to enable qualitative evaluation of the output of the two-mice processing algorithm. More specifically, the study was designed to demonstrate the utility of SCORHE in detecting deviation from a baseline activity profile for doubly-housed mice. The mice were housed in a single cage that was placed in a SCORHE unit and recorded for three consecutive diurnal cycles. Subsequently, in order to induce a pronounced effect on activity, the same mice were subjected to a 0.667-mg/kg dose of the sedative Acepromazine (Chu et al., 2014) at the beginning of the dark cycle, the time at which the mice would normally exhibit high activity levels. This amount of sedative and the timing of administration was repeated for three consecutive days. The SCORHE video of the sedated mice was acquired only during the dark cycle over a time duration sufficient to encompass the temporal difference in activity levels due to the sedation. The study conformed to the guidelines of the NIH ACUC.
Results
For SCORHE video processing of doubly-housed mice, wild-type strain baseline recordings were processed to generate a 3-day average of four activity measures: rearing count, inactivity duration, front-to-back crossing count, and side-to-side crossing count (Fig. 10). The algorithm processing rate was similar to that of the singly-housed mouse algorithm, at approximately 23 frames per second. The video recorded after the mice received a dose of sedative was processed to extract the same measures for comparison to the previously acquired baseline. The decreased activity in the sedated mice is evident for the first 5 h (Fig. 11) of the dark cycle, as verified by a one-sided U test (n = 5, U = 24, p = .010, for rearings count; n = 5, U = 2, p = .010, for percentage of time spent inactive; n = 5, U = 24, p = .010, for front-to-rear crossing count; and n = 5, U = 19.5, p = .087, for side-to-side crossing count).
Fig. 10.

Three-day average of mouse circadian activity profile for the doubly-housed C57BL/6J strain. The gray shading in the plots indicates the dark cycle. The utility of SCORHE to monitor circadian rhythm is demonstrated by four measures: a rearing counts, b percentages of time inactive, c front-to-rear crossing counts, and d side-to-side crossing counts
Fig. 11.

Effect of a 0.667-mg/kg dosage of Acepromazine (a tranquilizer) on wild-type C57BL/6J strain mice: a rearing counts, b percentages of time inactive, c front-to-rear crossing counts, and d side-to-side crossing counts
Discussion
The SCORHE video analysis of doubly-housed mice further demonstrates the adequacy of the system design for yielding accurate behavior measures. The video processing results confirm the circadian activity synchronization to the vivarium diurnal cycle (Fig. 10), as well as a diminished activity level due to sedation (Fig. 11). Additional confidence in the video processing results was gained by manual viewing of the video to confirm higher mouse activity in dark versus light cycles, as well as in control versus sedated mice. The SCORHE doubly-housed mouse processing algorithm output measures (e.g., occurrence of a rearing event, side-to-side crossing events, or continued inactivity) were overlaid as text labels on the processed video clips to facilitate a manual visual check on the accuracy of the automated output measures.
Study 3: Phenotyping of doubly-housed mice
Subjects
The subjects of the phenotyping study were two HMGN1 overexpressing mice (Abuhatzira, Shamir, Schones, Schäffer, & Bustin, 2011) and two of their C57BL/6J parental strains. The mice were eight months old.
Method
For each strain, a cage housing both mice was placed in a SCORHE unit and recorded for two full 24-h diurnal cycles. The recording started at the beginning of the 12-h dark cycle. The study conformed to the guidelines of the NIH ACUC.
Results
Figure 12 shows the side-to-side and front-to-back crossing counts for both the HMGN1 overexpresser mice and the corresponding wild-type mice. One set of mice were recorded for two days, enabling a two-day average. The results show a significant increase in activity (one-sided U test with n = 24, U = 160.5, p = .004, for front-to-rear crossing count; n = 24, U = 170.5, p = .0075, for side-to-side crossing count) for the overexpresser mice relative to the wild-type strain.
Fig. 12.

Two-day average for doubly housed HMGN1 overexpresser mice (OE) and C57BL/6J wild-type strain mice (WT): a front-to-back crossing counts, and b side-to-side crossing counts
Discussion
The results of the HMGN1 comparison (Fig. 12) are in agreement with reported results (Abuhatzira et al., 2011) for the short monitoring durations (i.e., a half hour) that are possible with a commercial mouse-monitoring system.
A single activity profile representing the sum of all mouse activity in the cage is obtained from the algorithm output measures, rather than having a unique activity profile for each mouse. The loss of mouse identity during severe occlusions prevents the generation of multiple mouse behavior profiles (i.e., a unique profile for each mouse). Severe occlusions, although reduced in frequency by the SCORHE design, would equally preclude any video processing algorithm from uniquely identifying unmarked mice subsequent to the occlusion. For research applications requiring mouse identity to be maintained throughout the experiment, marking methods such as bleaching a unique fur pattern (Ohayon, Avni, Taylor, Perona, & Roian Egnor, 2013) or radio-frequency identification chip implants (Weissbrod et al., 2013) could be employed.
The SCORHE unit side assemblies were designed to provide uniform NIR illumination along the full length of the cage. A consequence of the side assembly design is the reduction of ambient room light intensity entering the cage. However, the SCORHE unit front window cutouts allow adequate ambient room light into the cage for maintaining the mouse circadian cycle, as is shown by the activity profiles in Figs. 9, 10, and 12. The observed results are consistent with studies that have shown that small variations in light intensity are sufficient to photo-entrain rodents to a light–dark cycle (Zubidat, Nelson, & Haim, 2009; Zubidat, Nelson, & Haim, 2010). In the case that animal facility staff desire increased ambient or select spectral lighting within a cage, a controlled light source could easily be integrated in the SCORHE side assemblies and synchronized to the room’s ambient light or operated independently (e.g., for circadian disruption studies).
The SCORHE NIR illumination setup results in a visually bright image background that offers significant contrast with dark-colored mice. The software methods described in this article were limited to processing video of black mice. Modifications to the existing SCORHE hardware setup and/or software algorithms have been initiated to enable automated video processing of white mice. Transitioning to the use of visually darker bedding material might be sufficient, since currently the cage-floor region provides the least contrast with white mice.
SCORHE could be utilized in studies involving animal model characterization (Abuhatzira et al., 2011; Portal, Riess, & Nguyen, 2013), behavioral and activity profiling (Krashes et al., 2011; Kravitz et al., 2010), circadian and sleep pattern monitoring (Kelly & Bianchi, 2012), and therapeutic trials (Kumar, Vashist, Kumar, Kalonia, & Mishra, 2012). Such studies have traditionally relied on measures obtained by open-field assays, photobeam detector-based systems, and running wheels. SCORHE could yield more detailed and comprehensive measures while avoiding unwanted alterations to behavior caused by the aforementioned traditional tests or test environments (Novak, Burghardt, & Levine, 2012; Schaefer & Claridge-Chang, 2012).
Fig. 13.

Dimension drawings of the SCORHE unit. a SCORHE unit in rack, with components color-coded for clarity. b Top view of the SCORHE unit out of the rack. c Front view of the SCORHE unit in rack. The shelf rail on which cages are suspended while in the rack is shown in more detail. d Side view of the SCORHE unit in the rack. Measurements of all color-coded elements are also included.
Table 1.
Home-cage video monitoring systems
| System Company/ Institution |
Custom Cage |
Ventilated Rack |
Lighting | Camera Position |
Size Ratio |
|---|---|---|---|---|---|
| Home Cage Environment |
No | No | White/ NIR |
Side | 5.6 |
| CleverSys Inc | |||||
| GroupScan Environment |
Yes | No | White/ NIR |
Side and top |
6.5 |
| CleverSys Inc | |||||
| PhenoRack | No | No | NIR | Side | 7.2 |
| ViewPoint Life Sciences |
|||||
| PhenoTyper | Yes | No | NIR | Top | 2.7 |
| Noldus Information Technology |
|||||
| ANY-maze Cage Stoelting Co |
Yes | No | White/ NIR |
Top | 10.4 |
| Video Home Cage Med Associates |
Yes | No | NIR | Top | 8.0 |
| SCORHE National Institutes of Health |
No | Yes | NIR | Front and rear |
1.5 |
The size ratio is the ratio of volume of the smallest box that would enclose the monitoring system to the volume of the smallest box enclosing the cage. The volume calculation is the product of the width, length, and height outside dimensions. If a system can accommodate multiple cage sizes, the ratio is based on a cage with comparable dimensions to the cage compatible with SCORHE. A small ratio is indicative of a space-efficient system design
Acknowledgments
The authors wish to thank Cumhur Demirkale for his assistance with the statistical analysis. G.H.S. wishes to thank Kristin Branson and Lex Kravitz for helpful discussions and input.
Appendix.
Contributor Information
Ghadi H. Salem, Division of Computational Bioscience, Center for Information Technology, National Institutes of Health, 12 South Drive, Building 12A Room 2025, Bethesda, MD 20892, USA, salem@exchange.nih.gov
John U. Dennis, Laboratory Animal Science Program, SAIC-Frederick, Bethesda, MD, USA
Jonathan Krynitsky, Division of Computational Bioscience, Center for Information Technology, National Institutes of Health, 12 South Drive, Building 12A Room 2025, Bethesda, MD 20892, USA.
Marcial Garmendia-Cedillos, Division of Computational Bioscience, Center for Information Technology, National Institutes of Health, 12 South Drive, Building 12A Room 2025, Bethesda, MD 20892, USA.
Kanchan Swaroop, Division of Computational Bioscience, Center for Information Technology, National Institutes of Health, 12 South Drive, Building 12A Room 2025, Bethesda, MD 20892, USA.
James D. Malley, Division of Computational Bioscience, Center for Information Technology, National Institutes of Health, 12 South Drive, Building 12A Room 2025, Bethesda, MD 20892, USA
Sinisa Pajevic, Division of Computational Bioscience, Center for Information Technology, National Institutes of Health, 12 South Drive, Building 12A Room 2025, Bethesda, MD 20892, USA.
Liron Abuhatzira, Laboratory of Metabolism, Center for Cancer Research, National Cancer Institute, National Institutes of Health, Bethesda, MD, USA.
Michael Bustin, Laboratory of Metabolism, Center for Cancer Research, National Cancer Institute, National Institutes of Health, Bethesda, MD, USA.
Jean-Pierre Gillet, Laboratory of Cell Biology, Center for Cancer Research, National Cancer Institute, National Institutes of Health, Bethesda, MD, USA.
Michael M. Gottesman, Laboratory of Cell Biology, Center for Cancer Research, National Cancer Institute, National Institutes of Health, Bethesda, MD, USA
James B. Mitchell, Radiation Biology Branch, Center for Cancer Research, National Cancer Institute, National Institutes of Health, Bethesda, MD, USA
Thomas J. Pohida, Division of Computational Bioscience, Center for Information Technology, National Institutes of Health, 12 South Drive, Building 12A Room 2025, Bethesda, MD 20892, USA
References
- Abuhatzira L, Shamir A, Schones DE, Schäffer AA, Bustin M. The chromatin-binding protein hmgn1 regulates the expression of methyl CpG-binding protein 2 (MECP2) and affects the behavior of mice. Journal of Biological Chemistry. 2011;286:42051–42062. doi: 10.1074/jbc.M111.300541. doi:10.1074/jbc.M111.300541. [DOI] [PMC free article] [PubMed] [Google Scholar]
- Baker M. Animal models: Inside the minds of mice and men. Nature. 2011;475:123–128. doi: 10.1038/475123a. doi:10.1038/475123a. [DOI] [PubMed] [Google Scholar]
- Branson K. Tracking multiple mice through severe occlusions. University of California; San Diego, La Jolla, CA: 2007. Unpublished Ph.D. dissertation. [Google Scholar]
- Branson K, Belongie S. Paper presented at the Computer Vision and Pattern Recognition Conference (CVPR 2005) San Diego, CA: Jun, 2005. Tracking multiple mouse contours (without too many samples) [Google Scholar]
- Chu ER, Kim EK, Gonzalez JM, Ko MH, Liew EC, Tan JCH. Intraocular pressure measurement in acepromazine-sedated mice. Clinical & Experimental Ophthalmology. 2014 doi: 10.1111/ceo.12157. doi:10.1111/ceo.12157. [DOI] [PubMed] [Google Scholar]
- de Chaumont F, Coura RD, Serreau P, Cressant A, Chabout J, Granon S, Olivo-Marin JC. Computerized video analysis of social interactions in mice. Nature Methods. 2012;9:410–417. doi: 10.1038/nmeth.1924. doi:10.1038/nmeth.1924. [DOI] [PubMed] [Google Scholar]
- Edelman N. Automated phenotyping of mouse social behavior. Massachusetts Institute of Technology; Cambridge, MA: Sep, 2011. Unpublished Master's thesis. [Google Scholar]
- Farah R, Langlois JMP, Bilodeau G. Catching a rat by its edglets. IEEE Transactions on Image Processing. 2012;22:668–678. doi: 10.1109/TIP.2012.2221726. doi: 10.1109/tip.2012.2221726. [DOI] [PubMed] [Google Scholar]
- Forsyth D, Ponce J. Computer vision: A modern approach. Upper Saddle River; Prentice Hall: 2003. [Google Scholar]
- Gillet J-P, Gottesman MM. Unpublished data. National Institutes of Health; Bethesda, MD: 2011. [Google Scholar]
- Goulding EH, Schenk AK, Juneja P, MacKay AW, Wade JM, Tecott LH. A robust automated system elucidates mouse home cage behavioral structure. Proceedings of the National Academy of Sciences. 2008;105:20575–20582. doi: 10.1073/pnas.0809053106. doi:10.1073/pnas.0809053106. [DOI] [PMC free article] [PubMed] [Google Scholar]
- Jhuang H, Garrote E, Yu X, Khilnani V, Poggio T, Steele AD, Serre T. Automated home-cage behavioural phenotyping of mice. Nature Communications. 2010;1:68. doi: 10.1038/ncomms1064. doi:10. 1038/ncomms1064. [DOI] [PubMed] [Google Scholar]
- Kelly J, Bianchi M. Mammalian sleep genetics. Neurogenetics. 2012;13:287–326. doi: 10.1007/s10048-012-0341-x. doi:10.1007/s10048-012-0341-x. [DOI] [PubMed] [Google Scholar]
- Krashes MJ, Koda S, Ye C, Rogan SC, Adams AC, Cusher DS, Lowell BB. Rapid, reversible activation of AgRP neurons drives feeding behavior in mice. Journal of Clinical Investigation. 2011;121:1424–1428. doi: 10.1172/JCI46229. doi:10.1172/jci46229. [DOI] [PMC free article] [PubMed] [Google Scholar]
- Kravitz AV, Freeze BS, Parker PRL, Kay K, Thwin MT, Deisseroth K, Kreitzer AC. Regulation of parkinsonian motor behaviours by optogenetic control of basal ganglia circuitry. Nature. 2010;466:622–626. doi: 10.1038/nature09159. doi:10.1038/nature09159. [DOI] [PMC free article] [PubMed] [Google Scholar]
- Kumar A, Vashist A, Kumar P, Kalonia H, Mishra J. Potential role of licofelone, minocycline and their combination against chronic fatigue stress induced behavioral, biochemical and mitochondrial alterations in mice. Pharmacological Reports. 2012;64:1105–1115. doi: 10.1016/s1734-1140(12)70907-6. [DOI] [PubMed] [Google Scholar]
- Malley JD, Malley KG, Pajevic S. Statistical learning for biomedical data. Cambridge University Press; Cambridge, UK: 2011. [Google Scholar]
- Noldus LPJJ, Spink AJ, Tegelenbosch RAJ. EthoVision: A versatile video tracking system for automation of behavioral experiments. Behavior Research Methods, Instruments, & Computers. 2001;33:398–414. doi: 10.3758/bf03195394. doi:10.3758/BF03195394. [DOI] [PubMed] [Google Scholar]
- Novak CM, Burghardt PR, Levine JA. The use of a running wheel to measure activity in rodents: Relationship to energy balance, general activity, and reward. Neuroscience & Biobehavioral Reviews. 2012;36:1001–1014. doi: 10.1016/j.neubiorev.2011.12.012. doi:10.1016/j.neubiorev.2011.12.012. [DOI] [PMC free article] [PubMed] [Google Scholar]
- Ohayon S, Avni O, Taylor AL, Perona P, Roian Egnor SE. Automated multi-day tracking of marked mice for the analysis of social behaviour. Journal of Neuroscience Methods. 2013;219:10–19. doi: 10.1016/j.jneumeth.2013.05.013. doi:10.1016/j.jneumeth.2013.05.013. [DOI] [PMC free article] [PubMed] [Google Scholar]
- Portal E, Riess O, Nguyen HP. Automated home cage assessment shows behavioral changes in a transgenic mouse model of spinocerebellar ataxia type 17. Behavioural Brain Research. 2013;250:157–165. doi: 10.1016/j.bbr.2013.04.042. doi:10.1016/j.bbr.2013.04.042. [DOI] [PubMed] [Google Scholar]
- Schaefer AT, Claridge-Chang A. The surveillance state of behavioral automation. Current Opinion in Neurobiology. 2012;22:170–176. doi: 10.1016/j.conb.2011.11.004. doi:10.1016/j.conb.2011.11.004. [DOI] [PMC free article] [PubMed] [Google Scholar]
- Spruijt BM, DeVisser L. Advanced behavioural screening: Automated home cage ethology. Drug Discovery Today: Technologies. 2006;3:231–237. doi: 10.1016/j.ddtec.2006.06.010. doi:10.1016/j.ddtec.2006.06.010. [DOI] [PubMed] [Google Scholar]
- Steele AD, Jackson WS, King OD, Lindquist S. The power of automated high-resolution behavior analysis revealed by its application to mouse models of Huntington’s and prion diseases. Proceedings of the National Academy of Sciences. 2007;104:1983–1988. doi: 10.1073/pnas.0610779104. doi:10.1073/pnas.0610779104. [DOI] [PMC free article] [PubMed] [Google Scholar]
- Weissbrod A, Shapiro A, Vasserman G, Edry L, Dayan M, Yitzhaky A, Kimchi T. Automated long-term tracking and social behavioural phenotyping of animal colonies within a semi-natural environment. Nature Communications, 4, 2018. 2013 doi: 10.1038/ncomms3018. doi: 10.1038/ncomms3018. [DOI] [PubMed] [Google Scholar]
- Zarringhalam K, Ka MH, Kook YH, Terranova JI, Suh Y, King OD, Um M. An open system for automatic home-cage behavioral analysis and its application to male and female mouse models of Huntington’s disease. Behavioural Brain Research. 2012;229:216–225. doi: 10.1016/j.bbr.2012.01.015. doi:10.1016/j.bbr.2012.01.015. [DOI] [PubMed] [Google Scholar]
- Zubidat AE, Nelson RJ, Haim A. Photosensitivity to different light intensities in blind and sighted rodents. Journal of Experimental Biology. 2009;212:3857–3864. doi: 10.1242/jeb.033969. doi:10. 1242/jeb.033969. [DOI] [PubMed] [Google Scholar]
- Zubidat AE, Nelson RJ, Haim A. Photoentrainment in blind and sighted rodent species: responses to photophase light with different wavelengths. The Journal of Experimental Biology. 2010;213:4213–4222. doi: 10.1242/jeb.048629. doi:10.1242/jeb.048629. [DOI] [PubMed] [Google Scholar]
- Zurn JB, Hohmann D, Dworkin SI, Motai Y. A real-time rodent tracking system for both light and dark cycle behavior analysis. Paper presented at the Seventh IEEE Workshop on Application of Computer Vision (WACV/MOTIONS’05), Breckenridge, CO. 2005 Jan; [Google Scholar]
- Zurn JB, Xianhua J, Motai Y. Paper presented at the IEEE Instrumentation a nd Measurement Technology Conference (IMTC 2005) Ottawa, ON, Canada: May, 2005. Video-based rodent activity measurement using near-infrared illumination. [Google Scholar]