Fig. 1.
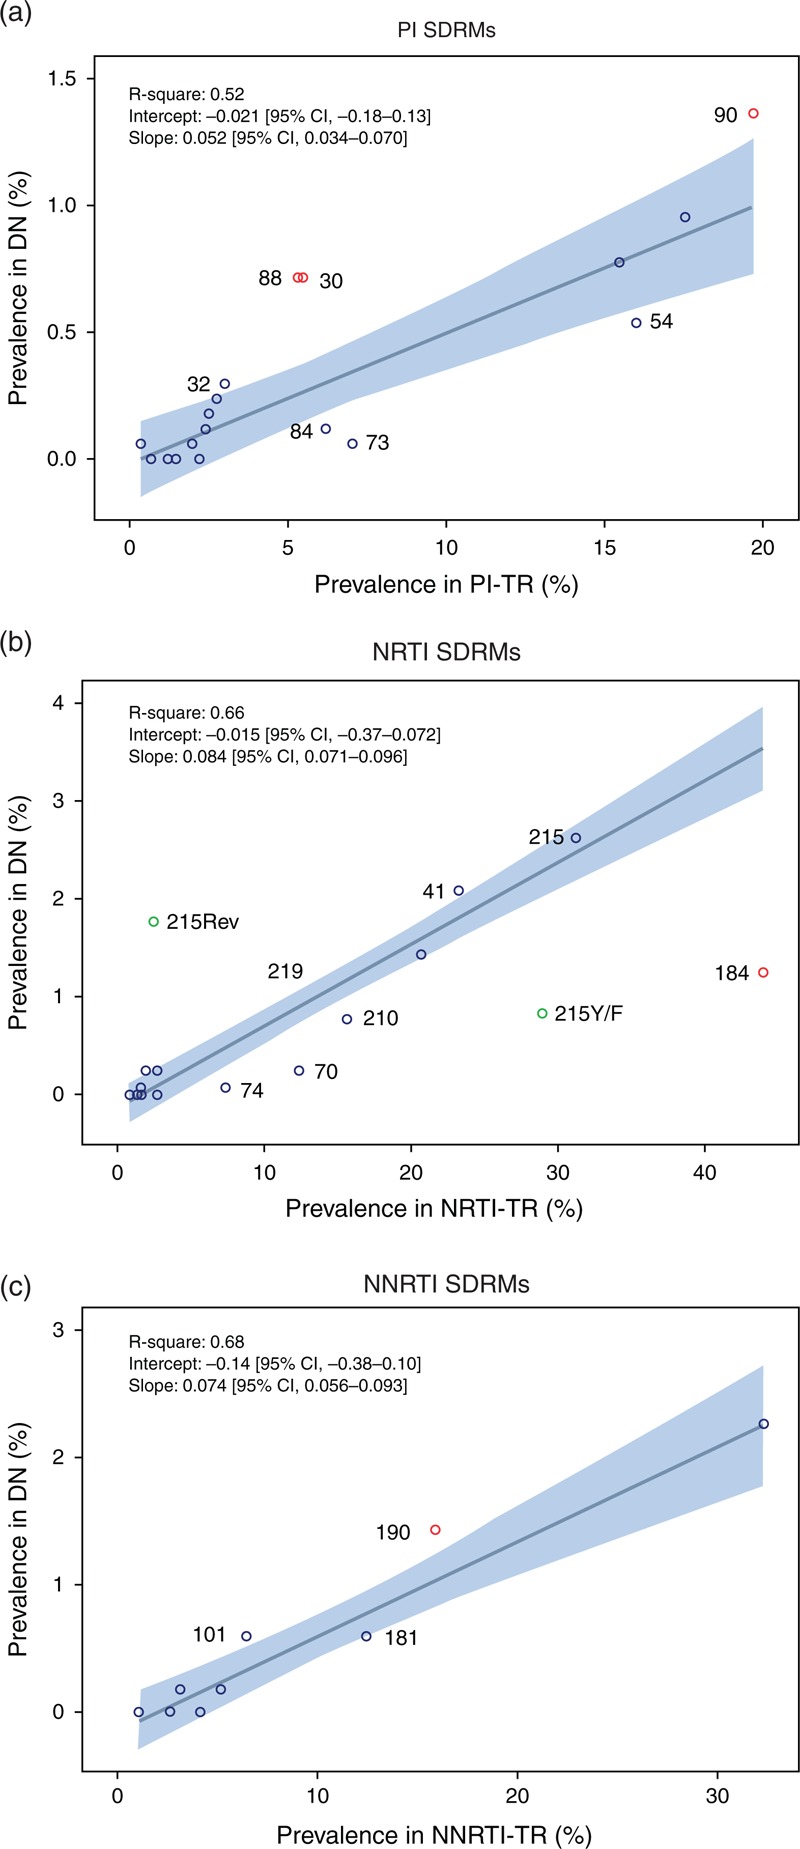
Robust regression model for the Portuguese cohort, relating prevalence of SDRMs (codon position) in treatment-failing patients per drug class versus prevalence of SDRMs in drug-naive patients.

The linear regression line is shown together with the 95% CI, slope, intercept and R2. SDRMs above or below the 95% CI are labeled with codon position; robust outliers (see Table S1, ) are shown as red circles. (a) Prevalence of each protease inhibitor SDRM in protease inhibitor-treatment-failing patients [i.e. (#protease inhibitor SDRMs in protease inhibitor-treatment-failing patients)/# protease inhibitor-treatment-failing patients, see Table 1] versus prevalence of each protease inhibitor SDRM in drug-naive patients i.e. (#protease inhibitor SDRMs in drug-naive)/# drug-naive patients. (b) Prevalence of each NRTI SDRM in NRTI-treatment-failing patients versus prevalence of each NRTI SDRM in drug-naive patients. T215Y/F and T215Rev are shown in green but were taken together (T215) for the linear regression. (c) Prevalence of each NNRTI SDRM in NNRTI-treatment-failing patients versus prevalence of each NNRTI SDRM in drug-naive patients. CI, confidence interval; DN, drug-naive individuals; NNRTI, nonnucleoside reverse transcriptase inhibitors; NNRTI-TR, patients failing a NNRTI-containing treatment; NRTI, nucleoside reverse transcriptase inhibitors; NRTI-TR, patients failing a NRTI-containing treatment; SDRM, surveillance drug resistance mutations; PI, protease inhibitor; PI-TR, patients failing a PI-containing treatment.
