Abstract
Different nosocomial pathogen species have varying infectivity and durations of infectiousness, while the transmission route determines the contact rate between pathogens and susceptible patients. To determine if the pathogen species and transmission route affects the size and spread of outbreaks, we perform a meta-analysis that examines data from 933 outbreaks of hospital-acquired infection representing 14 pathogen species and 8 transmission routes. We find that the mean number of cases in an outbreak is best predicted by the pathogen species and the mean number of cases per day is best predicted by the species-transmission route combination. Our fitted model predicts the largest mean number of cases for Salmonella outbreaks (22.3) and the smallest mean number of cases for Streptococci outbreaks (8.5). The largest mean number of cases per day occurs during Salmonella outbreaks spread via the environment (0.33) and the smallest occurs for Legionella outbreaks spread by multiple transmission routes (0.005). When combined with information on the frequency of outbreaks these findings could inform the design of infection control policies in hospitals.
Introduction
In 2007, a survey of intensive care units found that the majority of patients were affected by hospital-acquired infections [1]. While hospital-acquired infections are prevalent, different pathogen species are more common and more easily spread [1–4]. For infectious diseases, the transmission rate is affected by characteristics of the pathogen [5], the environment [6,7] and susceptible [1,8,9] and infected patients [10]. Our analysis examines the affect of the pathogen species and the transmission route on the size and spread of nosocomial outbreaks.
We chose to investigate the effect of the pathogen species on outbreak size and spread because different pathogen species have different infectivity, durations of host colonization and survivorship rates on surfaces and equipment. The single admission reproduction number, RA, is “the average number of secondary cases caused by one primary case when other patients are susceptible during a single hospital admission of the primary case” [11]. Estimated values of RA for different strains of methicillin-resistant Staphylococcus aureus range from 0.07 to 0.93 [12–15] and for different strains of Acinetobacter baumanii range from 0.014 to 0.81 [16]. The basic reproductive ratio, R0, is “the expected number of secondary cases produced, in a completely susceptible population, by a typical infected individual during its entire period of infectiousness” [17]. For hospital-acquired pathogens, the definitions of RA and R0 differ because a colonized patient may be discharged and readmitted while still infectious. The estimated value of R0 for vancomycin-resistant enterococci (VRE) is 3.81 [18], and for Clostridium difficile is 1.04 [19]. This variation in RA and R0 for different pathogen species suggests differences in the spread rates, but in addition to the pathogen strain and species these differences are likely due to the type and geographic location of the health care institution, the infection control measures that were implemented, and the models and parameter estimation methods that were used.
We also focus on the different transmission routes of an outbreak. Many of the pathogen species that cause nosocomial outbreaks may be spread by at least four different transmission routes [4]. Most frequently, hospital-acquired infections are spread between patients or from hospital personnel to patients [4]. Potentially, the transmission route of an infection could affect the size and the spread rate of an outbreak. As an example, if a contaminated piece of equipment is used infrequently, an outbreak spread by equipment might spread more slowly than an outbreak spread by healthcare workers. During a single outbreak, multiple transmission routes may spread the infection. Theoretical analysis shows that when outbreaks are spread by multiple transmission routes the total number of cases (i.e., the ‘final size’ of the outbreak) is either increased or decreased relative to spread by only one of the transmission routes [20].
Infection control priorities could be based on the relative importance of the different transmission routes [21]. The control of large or rapidly spreading outbreaks due to a particular pathogen species might also be prioritized. We analyze published data describing outbreaks of hospital-acquired infection due to 14 different pathogen species spread through 8 possible transmission routes to determine the effect on the total number of cases and the mean number of cases per day.
Materials and Methods
Data collection
We compiled data from 1436 nosocomial outbreaks of hospital-acquired infections recorded in the published academic literature using the Worldwide Database for Nosocomial Infections (WDNI; http://www.outbreak-database.com). The recorded outbreaks occurred from 1956 to 2011. Of these outbreaks, only ones with reported transmission routes could be used for our analysis (n = 933). We considered outbreaks due to one of 14 different pathogens: Acinetobacter sp. (Acin; n = 102), Clostridium difficile (C. diff; n = 15), Enterobacter (Enterob; n = 46), Enterococcus sp. (Enteroc; n = 53), Escherichia coli (E. coli; n = 39), Hepatitis B virus (Hep. B; n = 85), Hepatitis C virus (Hep. C; n = 85), Legionella sp. (Legion; n = 55), Klebsiella sp. (Klebs; n = 79), Pseudomonas sp. (Pseudo; n = 144), Serratia sp. (Serr; n = 116), Salmonella sp. (Salm; n = 78), Staphylococcus aureus (Staph; n = 268) and Streptococcus sp. (Strep; n = 87). These pathogen species were chosen because they frequently cause outbreaks in hospitals and intensive care units worldwide [1] and because for most of these pathogen species, the frequency of outbreaks occurring via each transmission route has been previously studied [4]. For our data analysis, we only considered outbreaks with a single species listed in the ‘Microorganisms’ category of the WDNI.
The transmission routes for the recorded nosocomial outbreaks were air (n = 13), environment (env; n = 164), equipment (equip; including drugs or biologics; n = 267), food (n = 30), healthcare workers (HCW; n = 296), insect (n = 1), patient-to-patient (PTP; n = 42), or multiple (multi; n = 120), if transmission occurred through more than one route. Full details of the number of observations for each transmission route and pathogen species combination are summarized in Table 1. The designation of a particular transmission route was made if there was a strong statement describing how the infection had spread in the categories ‘Sources’ or ‘Transmission’ of the WDNI or in the abstract of the published record. The difference between the environment and the equipment transmission routes was defined by whether the contaminated article was immovable (environment) or not (equipment).
Table 1. The number of observed outbreaks for each transmission route and pathogen species.
In total there are 69 different observed combinations of pathogen species and transmission routes.
| Transmission route | |||||||||
|---|---|---|---|---|---|---|---|---|---|
| Species | air | env | equip | food | HCW | insect | PTP | multi | Total |
| Acin | 20 | 33 | 11 | 7 | 31 | 102 | |||
| C. diff | 1 | 3 | 4 | 3 | 4 | 15 | |||
| Enterob | 6 | 24 | 3 | 6 | 2 | 5 | 46 | ||
| Enteroc | 20 | 4 | 22 | 6 | 52 | ||||
| E. coli | 1 | 6 | 10 | 6 | 2 | 25 | |||
| Hep B | 32 | 19 | 5 | 12 | 68 | ||||
| Hep C | 4 | 48 | 11 | 5 | 5 | 73 | |||
| Klebs | 5 | 18 | 1 | 14 | 1 | 3 | 42 | ||
| Legion | 50 | 1 | 51 | ||||||
| Pseudo | 30 | 48 | 21 | 9 | 108 | ||||
| Salm | 5 | 2 | 19 | 11 | 7 | 13 | 57 | ||
| Staph | 4 | 10 | 9 | 119 | 11 | 153 | |||
| Strep | 8 | 6 | 5 | 1 | 28 | 7 | 2 | 57 | |
| Serr | 1 | 6 | 41 | 20 | 16 | 84 | |||
| Total | 13 | 164 | 267 | 30 | 296 | 1 | 42 | 120 | 933 |
Our database recorded whether molecular evidence supported the suspicion of a particular transmission route (i.e., the outbreak strain was also found on healthcare workers, equipment or surfaces); however, too few outbreaks had transmission routes confirmed by molecular data (n = 626) for this to be included as a variable in the statistical analysis. For each outbreak, the duration was assumed to be inclusive of the starting and ending months as indicated by the WDNI. Duplicate records and records where the number of cases or the duration was not known were excluded from our analysis. The complete dataset used for our analysis is provided as Supporting Information (S1 Dataset).
Analyzing the outbreak data
Our statistical analysis tests for differences in the number of cases (CASES) or the mean number of cases per day during an outbreak (the case rate, RATE) due to different pathogen species (SPECIES) and/or transmission routes (TR). The rationale for these choices of response variables (CASES and RATE) is that infection control experts may wish to prioritize the prevention of outbreaks that lead to a large number of cases or that lead to large outbreaks occurring over a small amount of time. The predictor variables are SPECIES, TR and SPECIES×TR.
Our analysis considers 8 models (Table 2) and uses an information theoretic model selection framework to identify the best model(s). Four of our models have CASES and 4 have RATE as the response variable. For each response variable, the models we consider are: constant only, transmission route or pathogen species as a predictor variable, and an interaction model that has specific combinations of transmission routes and pathogen species as the predictor variable. We chose to use an information theoretic framework because we wish to identify the best model(s) from within a set of 4 models, rather than to determine whether specific models are distinguishable from a null hypothesis. All of our models are linear with normally distributed deviations. The predictor variables are coded as 1 if the transmission route and/or pathogen species for an outbreak is equal to i or j (see Table 1) or 0 otherwise. The distributions of the response variables are both skewed right. We took the natural logarithm of each response variable so that the residuals of our fitted models satisfied our assumption that they were normally distributed.
Table 2. The statistical models.
The symbols μ and σ 2 denote the mean and the variance of the normal distribution. In this notation a, b i, b ij and σ 2 are general model parameters that will take different values for the fitted models.
| Model | Formula |
|---|---|
| Constant—Cases | log CASES ~ Normal(μ = a; σ2) |
| Transmission—Cases | log CASES ~ Normal(μ = Σ b i TRi; σ2) |
| Species—Cases | log CASES ~ Normal(μ = Σ b i SPECIESi; σ2) |
| Interaction—Cases | log CASES ~ Normal(μ = Σ b ij SPECIES × TRij; σ2) |
| Constant—Rate | log RATE ~ Normal(μ = a; σ2) |
| Transmission—Rate | log RATE ~ Normal(μ = Σ b i TRi; σ2), |
| Species—Rate | log RATE ~ Normal(μ = Σ b i SPECIESi; σ2), |
| Interaction—Rate | log RATE ~ Normal(μ = Σ b ij SPECIES × TRij; σ2), |
We use the Akaike Information Criteria (AIC) to identify whether the models differ in the ability of their predictor variables to explain the responses. The ΔAIC values were calculated as the difference between a particular model AIC and the lowest AIC from amongst the 4 model set. The ΔAIC values are interpreted as “the models are no different” (ΔAIC < 2), “the models are clearly distinguishable” (4 < ΔAIC < 7) or “the models are definitely different” (ΔAIC > 10, Bolker [22], pp. 210). Having identified the model(s) that best describe the data, we estimate the 95% confidence intervals on the estimated parameters using the maximum likelihood profile. We identify model coefficients that are significantly different from zero at the α = 0.05 level. The significance test assumes that the model coefficients are sampled from a normal distribution. The model analysis was implemented in R (The R Foundation for Statistical Computing, 2013; version 3.02 “Frisbee Sailing”) using the mle2 function from the bbmle package. The code used for this analysis available as Supporting Information (S1 Code).
Results
Does the transmission route and/or the pathogen species affect the size and/or rate of spread of the outbreak?
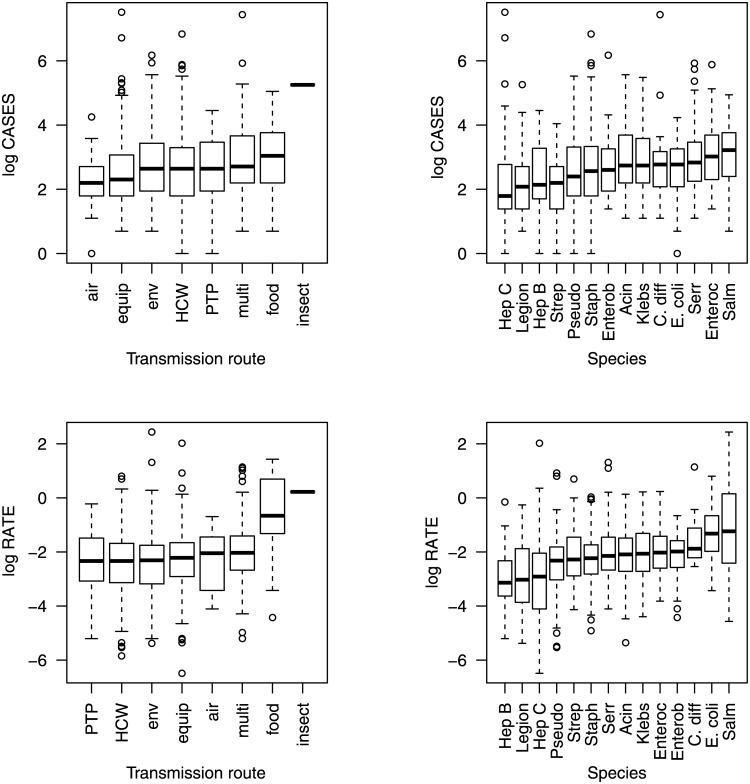
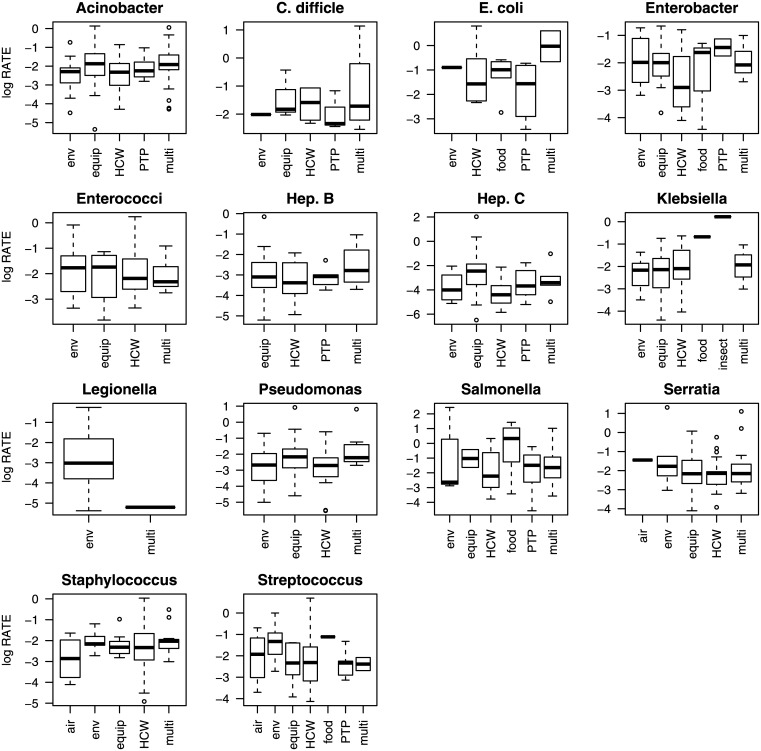
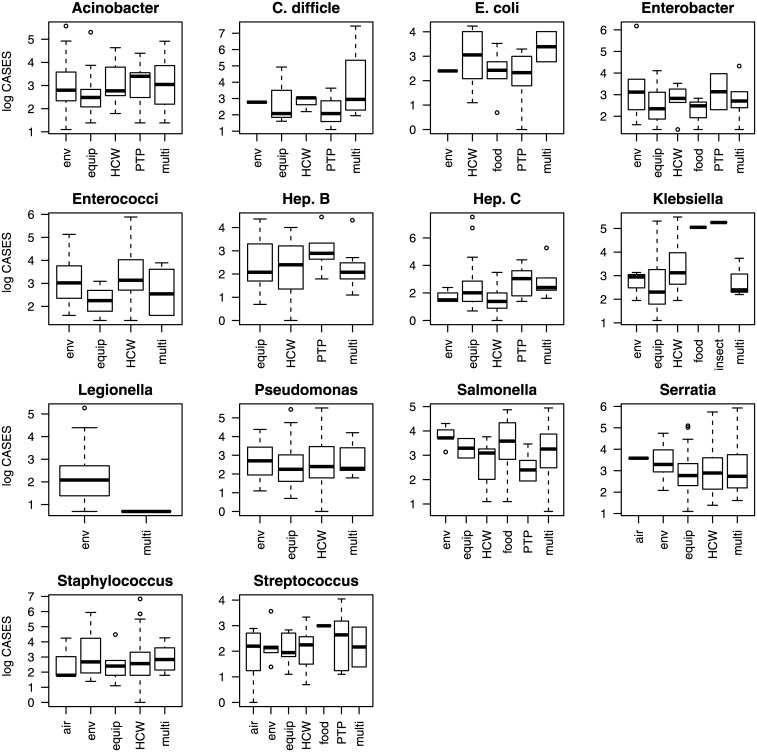
The relationship between the transmission route, the pathogen species, and specific combinations of transmission routes and pathogen species on the natural logarithm of the number of cases and on the natural logarithm of the case rate is shown in Figs 1–3. Figs 1–3 show a large amount of overlap in the interquartile ranges of the number of cases and the case rate suggesting that a large amount of the variance around the means of the response variables is not explained by the predictor variables.
Fig 1. Boxplots showing the natural logarithm of the number of cases and the case rate.
The solid lines denote the mean, the boxes represent the interquartile range, the whiskers are 1.5 times the interquartile range, and the open circles are outliers.
Fig 3. A boxplot showing the natural logarithm of the case rate for different pathogen species.
The solid lines denote the mean, the boxes represent the interquartile range, the whiskers are 1.5 times the interquartile range, and the open circles are outliers. The coefficients estimated for the Interaction—Rate model are shown in Fig 5 (lower panel).
Fig 2. A boxplot showing the natural logarithm of the number of cases for different pathogen species.
The solid lines denote the mean, the boxes represent the interquartile range, the whiskers are 1.5 times the interquartile range, and the open circles are outliers. All the coefficients for the Interaction—Cases model are significantly different from zero (α = 0.05).
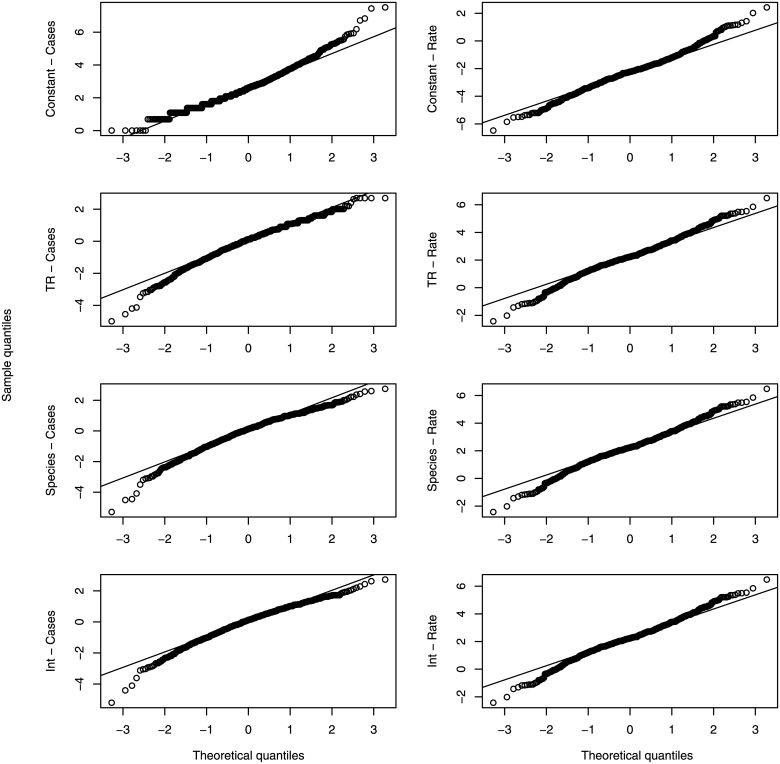
The model where the pathogen species predicts the number of cases (Species—Cases) had the lowest AIC score (Table 3). The ΔAIC for all the other models with CASES as a response variable was greater than 10. The interpretation of this result is that pathogen species is the best predictor of the number of cases in an outbreak, with no other models performing as well. The model with an interaction between the transmission route and the pathogen species improved the model fit, but also introduced numerous parameters resulting in a low AIC score. For the set of models with the case rate as the response variable, the Interaction—Rate model had the lowest AIC score, and the only model with a ΔAIC < 10 was the Species—Rate model (ΔAIC = 5.6, Table 3). A Q-Q plot was used to visualize the comparison between the quantiles of a normal distribution and the quantiles of the model residuals (Fig 4). Fig 4 shows that the assumption of normality of the model residuals is satisfied for all models.
Table 3. The AIC values for each model.
For a description of the different models see Table 2.
| Model | Negative log likelihood | Number of Parameters | AIC | ΔAIC | AIC weights |
|---|---|---|---|---|---|
| Constant—Cases | 1431.65 | 1 | 2865.3 | 64.7 | <0.001 |
| Transmission—Cases | 1417.76 | 8 | 2851.5 | 50.9 | <0.001 |
| Species—Cases | 1386.29 | 13 | 2800.6 | 0.0 | 1.00 |
| Interaction—Cases | 1352.99 | 69 | 2844.0 | 43.4 | <0.001 |
| Constant—Rate | 1531.21 | 1 | 3064.4 | 204.8 | <0.001 |
| Transmission—Rate | 1480.98 | 8 | 2978.0 | 118.3 | <0.001 |
| Species—Rate | 1418.61 | 13 | 2865.2 | 5.6 | 0.05 |
| Interaction—Rate | 1360.81 | 69 | 2859.6 | 0.0 | 0.95 |
Fig 4. QQ-plots for the natural logarithm of the number of cases and the case rate.
The theoretical quantiles are given by a normal distribution. This figure shows good agreement between the data and the assumption that model deviations are normally distributed.
Which species result in the largest outbreaks?
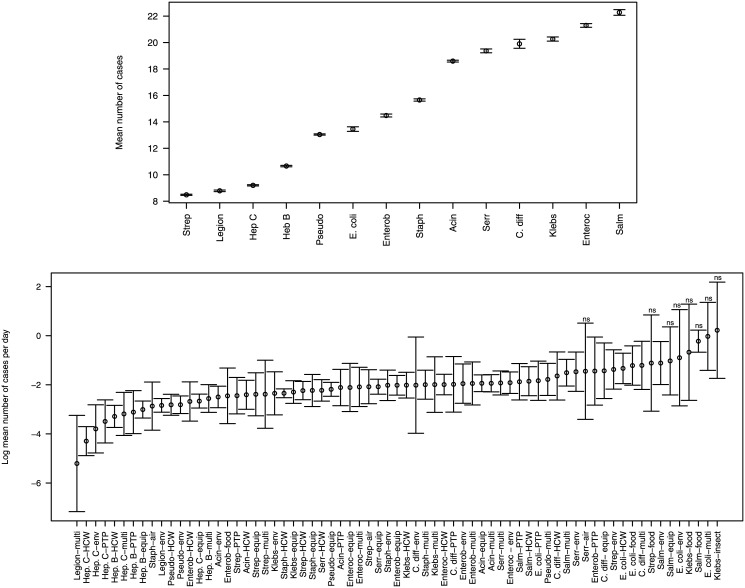
For the ‘Species—Cases’ model, the 95% confidence intervals for the exponentiated fitted parameter estimates are shown in Fig 5 (upper panel). The parameter estimates were exponentiated so that the fitted values could be interpreted as the predicted mean number of cases. Fig 5 shows that the confidence intervals on the predicted mean number of cases for each pathogen species are small. For our fitted model, hospital-acquired infections due to Streptococcus infections generated the fewest predicted mean number of cases (8.5) while Salmonella infections generated the largest predicted mean number of cases (22.3). These Salmonella outbreaks were atypical since food was their most common transmission route and food was rarely a transmission route for the other hospital-acquired pathogens (Table 1). Outbreaks of Enterococcus sp. caused the second largest number of infections—still more than twice as many as Streptococcus sp. and these outbreaks of Enterococci were spread primarily through the healthcare worker and the environmental transmission routes, transmission routes that were common to many of the other pathogen species.
Fig 5. Exponentiated fitted parameter values (circles) and 95% confidence intervals (bars).
In the upper panel, the parameter estimates were exponentiated so that the parameter values correspond to the predicted mean number of cases. Models have parameters b i (see Table 2) where i is an index corresponding to a particular pathogen species or transmission route or b ij where ij is an index for a particular transmission route, i, and species, j, combination. In the lower panel, transmission route-species combinations where the model coefficients are not significantly different from zero are indicated with ‘ns’ (α = 0.05).
Which transmission route-species combinations result in the fastest spreading outbreaks?
For the ‘Interaction—Rate’ model, the 95% confidence intervals for the fitted parameter estimates are shown in Fig 5 (lower panel). For this model, the coefficients were not exponentiated for clearer visualization of large and small case rate values. For several of the transmission route-species combinations that had large case rates and small sample sizes, the estimated model coefficients were not significantly different from zero (Fig 5). Of the estimated model coefficients that were significant, the largest predicted mean number of cases per day was for Salmonella spread via the environment (0.33), C. difficile spread via multiple routes (0.30), and E. coli spread via food (0.30). The smallest predicted mean number of cases per day was for Legionella spread through multiple routes (0.005) and Hepatitis C spread through healthcare workers (0.014), the environment (0.022), and person-to-person spread (0.030).
Discussion
The prevention and control of hospital-acquired infections is a top priority for healthcare institutions [23] and a better understanding of pathogen transmission routes would be beneficial; particularly as infection control strategies could be based on the relative importance of the different transmission routes [21]. Alternatively, prioritization might focus on a particular pathogen species. We found that if preventing large outbreaks is a priority for an infection control strategy, then particular pathogen species should be prioritized from right to left as shown on the horizontal axis of Fig 5 (upper panel). If preventing large outbreaks that occur during a small amount of time is a priority, then particular transmission route-species combinations should be prioritized in order from right to left of Fig 5 (lower panel).
Minimizing the number of cases and the number of cases per day during an outbreak should not be the sole priorities of infection control policies. In particular, the frequency of outbreaks due to particular pathogens and transmission routes is relevant. From Gastmeier et al. [4], the percentage of nosocomial outbreaks caused by different pathogen species is unequal (χ11 2 = 514.6, p < 0.001). Most often, outbreaks were due to Staphylococcus sp. and Staphylococcus outbreaks occurred nearly twice as often as other outbreaks. The conclusions that can be drawn from our data are the same (Table 1; S1 Code). Other published studies consider the point prevalence of different pathogen species in intensive care units [1], the number of cases in intensive care units [8] and the number of cases of bloodstream infections [2] caused by different pathogen species. These studies also find that Staphylococcus sp. infections are most common, although in the intensive care unit Pseudomonas infections are nearly as common [1,8]. These findings may be a reason to prioritize the prevention of Staphylococcus outbreaks, although the severity of the disease, the cost and effectiveness of potential infection control measures, and institution specific surveillance are other factors that should be considered when devising an optimal infection control strategy.
Limitations of our data analysis are potentially misidentified transmission routes, publication biases, possible inconsistencies in how an epidemic is defined, and a large amount of unexplained variation. Quantifying the number and magnitude of the transmission routes that contribute to an outbreak is challenging [24]. In our dataset outbreaks that were designated as having been spread by one transmission route may have actually been spread through multiple transmission routes, where the additional transmission routes were not identified. We designated an outbreak as having occurred through a particular transmission route if there was “a strong statement describing how the infection had spread” in the WDNI or in the abstract of the published record. As such, the evidence to support the designation of a transmission route was of variable quality and potentially could have been based on erroneous designations from the published record. Our analysis of nosocomial outbreaks was based on published accounts of outbreaks, which could be misrepresentative of outbreaks in general. There is a geographic bias in the assembled data since most published outbreaks are from Europe or North America, while hospital-acquired infections occur worldwide [1]. There may be a publication bias if data from large outbreaks are more likely to be submitted for publication. The individual authors of each published report judged when the end of an outbreak occurred. Some reported outbreaks were very long, having lasted more than a year, and a possible inconsistency could arise if other authors would have judged the same outbreak to be several smaller outbreaks. Even our best models failed to explain a large amount of variation in the number of cases. Nosocomial outbreaks are influenced by many factors, but our analysis considered only pathogen species and transmission routes. Other relevant factors, and potential sources of variation, are the type of healthcare institution [6], and whether the patient is intubated, ventilated or has a catheter or central line [8].
Our analysis finds that the pathogen species is the best predictor of the number of cases and the transmission route-species combination is the best predictor of the number of cases per day during an outbreak. These findings will help to inform priorities for infection control strategies.
Supporting Information
(R)
(ZIP)
Acknowledgments
This manuscript was improved by valuable feedback from Ben Cooper and an anonymous reviewer. AH thanks Shawn Leroux for helpful discussions pertaining to statistical methods.
Data Availability
All relevant data are within the paper and its Supporting Information files.
Funding Statement
AH was supported by the Natural Sciences and Engineering Research Council of Canada (NSERC; RGPIN 2014-05413). JW and AH were supported by funding jointly from the Canadian Institutes for Health Research (CIHR) and NSERC (CHRP 446610-13). JH was supported by CIHR, NSERC, the Canada Research Chairs Program (950230720), and the Public Health Agency of Canada. The funders had no role in the study design, data collection and analysis, decision to publish, or preparation of the manuscript.
References
- 1. Vincent JL, Rello J, Marshall J, Silva E, Anzueto A, Martin CD, et al. (2009) International Study of the Prevalence and Outcomes of Infection in Intensive Care Units. Journal of the American Medical Association 302: 2323–2329. 10.1001/jama.2009.1754 [DOI] [PubMed] [Google Scholar]
- 2. Wisplinghoff H, Bischoff T, Tallent SM, Seifert H, Wenzel RP, Edmond MB (2005) Nosocomial bloodstream infections in US hospitals: analysis of 24,179 cases from a prospective nationwide surveillance study. Clinical Infectious Diseases 40: 1077–1077. [DOI] [PubMed] [Google Scholar]
- 3. Kreger BE, Craven DE, Carling PC, McCabe WR (1980) Gram-Negative Bacteremia III. Reassessment of Etiology, Epidemiology and Ecology in 612 Patients. American Journal of Medicine 68: 332–343. [DOI] [PubMed] [Google Scholar]
- 4. Gastmeier P, Stamm-Balderjahn S, Hansen S, Zuschneid I, Sohr D, Behnke M, et al. (2006) Where should one search when confronted with outbreaks of nosocomial infection? American Journal of Infection Control 34: 603–605. [DOI] [PubMed] [Google Scholar]
- 5. Lankford MG, Collins S, Youngberg L, Rooney DM, Warren JR, Noskin GA (2006) Assessment of materials commonly utilized in health care: Implications for bacterial survival and transmission. American Journal of Infection Control 34: 258–263. [DOI] [PubMed] [Google Scholar]
- 6. Richards MJ, Edwards JR, Culver DH, Gaynes RP, NNIS (2000) Nosocomial infections in combined medical-surgical intensive care units in the United States. Infection Control and Hospital Epidemiology 21: 510–515. [DOI] [PubMed] [Google Scholar]
- 7. Ueno T, Masuda N (2008) Controlling nosocomial infection based on structure of hospital social networks. Journal of Theoretical Biology 254: 655–666. 10.1016/j.jtbi.2008.07.001 [DOI] [PMC free article] [PubMed] [Google Scholar]
- 8. Richards MJ, Edwards JR, Culver DH, Gaynes RP, NNIS (1999) Nosocomial infections in medical intensive care units in the United States. Critical Care Medicine 27: 887–892. [DOI] [PubMed] [Google Scholar]
- 9. Klevens RM, Edwards JR, Richards CL, Horan TC, Gaynes RP, Pollock DA et al. (2007) Estimating health care-associated infections and deaths in US hospitals, 2002. Public Health Reports 122: 160–166. [DOI] [PMC free article] [PubMed] [Google Scholar]
- 10. Muto CA, Jernigan JA, Ostrowsky BE, Richet HM, Jarvis WR, Boyce JM, et al. (2003) SHEA guideline for preventing nosocomial transmission of multidrug-resistant strains of staphylococcus aureus and enterococcus. Infection Control and Hospital Epidemiology 24: 362–386. [DOI] [PubMed] [Google Scholar]
- 11. Cooper BS, Medley GF, Stone SP, Kibbler CC, Cookson BD, Roberts JA, et al. (2004) Methicillin-resistant Staphylococcus aureus in hospitals and the community: Stealth dynamics and control catastrophes. Proceedings of the National Academy of Sciences of the United States of America 101: 10223–10228. [DOI] [PMC free article] [PubMed] [Google Scholar]
- 12. Bootsma MCJ, Wassenberg MWM, Trapman P, Bonten MJM (2011) The nosocomial transmission rate of animal-associated ST398 meticillin-resistant Staphylococcus aureus. Journal of the Royal Society Interface 8: 578–584. [DOI] [PMC free article] [PubMed] [Google Scholar]
- 13. Hetem DJ, Westh H, Boye K, Jarlov JO, Bonten MJM, Bootsma MC (2012) Nosocomial transmission of community-associated methicillin-resistant Staphylococcus aureus in Danish Hospitals. Journal of Antimicrobial Chemotherapy 67: 1775–1780. 10.1093/jac/dks125 [DOI] [PubMed] [Google Scholar]
- 14. Cooper BS, Kypraios T, Batra R, Wyncoll D, Tosas O, Edgeworth JD (2012) Quantifying Type-Specific Reproduction Numbers for Nosocomial Pathogens: Evidence for Heightened Transmission of an Asian Sequence Type 239 MRSA Clone. Plos Computational Biology 8. [DOI] [PMC free article] [PubMed] [Google Scholar]
- 15. Hetem DJ, Bootsma MCJ, Troelstra A, Bonten MJM (2013) Transmissibility of Livestock-associated Methicillin-Resistant Staphylococcus aureus. Emerging Infectious Diseases 19: 1797–1802. 10.3201/eid1911.121085 [DOI] [PMC free article] [PubMed] [Google Scholar]
- 16. de Celles MD, Salomon J, Marinier A, Lawrence C, Gaillard JL, Herrmann JL, et al. (2012) Identifying More Epidemic Clones during a Hospital Outbreak of Multidrug-Resistant Acinetobacter baumannii. Plos One 7. [DOI] [PMC free article] [PubMed] [Google Scholar]
- 17. Diekmann O, Heesterbeek JAP, Metz JAJ (1990) On the Definition and the Computation of the Basic Reproduction Ratio R0 in Models for Infectious-Diseases in Heterogeneous Populations. Journal of Mathematical Biology 28: 365–382. [DOI] [PubMed] [Google Scholar]
- 18. Austin DJ, Bonten MJM, Weinstein RA, Slaughter S, Anderson RM (1999) Vancomycin-resistant enterococci in intensive-care hospital settings: Transmission dynamics, persistence, and the impact of infection control programs. Proceedings of the National Academy of Sciences of the United States of America 96: 6908–6913. [DOI] [PMC free article] [PubMed] [Google Scholar]
- 19. Lanzas C, Dubberke ER, Lu Z, Reske KA, Grohn YT (2011) Epidemiological Model for Clostridium difficile Transmission in Healthcare Settings. Infection Control and Hospital Epidemiology 32: 553–561. 10.1086/660013 [DOI] [PMC free article] [PubMed] [Google Scholar]
- 20. Kiss IZ, Green DM, Kao RR (2006) The effect of contact heterogeneity and multiple routes of transmission on final epidemic size. Mathematical Biosciences 203: 124–136. [DOI] [PubMed] [Google Scholar]
- 21. Pelupessy I, Bonten MJM, Diekmann O (2002) How to assess the relative importance of different colonization routes of pathogens within hospital settings. Proceedings of the National Academy of Sciences of the United States of America 99: 5601–5605. [DOI] [PMC free article] [PubMed] [Google Scholar]
- 22. Bolker B (2008) Ecological models and data in R. New Jersey, USA: Princeton University Press. [Google Scholar]
- 23. Goldmann DA, Weinstein RA, Wenzel RP, Tablan OC, Duma RJ, Gaynes RP, et al. (1996) Strategies to prevent and control the emergence and spread of antimicrobial-resistant microorganisms in hospitals—A challenge to hospital leadership. Journal of the American Medical Association 275: 234–240. [PubMed] [Google Scholar]
- 24. Cook AR, Otten W, Marion G, Gibson GJ, Gilligan CA (2007) Estimation of multiple transmission rates for epidemics in heterogeneous populations. Proceedings of the National Academy of Sciences of the United States of America 104: 20392–20397. [DOI] [PMC free article] [PubMed] [Google Scholar]
Associated Data
This section collects any data citations, data availability statements, or supplementary materials included in this article.
Supplementary Materials
(R)
(ZIP)
Data Availability Statement
All relevant data are within the paper and its Supporting Information files.


