

Abstract
Background
Many epidemiologic studies have investigated the association between carotenoids intake and risk of Prostate cancer (PCa). However, results have been inconclusive.
Methods
We conducted a systematic review and dose-response meta-analysis of dietary intake or blood concentrations of carotenoids in relation to PCa risk. We summarized the data from 34 eligible studies (10 cohort, 11 nested case-control and 13 case-control studies) and estimated summary Risk Ratios (RRs) and 95% confidence intervals (CIs) using random-effects models.
Results
Neither dietary β-carotene intake nor its blood levels was associated with reduced PCa risk. Dietary α-carotene intake and lycopene consumption (both dietary intake and its blood levels) were all associated with reduced risk of PCa (RR for dietary α-carotene intake: 0.87, 95%CI: 0.76–0.99; RR for dietary lycopene intake: 0.86, 95%CI: 0.75–0.98; RR for blood lycopene levels: 0.81, 95%CI: 0.69–0.96). However, neither blood α-carotene levels nor blood lycopene levels could reduce the risk of advanced PCa. Dose-response analysis indicated that risk of PCa was reduced by 2% per 0.2mg/day (95%CI: 0.96–0.99) increment of dietary α-carotene intake or 3% per 1mg/day (95%CI: 0.94–0.99) increment of dietary lycopene intake.
Conclusions
α-carotene and lycopene, but not β-carotene, were inversely associated with the risk of PCa. However, both α-carotene and lycopene could not lower the risk of advanced PCa.
Introduction
PCa is the second most abundant male cancer [1]. Owing to the improved screening and early detection procedures, rising incidence rates of PCa have been observed over the last few decades [2]. However, the success in treating advanced PCa remains poor, drawing attention to dietary factors that may influence risk of this malignancy, particularly carotenoids [3]. Lots of epidemiological factors, including age, gender, ethnicity, genetic factors, family history, lifestyle, region and diet, have been considered to be associated with the development of PCa [4]. For example, Asian populations are generally at lower PCa risk compared with the Western populations [5]. Moreover, the average annual incidence rate of PCa between 1988 and 1992 among Chinese men in the United States was 15 times higher than that of their counterparts living in Shanghai and Tianjin [6], specially, the change of diet and lifestyle inevitably resulted in the increased prevalence of obesity in East Asia [7], which might be responsible for increasing trend of PCa in East Asia—all of which suggest that variations in lifestyle and diet may play a crucial role in PCa. Among a large number of components of foods, carotenoids, especially its main active ingredients—carotene and lycopene, have received special attention due to its promising antioxidative properties [8–10].
Carotenoids, which include α-carotene, β-carotene, lycopene, β-cryptoxanthin, lutein, and zeaxanthin that represent the major carotenoids in the human diet [8], provide the yellow, orange and red pigments in fruits and vegetables [11]. Carotenoids have distinct antioxidative properties, including protecting DNA and other important biomolecules from free radicals [12]. In 1981, Peto et al. hypothesized that dietary β-carotene from fruit and vegetables may reduce human cancer incidence rates [13], since then a flurry of epidemiologic studies had addressed this topic [14–17]. Carotenes(including α-carotene and β-carotene) have been investigated for many years now, but whether carotenes are related to the PCa are still mostly inconsistent. Lycopene is one of the most effective oxygen radical quenching agents among the carotenoids [18], which is found in relatively high concentrations in the prostate gland [19]. The results of epidemiological studies have generally supported a protective effect on cancer of carotenoid-rich foods. According to the latest Continuous Update Project(CUP) report summarized by the World Cancer Research Fund(WCRF) in November 2014, there is limited evidence for the effect of lycopene on PCa risk [20]. In contrast, substantial intake of β-carotene is unlikely to have any effect on the PCa risk. These inconsistencies could be mainly due to confounding by nutritional as well as non-nutritional factors and lack of validity of carotenoids estimates due to inaccurate dietary or blood concentration assessment.
Based on these inconsistencies, we conducted this meta-analysis on all published epidemiologic studies to date to reevaluate and quantify the relation between dietary intake or blood concentrations of α-carotene, β-carotene, lycopene and risk of PCa.
Materials and Methods
Literature search
This meta-analysis was conducted in accordance with PRISMA guidelines(S1 PRISMA Checklist). We conducted a comprehensive literature search of PubMed (http://www.ncbi.nlm.nih.gov/pubmed) and Embase (http://www.elsevier.com/online-tools/embase) (up to January 2015) using the key words: carotenoids, carotene, lycopene, prostate cancer, case-control study, cohort study and text terms: micronutrients. Bibliographies from retrieved articles were also scoured to find further eligible studies.
Study selection
Our objective was to thoroughly evaluate the relation between dietary intake or blood concentrations of α-carotene, β-carotene, lycopene and risk of PCa. Studies that met the following criteria were included in the meta-analysis: 1) used epidemiologic investigation design: case-control study, nested case-control study, cohort study, etc; 2) evaluated the association between carotene(α- and/or β-), lycopene and PCa risk; and 3) provided RRs with 95% CIs for ≥3 exposure categories. Furthermore, studies that additionally provided the doses of carotenoids, the number of cases, and the number of controls(or person-years) in each of exposure categories were included in the dose-response meta-analysis.
Data extraction and statistical analysis
The following information was extracted from each study: name of the first author, year of publication, location of study, study period, study type, age of the study population at baseline, number of cases/controls/total participants, year of follow-up, range of exposure(dietary intake or blood levels) and adjustment for covariates. Independent data extraction was performed by two authors(YL W and RC). Any discrepancies were resolved through discussing with the third reviewer(QX).
Given the fact that the quality of the included studies evaluating these relations, especially in terms of statistical power and the rigor with which the dietary data were collected, varied considerably, we conducted a quality assessment on preliminarily included studies, by using the 9-star Newcastle-Ottawa Scale (NOS) [21], which is a validated scale for non-randomized studies in a meta-analysis. This scale includes three aspects of evaluation: the selection of the cohorts, comparability of cohorts, and ascertainment of the exposure and outcome of interest. We regarded scores of 1–3, 4–6, and 7–9 as low, moderate, and high quality, respectively.
A random-effect model was utilized to consider both within-study and between-study variations in RR estimates [22]. As different studies might report different exposure categories, such as dichotomous, thirds, quarters, or fifths, we used the study specific RR for the highest versus lowest category of dietary carotenoids intake(mg/day) or carotenoids concentration(ug/dl) exposure for the meta-analysis. Cochran Q test and I2 statistic were used to assess the heterogeneity [23]. We also performed sensitivity analyses to evaluate whether the pooled results could have been markedly affected by sequentially exclude a single study at a time. Subgroup analyses were performed for study type, regions, covariate adjustment.
For the meta-analysis of the dose-response relationship between carotenoids and PCa risk, the method of generalized least squares for trend estimation proposed by Greenland and Longnecker and Orsini et al [24, 25], was performed using restricted cubic splines with 3 knots at percentiles 33%, 66%, and 99% of the distribution. A P value for curvelinearity or nonlinearity was calculated by testing the null hypothesis that the coefficient of the second spline was equal to zero. We used the Stata 12(Stata Corp., College Station, Texas) to perform all statistical tests. p<0.05 was considered statistically significant.
Results
Literature search
The initial screening yielded 206 publications. After selection, a total of 34 studies (1 article [26] reported results from two subcohorts) from 33 publications [14–17, 26–54] were included in the meta-analysis. Among these studies, twelve, nineteen and thirteen studies reported the effects of dietary intake of α-carotene, β-carotene, lycopene on PCa risk, respectively. Eleven, thirteen and fifteen studies reported the effects of blood levels of α-carotene, β-carotene, lycopene on PCa risk, respectively(Fig 1).
Fig 1. The literature search process.

Study characteristics
Among these 34 studies, 10 studies were cohort studies (two studies were case-cohort studies), 11 studies were nested case-control studies, and 13 studies were case-control studies(Table 1).
Table 1. Characteristics of included studies.
| Source, y | Location | Study Period | Study Type | Age, y(SD) | No.of Cases | No.of Matched Controls | No.of Participants | Follow-up,y | Range of Exposure:blood(ug/dl);intake(mg/day) | Adjustment for Covariates |
|---|---|---|---|---|---|---|---|---|---|---|
| Karppi,2009 | Finland | 1993–2006 | Cohort | 56.2 | 55 | — | 997 | 12.6 | Serum lycopene:4.68(T1),11.11(T3) | Age, examination year, alcohol intake, FHPC, physical activity, waist-to-hip ratio, education, smoking, and serum folate. |
| Shibata,1992 | USA | 1981–1989 | Cohort | 65–85 | 1,335 | — | 11,580 | >8 | Intake α-carotene:1.8(T1),8.6(T3) | Age and smoking. |
| Giovannucci,1995 | USA | 1986–1992 | Cohort | 40–75 | 812 | — | 47,894 | 6 | Intake α-carotene:0.243(Q1),0.221(Q4);β-carotene:2.1(Q1),10.8(Q4);lycopene:1.5(Q1),10.1(Q4) | Age and energy. |
| Ambrosini,2008 | Australia | 1990–2004 | Cohort | Cases:59.2–66.2 b Controls:47.5–62.5 b | 97 | — | 2,183 | 12 | Intake β-carotene:1.8(T1),4.6(Q4) | Age, fruit and vegetable intake, retinol/β-carotene supplement and crocidolite exposure. |
| Kirsh,2006 | USA | 1993–2001 | Cohort | 55–74 | 1,338 | — | 29,361 | 8 | Intake α-carotene:0.47(Q1),2.32(Q5);lycopene:5.05(Q1),15.6(Q5) | Age, energy, race, study center, FHPC,BMI, smoking, physical activity, fat/red meat intake,history of diabetes, and aspirin use. |
| Umesawa,2013 | Japan | 1988–1990 | Cohort | 40–79 | 143 | — | 15,471 | 20 | Intake α-carotene:0.11(Q1),0.50(Q5);β-carotene:0.1(Q1),3.72(Q5) | Saturated fat/isoflavone/α-tocopherol intake. |
| Daviglus,1996 | USA | 1959–1989 | Cohort | 40–55 | 132 | — | 1,899 | 30 | Intake β-carotene:2.3(Q1),4.0(Q4) | Age, smoking, cholesteroal/saturated fat/ethanol intake, energy, and occupation. |
| Roswall,2013 | Denmark | 1993–1997 | Cohort | 50–64 | 1,571 | — | 26,856 | 7 | Intake β-carotene:1.6(Q1),4.71(Q4) | Height, weight, education, red meat/alcohol/selenium intake. |
| Schuurman,2002 | Netherlands | 1986–1992 | Case-Cohort | 55–70 | 642 | 1,525 | 58,279 | 6.3 | NR(intake) | Age, FHPC, socioeconomic status, and alcohol intake. |
| Agalliu,2001 | Canada | 2003–2010 | Case-Cohort | Cases:66.2(8.4) Subcohort:69.3(10.5) | 661 | 1,864 | 34,291 | 7 | Intake β-carotene:2.26(Q1),10.77(Q5);lycopene:2.45(Q1),15.87(Q5) | Age, race, BMI, physical activity, and education. |
| Key,2007 | European Countries | 1992–2000 | NCCS | Cases:60.4(5.8) Controls:60.1(5.8) | 966 | 1,064 | 137,001 | 4 | Plasma α-carotene:2.59(Q1),10.51(Q5);β-carotene:8.21(Q1),27.28(Q5);lycopene:15.04(Q1),49.37(Q5) | Age, fasting hours prior to blood draw, BMI,FHPC, and education. |
| Huang,2002 | USA | CLUE a I:1974–1996;CLUE II:1989–1996 | NCCS | CLUE I:Cases:54 (9) Controls:54 (9) CLUE II: Cases:66 (8) Controls:66 (9) | CLUE I:182;CLUE II:142 | CLUE I 364 CLUE II 284 | CLUE I:9,804 CLUE II:10,456 | CLUE I:17 CLUE II:3.5 | CLUE I:Serum α-carotene:1.4(Q1),3.9(Q5);β-carotene:4.4(Q1),15.6(Q5);lycopene:21.7(Q1),54.9(Q5) CLUE II:Serum α-carotene:1.2(Q1),5.5(Q5);β-carotene:4.2(Q1),15.8(Q5);lycopene:24.3(Q1),62.8(Q5) | Age, number of years since blood was drawn, disease stage at diagnosis, smoking, and BMI. |
| Goodman,2003 | USA | 1983–1997 | NCCS | 45–75 | 205 | 205 | 18,314 | >10 | Serum α-carotene:1.8(Q1),4.3(Q4);β-carotene:9.4(Q1),21.9(Q4);lycopene:22.9(Q1),41.7(Q4) | Age, study center at randomization, sex, smoking, and year of randomization. |
| Gann,1999 | USA | 1982–1995 | NCCS | 40–85 | 578 | 1,294 | 22,071 | 13 | Plasma α-carotene:3.46(Q1),10.33(Q4);lycopene:26.17(Q1),58.01(Q4) | Physical activity, BMI, plasma total cholesterol, alcohol intake, and multivitamin supplement use. |
| Nomura,1997 | USA | 1971–1975 | NCCS | 52–75 | 142 | 142 | 6,860 | >20 | NR(intake) | NR |
| Beilby,2010 | Australia | Since 1990 | NCCS | Cases:69.8(7.2) Controls:69.3(6.7) | 96 | 226 | 4,890 | >10 | Serum β-carotene:0.11(T1),1.16(T3);lycopene:0.05(T1),0.43(T3) | Age, and vitamin A supplement. |
| Peters,2007 | USA | 1993–2001 | NCCS | 55–75 | 692 | 844 | 28,243 | 8 | Serum α-carotene:2.6(Q1),16.6(Q5);β-carotene:6.1(Q1),38.7(Q5);lycopene:30.5(Q1),108.4(Q5) | Age, time since initial screening, year of blood draw, and study center. |
| Wu,2004 | USA | 1993–1998 | NCCS | 40–75 | 450 | 450 | 18,259 | >5 | NR(blood) | Cholesterol levels, selenium/Vitamin E supplementation, FHPC, BMI, height, physical activity, history of vasectomy and current smoking. |
| Gill,2009 | USA | 1993–1996 | NCCS | 45–75 | 467 | 936 | 96,382 | >3 | Serum β-carotene:9.8(Q1),59.7(Q4);lycopene:22.0(Q1),65.6(Q4) | Age, fasting hours prior to blood draw, BMI, FHPC, and education. |
| Hsing,1990 | USA | 1974–1986 | NCCS | 47–91 | 103 | 103 | 206 | 13 | NR(blood) | Age, race, smoking, education, time of last meal. |
| Andersson,1996 | Sweden | 1989–1994 | CC | <81 | 526 | 536 | 1,062 | — | NR(intake) | Age and energy. |
| Norrish,1998 | New Zealand | 1996–1997 | CC | 40–81 | 317 | 480 | 797 | — | Intake β-carotene:2.5(Q1),6.1(Q4);lycopene:0.7(Q1),2.0(Q4) | Age, height, NSAIDs, and socioeconomlc status. |
| Bosetti,2004 | Italy | 1991–2002 | CC | 46–75 | 1,294 | 1,451 | 2,745 | — | NR(intake) | Age, study center, education, physical activity, BMI,FHPC and energy. |
| Mettlin,1989 | USA | Since 1987 | CC | 55–86 | 371 | 371 | 742 | — | NR(intake) | Age |
| Zhang,2007 | USA | 1998–2003 | CC | Cases:64.4(9.0) Controls:59.4(10.5) | 193 | 197 | 390 | — | Plasma α-carotene:0.71(Q1),6.08(Q4);β-carotene:3.47(Q1),28.35(Q4);lycopene:14.05(Q1),51.37(Q4) | Age, race, BMI, education, and smoking. |
| Jian,2005 | China | 2001–2002 | CC | Cases:72.7(7.1) Controls:71.4(7.2) | 130 | 274 | 404 | — | Intake α-carotene:0.24(Q1),1.79(Q4);β-carotene:1.96(Q1),7.49(Q4);lycopene:1.61(Q1),4.92(Q4) | Age, locality, education, family income, marital status, number of children, FHPC, BMI, tea drinking, energy, fat intake. |
| Chang,2005 | USA | 1996–1998 | CC | Cases:63.9(7.0) Controls:62.8(6.6) | 118 | 52 | 170 | — | NR(blood) | Age, smoking, and height. |
| McCann,2009 | USA | 1986–1991 | CC | NA | 433 | 538 | 971 | — | Intake α-carotene:0.63(Q1),1.5(Q4);β-carotene:3.8(Q1),8.04(Q4);lycopene:3.9(Q1),8.86(Q4) | Age, education, BMI, smoking, and energy. |
| Meyer,1997 | Canada | 1990–1993 | CC | >45 | 215 | 593 | 808 | — | NR(intake) | Age, education, FHPC, energy. |
| Jain, 1999 | Canada | 1989–1993 | CC | Cases:69.8 Controls:69.9 | 617 | 636 | 1,253 | — | Intake α-carotene:0.84(Q1),2.16(Q4);β-carotene:3.0(Q1),7.83(Q4);lycopene:2.1(Q1),12.67(Q4) | Age, energy, vasectomy, smoking, marital status, study area, BMI, vitamin use, diet. |
| Deneo-Pelligrini,1999 | Uruguay | 1994–1997 | CC | 40–89 | 175 | 240 | 415 | — | Intake α-carotene:0.11(Q1),0.60(Q4);β-carotene:2.71(Q1),7.49(Q4);lycopene:1.3(Q1),3.3(Q4) | Age, residence, education, FHPC, BMI, energy. |
| Cohen,2000 | USA | 1993–1996 | CC | 40–64 | 628 | 602 | 1,230 | — | Intake α-carotene:0.33(Q1),0.81(Q4);β-carotene:2.2(Q1),4.4(Q4);lycopene:4.9(Q1),9.9(Q4) | Age, race, fat intake, energy, FHPC, BMI, antigen tests, education. |
| Lu,2001 | USA | 1993–1997 | CC | Cases:59.98(6.19) Controls:41.9(13.64) | 65 | 130 | 195 | — | Intake α-carotene:0.39(Q1),1.14(Q4);β-carotene:2.38(Q1),5.85(Q4);lycopene:1.46(Q1),3.45(Q4) Plasma α-carotene:2.02(Q1),5.85(Q4);β-carotene:7.25(Q1),19.9(Q4);lycopene:10.45(Q1),23.39(Q4) | Age, race, smoking, education, FHPC, alcohol intake, energy. |
Abbreviations: NCCS, nested case-control study; CCS, case-control study; SD, standard deviation; T, tertile; Q, quartile/quintile; BMI, body mass index; NSAIDs, non-steroidal anti-inflammatory drugs; FHPC, family history of prostate cancer; NR, not reported; NA, not accessible.
aDerived from the slogan of a campaign, “Give us a CLUE to cancer.”
bIndicated interquartile range(IQR).
They involved a total of 15,891 cases and 592,479 participants. Twenty two studies were from the North America, 7 studies were from the Europe, 2 studies were from Australia, 2 study were from the Asian countries, and 1 study was from Uruguay. With respect to the dietary intake of carotenoids, 12 studies studied on α-carotene, 19 studies studied on β-carotene, and 13 studies studied on lycopene. With respect to the blood levels of carotenoids, 11 studies studied on α-carotene, 13 studies studied on β-carotene, 15 studies studied on lycopene. All these included observational studies utilized structured food frequency questionnaire to collect participants’ information on usual food consumption.
Most studies provided risk estimates that were adjusted for age (29 studies); few adjusted for smoking(14 studies), body mass index(BMI)(15 studies), family history of PCa(FHPC)(12 studies), energy intake(12 studies), alcohol intake(3 studies), physical activity (6 studies) and education(14 studies). All studies but nine studies [15, 16, 29, 35, 42, 43, 45, 49, 53] provided ranges of exposure in each of exposure categories. The mean NOS score was 7.6 stars (range, 4–9 stars; S1 Table), suggesting that the study quality was fair.
Dietary intake of α-carotene, β-carotene, lycopene and PCa risk
A significant inverse association was observed between dietary α-carotene intake and PCa(RR:0.81; 95% CI:0.76–0.99)(Fig 2, left). No significant statistical difference was observed between dietary β-carotene and PCa risk(RR:0.90; 95% CI:0.81–1.01). Exclusion of any individual study regarding the dietary intake of β-carotene did not change the pooled results substantially. No significant statistical difference was observed in dietary lycopene intake, with a RR of 0.88(95% CI: 0.76–1.02; I2 = 23.61%). However, sensitivity analysis further showed that when omitting the study conducted by Jian et al., which has a wide variation in confidence intervals and deviatesfrom the pooled trend, the results did change appreciably(RR:0.91; 95% CI:0.83–1.00) and the heterogeneity among the remaining studies decreased to 0%. Therefore, dietary lycopene intake was inversely associated with the risk of PCa.
Fig 2. Pooled risks according to dietary carotenoids intake and its blood levels.

Dietary intake of α-carotene, β-carotene, lycopene and PCa risk(left), blood levels of α-carotene, β-carotene, lycopene and PCa risk(right).
We next explored the risk analyses stratified according to the study type, region and covariate adjustments to examine sources of study heterogeneity and the influence of potential residual confounding factors, such as age, BMI, FHPC, education, smoking, etc(Table 2).
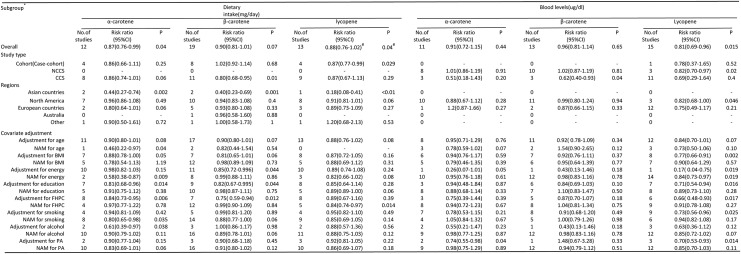
Table 2. Subgroup analysis regarding the association between carotenoids consumption and PCa risk.
| Subgroup* | Dietary intake(mg/day) | Blood levels(ug/dl) | ||||||||||||||||
|---|---|---|---|---|---|---|---|---|---|---|---|---|---|---|---|---|---|---|
| α-carotene | β-carotene | lycopene | α-carotene | β-carotene | lycopene | |||||||||||||
| No. of studies | Risk ratio(95%CI) | P | No. of studies | Risk ratio(95%CI) | P | No. of Studies | Risk ratio(95%CI) | P | No. of studies | Risk ratio(95%CI) | P | No. of studies | Risk ratio(95%CI) | P | No. of Studies | Risk ratio(95%CI) | P | |
| Overall | 12 | 0.87(0.76–0.99) | 0.04 | 19 | 0.90(0.81–1.01) | 0.07 | 13 | 0.88(0.76–1.02) # | 0.083 # | 11 | 0.91(0.72–1.15) | 0.44 | 13 | 0.96(0.81–1.14) | 0.65 | 15 | 0.81(0.69–0.96) | 0.015 |
| Study type | ||||||||||||||||||
| Cohort(Case-cohort) | 4 | 0.86(0.66–1.11) | 0.25 | 8 | 1.02(0.92–1.14) | 0.68 | 4 | 0.87(0.77–0.99) | 0.029 | 0 | - | - | 0 | - | - | 1 | 0.78(0.37–1.65) | 0.52 |
| NCCS | 0 | - | - | 0 | - | - | 0 | 8 | 1.01(0.86–1.19) | 0.91 | 10 | 1.02(0.87–1.19) | 0.81 | 3 | 0.82(0.70–0.97) | 0.02 | ||
| CC | 8 | 0.86(0.74–1.01) | 0.06 | 11 | 0.80(0.68–0.95) | 0.01 | 9 | 0.87(0.67–1.13) | 0.29 | 3 | 0.51(0.18–1.43) | 0.2 | 3 | 0.62(0.40–0.93) | 0.04 | 11 | 0.69(0.29–1.64) | 0.4 |
| Regions | ||||||||||||||||||
| Asian countries | 2 | 0.44(0.27–0.74) | 0 | 2 | 0.40(0.23–0.69) | 0.001 | 1 | 0.18(0.08–0.41) | <0.01 | 0 | - | - | 0 | - | - | 0 | - | - |
| North America | 7 | 0.96(0.86–1.08) | 0.49 | 10 | 0.94(0.83–1.08) | 0.4 | 8 | 0.91(0.81–1.01) | 0.06 | 10 | 0.88(0.67–1.12) | 0.28 | 11 | 0.99(0.80–1.24) | 0.94 | 3 | 0.82(0.68–1.00) | 0.05 |
| European countries | 2 | 0.80(0.64–1.01) | 0.06 | 5 | 0.93(0.80–1.08) | 0.33 | 3 | 0.89(0.73–1.09) | 0.27 | 1 | 1.2(0.87–1.66) | 0.27 | 2 | 0.87(0.66–1.15) | 0.33 | 12 | 0.75(0.49–1.17) | 0.21 |
| Australia | 0 | - | - | 1 | 0.96(0.58–1.60) | 0.88 | 0 | - | - | 0 | - | - | 0 | - | - | 0 | - | - |
| Other | 1 | 0.90(0.50–1.61) | 0.72 | 1 | 1.00(0.58–1.73) | 1 | 1 | 1.20(0.68–2.13) | 0.53 | 0 | - | - | 0 | - | - | 0 | - | - |
| Covariate adjustments | ||||||||||||||||||
| Adjustment for age | 11 | 0.90(0.80–1.01) | 0.08 | 17 | 0.90(0.80–1.01) | 0.07 | 13 | 0.88(0.76–1.02) | 0.08 | 8 | 0.95(0.71–1.29) | 0.76 | 11 | 0.92 (0.78–1.09) | 0.34 | 12 | 0.84(0.70–1.01) | 0.07 |
| No adjustment for age | 1 | 0.46(0.22–0.97) | 0.04 | 2 | 0.82(0.44–1.54) | 0.54 | 0 | - | - | 3 | 0.78(0.59–1.02) | 0.07 | 2 | 1.54(0.90–2.65) | 0.12 | 3 | 0.73(0.50–1.06) | 0.1 |
| Adjustment for BMI | 7 | 0.88(0.78–1.00) | 0.05 | 7 | 0.81(0.65–1.01) | 0.06 | 8 | 0.87(0.72–1.05) | 0.16 | 6 | 0.94(0.76–1.17) | 0.59 | 7 | 0.92(0.76–1.11) | 0.37 | 8 | 0.77(0.66–0.91) | 0 |
| No adjustment for BMI | 5 | 0.78(0.54–1.13) | 1.19 | 12 | 0.98(0.89–1.09) | 0.73 | 5 | 0.88(0.69–1.12) | 0.31 | 5 | 0.79(0.46–1.35) | 0.39 | 6 | 0.95(0.64–1.39) | 0.77 | 7 | 0.90(0.64–1.29) | 0.57 |
| Adjustment for energy | 10 | 0.98(0.82–1.03) | 0.15 | 11 | 0.85(0.72–0.996) | 0.04 | 10 | 0.89(0.74–1.08) | 0.24 | 1 | 0.26(0.07–1.01) | 0.05 | 1 | 0.43(0.13–1.46) | 0.18 | 1 | 0.17 (0.04–0.75) | 0.02 |
| No adjustment for energy | 2 | 0.58(0.38–0.87) | 0.01 | 8 | 0.99(0.88–1.11) | 0.86 | 3 | 0.82(0.66–1.02) | 0.08 | 10 | 0.95(0.76–1.18) | 0.61 | 12 | 0.98(0.83–1.16) | 0.78 | 14 | 0.84(0.73–0.97) | 0.02 |
| Adjustment for education | 7 | 0.81(0.68–0.96) | 0.01 | 9 | 0.82(0.67–0.995) | 0.04 | 8 | 0.85(0.64–1.14) | 0.28 | 3 | 0.94(0.48–1.84) | 0.87 | 6 | 0.84(0.69–1.03) | 0.1 | 7 | 0.71(0.54–0.94) | 0.02 |
| No adjustment for education | 5 | 0.91(0.75–1.12) | 0.38 | 10 | 0.98(0.87–1.11) | 0.75 | 5 | 0.89(0.89–1.00) | 0.06 | 8 | 0.88(0.68–1.14) | 0.33 | 7 | 1.10(0.83–1.47) | 0.5 | 8 | 0.89(0.73–1.10) | 0.28 |
| Adjustment for FHPC | 8 | 0.84(0.73–0.95) | 0.01 | 7 | 0.75 (0.59–0.94) | 0.01 | 8 | 0.89(0.67–1.16) | 0.39 | 3 | 0.75(0.39–1.44) | 0.39 | 5 | 0.87(0.70–1.07) | 0.18 | 6 | 0.66 (0.48–0.93) | 0.02 |
| No adjustment for FHPC | 4 | 0.97(0.77–1.22) | 0.78 | 12 | 0.99(0.90–1.09) | 0.84 | 5 | 0.84(0.74–0.97) | 0.014 | 8 | 0.94(0.72–1.23) | 0.67 | 8 | 1.04(0.81–1.34) | 0.75 | 9 | 0.91(0.78–1.08) | 0.27 |
| Adjustment for smoking | 4 | 0.94(0.81–1.09) | 0.42 | 5 | 0.99(0.81–1.20) | 0.89 | 4 | 0.95(0.82–1.10) | 0.49 | 7 | 0.78(0.53–1.15) | 0.21 | 8 | 0.91(0.68–1.20) | 0.49 | 9 | 0.73(0.56–0.96) | 0.03 |
| No adjustment for smoking | 8 | 0.80(0.65–0.98) | 0.04 | 14 | 0.88(0.77–1.00) | 0.06 | 9 | 0.85(0.69–1.05) | 0.14 | 4 | 1.05(0.84–1.32) | 0.67 | 5 | 1.00(0.79–1.26) | 0.98 | 6 | 0.94(0.82–1.08) | 0.17 |
| Adjustment for alcohol | 2 | 0.61(0.39–0.97) | 0.04 | 3 | 1.00(0.86–1.17) | 0.98 | 2 | 0.88(0.57–1.36) | 0.56 | 2 | 0.55(0.21–1.47) | 0.23 | 1 | 0.43(0.13–1.46) | 0.18 | 3 | 0.63(0.36–1.12) | 0.12 |
| No adjustment for alcohol | 10 | 0.90(0.79–1.02) | 0.11 | 16 | 0.89(0.78–1.01) | 0.06 | 11 | 0.88(0.75–1.03) | 0.12 | 9 | 0.98(0.77–1.25) | 0.87 | 12 | 0.98(0.83–1.16) | 0.78 | 12 | 0.85(0.72–1.02) | 0.07 |
| Adjustment for PA | 2 | 0.90(0.77–1.04) | 0.15 | 3 | 0.90(0.68–1.18) | 0.45 | 3 | 0.92(0.81–1.05) | 0.22 | 2 | 0.74(0.55–0.98) | 0.04 | 1 | 1.48(0.67–3.28) | 0.33 | 3 | 0.70(0.53–0.93) | 0.01 |
| No adjustment for PA | 10 | 0.83(0.69–1.01) | 0.06 | 16 | 0.91(0.80–1.02) | 0.12 | 10 | 0.86(0.69–1.07) | 0.18 | 9 | 0.98(0.75–1.29) | 0.89 | 12 | 0.94(0.79–1.12) | 0.51 | 12 | 0.85(0.70–1.03) | 0.11 |
Abbreviations: NCCS, nested case-control study; CCS, case-control study; BMI, body mass index; FHPC, family history of prostate cancer; PA, physical activity; NAM, No adjustment; CI, confidence interval.
*Subgroup analysis was performed in a random-effects model.
#Exclusion of the study conducted by Jian, et al. yielded a pooled risk ratio: 0.97(95%CI:0.83–1.00, p = 0.04) with no heterogeneity among the remaining studies(I2 = 0.0%,p = 0.65).
For dietary intake of α-carotene exposure, subgroup analyses indicated that the protective effect of α-carotene was more evident in Asian countries than in the North America or European countries. In addition, inverse association was more evident in studies that adjusted for education, FHPC, and alcohol compared with studies without such adjustments. β-carotene intake also exerted a protective effect on Asian populations. Overall, our stratified analyses showed that β-carotene intake has no association with PCa risk. For dietary intake of lycopene exposure, the inverse association between lycopene intake and PCa risk was evident in 4 cohort studies(RR:0.87; 95%CI:0.77–0.99).
Blood levels of α-carotene, β-carotene, lycopene and PCa risk
Carotenoids concentrations, compared with dietary assessment, may provide a more accurate estimation of intake. However, pooled results showed that only blood levels of lycopene were significantly associated with reduced PCa risk(0.81, 0.69–0.96)(Fig 2,right). Subgroup analyses demonstrated that neither α-carotene nor β-carotene concentrations was associated with reducing the PCa risk(Table 2). The inverse association between lycopene concentrations and PCa risk was more evident in studies that adjusted for BMI, education, FHPC, smoking and physical activity compared with studies without such adjustments.
Two studies [27, 40] and 4 studies [27, 34, 39, 40] reported the RRs of advanced PCa risk concerning blood levels of α-carotene and lycopene, respectively. However, both of them could not lower the risk of advanced PCa. RRs for blood levels of α-carotene and lycopene were 1.07(95%CI: 0.75–1.52; I2 = 0%) and 0.75(0.44–1.28; I2 = 63.2%), respectively(Fig 3).
Fig 3. Association between blood α-carotene and lycopene levels and risk of advanced PCa.

Advanced PCa was defined as stage III or IV or Gleason score ≥7.
Dose-response analysis
With respect to the lycopene exposure, 7 studies [16, 28, 32, 41, 47, 50, 55] and 8 studies [17, 26, 27, 34, 36, 51, 52] were eligible for dose-response analysis of dietary intake and concentrations, respectively. In the cubic spline model, we showed a nonlinear association between dietary lycopene intake and risk of PCa (Fig 4A; P-nonlinearity = 0.014, P heterogeneity = 0.048) and PCa risk was reduced by 3% per 1mg/day (95%CI: 0.94–0.99) increment of dietary lycopene intake. However, we showed no significant association between lycopene concentrations and risk of PCa(Fig 4B;P-nonlinearity = 0.24, P heterogeneity = 0.21). With respect to the α-carotene exposure, 3 studies [16, 31, 32] were eligible for dose-response analysis, a nonlinear association between dietary α-carotene intake and risk of PCa was observed(Fig 4C; P-nonlinearity = 0.15, P heterogeneity = 0.02) and PCa risk was reduced by 2% per 0.2mg/day (95% CI: 0.96–0.99) increment of dietary α-carotene intake. The dose-response relationship in terms of PCa risk was not found in either α-carotene concentrations or β-carotene(both dietary intake and concentrations)(data not shown).
Fig 4. Dose-response relation plots between carotenoids consumption and risk of PCa.
(A) Dietary lycopene intake(mg/day) and risk of PCa; (B) Blood lycopene levels (ug/dl) and risk of PCa; (C) Dietary α-carotene intake(mg/day) and risk of PCa. These relationships were estimated by using random-effects metaregression. Dotted lines represent the 95% CIs for the fitted trend.
Discussion
Our meta-analysis indicated that α-carotene and lycopene, but not β-carotene, were inversely associated with the risk of PCa and both α-carotene and lycopene could not lower the risk of advanced PCa. Inverse association between α-carotene and PCa risk was augmented by adjustment for education, FHPC, and alcohol and attenuated by adjustment for age and smoking, suggesting that the association was largely mediated through education, FHPC, and alcohol, smoking and age(Table 2). Similarly, significant inverse association between lycopene and PCa risk was largely mediated through FHPC. With respect to carotenoids concentrations, inverse association between lycopene and PCa risk was largely mediated through education, FHPC, smoking and physical activity.
Lycopene is found to be a more efficient antioxidant than β-carotene, α-carotene, and α-tocopherol [56]. Among all major carotenoids, lycopene and tomato products have been most extensively studied [10]. A meta-analysis [57] including 11 case-control studies and 10 cohort studies showed a modest, significant inverse relation between dietary intake of lycopene and PCa risk in cohort studies. However, the CUP report concludes that the link between PCa risk and foods containing lycopene has been downgraded from strong evidence of a decreased risk, to no conclusion possible [20]. This updating is based on a considerable amount of global research focusing on specific types of PCa, for example, fatal, advanced and early (non-advanced) prostate cancers rather than grouping all prostate cancers together. However, this does not mean that no link exists, variations in diagnosis and classifications of the PCa has made the link more difficult to see. In addition, the CUP report has not adjusted the confounding variables when interpreting the evidence. Even more important, frequent lycopene intake may reduce PCa risk via multiple mechanisms. Rafi, et al. informed that lycopene attenuates PCa by modulating the expression of growth and survival associated genes, e.g. CDK7, BCL2, EGFR, and IGF-1R [58]; in addition, lycopene can inhibit PCa cell proliferation via PPARγ-LXRα-ABCA1 pathway [59]; Further, Zu, et al. [60] found that dietary intake of lycopene is associated with reduced risk of lethal PCa and with a lesser degree of angiogenesis in the tumor.
In 1995, van Poppel and Goldbohm [61] summarized all previous studies exploring the risk between β-carotene intake and all types of tumors. They concluded that the association appears most consistent for lung and stomach cancer, whereas the association seems inconsistent for breast and PCa. More recently, a meta-analysis [55] of randomized controlled trials demonstrated that no effect of β-carotene supplementation was observed in the incidence of PCa(RR, 0.99; 95% CI, 0.91–1.07). Although there was in vitro study indicating that β-carotene may act as a growth-inhibitory agent in PCa cells by modulating the caveolin-1 pathway [62], subsequent big data from the Alpha-Tocopherol, Beta-Carotene Cancer Prevention(ATBC) Study, a randomized, double-blind, placebo-controlled trial, suggested that serum β-carotene, serum retinol, and supplemental β-carotene had no apparent effects on PCa patients’ survival [63]. Our pooled and stratified analyses suggested that neither dietary β-carotene intake nor its concentrations was related to the PCa risk, moreover, the null dose-response relationship(data not shown) supported this conclusion. Also, the CUP report concludes that there is strong evidence that consuming β-carotene (either through food or supplements) is unlikely to have a substantial effect on the risk of PCa [20]. The studies on which the CUP report based are all cohort studies which should be given high priority.
Although α-carotene is chemically similar to β-carotene, α-carotene has higher biological activity in inhibiting the proliferation of human neuroblastoma cells [64] and liver carcinogenesis [65]. Besides, serum α-carotene concentrations are inversely associated with risk of death from all causes, cardiovascular disease, cancer, and all other causes [66]. Our pooled analysis indicated a significant inverse relation between α-carotene intake and PCa risk, which was further verified by dose-response analysis(Fig 4C).
It was reported that in Caucasians, the frequencies of fusion of TMPRSS2:ERG, the most common known genetic alteration in PCa, are 50%–70% [67], while in Asian patients the frequencies are lower than 20% [68]. Mao et al. revealed that low-level expression of PTEN is detected in 69.8% (111/159) of UK PCa samples, but only in 34% (31/91) of Chinese samples [69]. Whereas, RAS-RAF-MAPK pathway mutants are much more frequently found in Asian PCa patients than patients from Western countries [70]. All these abnormal genes are likely to contribute to susceptibility to PCa in different ethnic groups. Broccoli, green beans, green peas, spinach, turnip greens, leaf lettuce, the main source of vegetables for China adults, are rich in α-carotene [66]. Specially, our study showed that α-carotene exerted a greater protective effect on Asians. All of these suggested α-carotene may attenuate the PCa susceptibility by interacting with the genetic or environmental factors. However, the fundamental researches that aim at elucidating the links between α-carotene intake and PCa risk are lacking. Altogether, this may shed fresh new light on α-carotene’s mode of action.
Compared with a meta-analysis [57] conducted in 2004, we put emphasis on the single-ingredient of carotenoids rather than raw tomato or its processed products, which may provide more detailed and accurate assessment on the links between carotenoids consumption and PCa risk. Furthermore, dose-response analysis was utilized for the first time to reveal the links between carotenoids consumption and PCa risk. However, our study was subject to one inconsistency: significant association was only found in dietary intake, but not its concentrations. There are 3 case-control studies involving in exploring the links between α-carotene concentrations and PCa risk(Table 2). These retrospective studies may have biased the pooled results.
Not all included studies have adjusted for some important covariates, which are major concerns in our study, may have confounded these associations. For example, the inverse association between dietary α-carotene intake and PCa risk was more evident in studies without adjustment for smoking compared with studies with such adjustment(Table 2), suggesting more high-quality observational studies are warranted to verify the effect of dietary α-carotene intake on PCa risk. In addition, although subgroup analyses were performed, heterogeneity could not wholly explained by the remaining variables, suggesting that other unknown factors are introduced. Furthermore, in terms of α-carotene and lycopene consumption, not all studies were eligible for dose-response analysis, indicating that risks corresponding to dose increments are partially right.
In summary, findings from our study indicate that α-carotene and lycopene, but not β-carotene, are inversely associated with the risk of PCa. However, both α-carotene and lycopene can not lower the risk of advanced PCa. Our results, if replicated in other cohort studies and populations, suggest a need for clinical research into the health benefits of α-carotene and lycopene supplementation.
Supporting Information
(DOC)
(DOCX)
Data Availability
All relevant data are within the paper and its Supporting Information files.
Funding Statement
This work was supported by the National Natural Science Foundation of China (No.: 81372749).
References
- 1. Jemal A, Bray F, Center MM, Ferlay J, Ward E, Forman D. Global cancer statistics. CA Cancer J Clin. 2011;61:69–90. 10.3322/caac.20107 [DOI] [PubMed] [Google Scholar]
- 2. Potosky AL, Miller BA, Albertsen PC, Kramer BS. The role of increasing detection in the rising incidence of PCa. JAMA. 1995;273:548–52. [PubMed] [Google Scholar]
- 3. Nomura AM, Kolonel LN. Prostate cancer: a current perspective. Epidemiol Rev. 1991;13:200–27. [DOI] [PubMed] [Google Scholar]
- 4.World Cancer Report 2014. World Health Organization. 2014. pp. Chapter 5.11. ISBN 9283204298.
- 5.PCa Statistics-Australia. http://www.prostates.com.au/statistics/.
- 6. Lee MM, Gomez SL, Chang JS, Wey M, Wang RT, Hsing AW. Soy and isoflavone consumption in relation to PCa risk in China. Cancer Epidemiol Biomarkers Prev. 2003;12:665–8. [PubMed] [Google Scholar]
- 7. World Health Organization. Noncommunicable Diseases Country Profiles 2011.Geneva: World Health Organization; 2011. p. 50. [Google Scholar]
- 8. Bolhassani A. Cancer chemoprevention by natural carotenoids as an efficient strategy. Anticancer Agents Med Chem. 2015. [Epub ahead of print]. [DOI] [PubMed] [Google Scholar]
- 9. Stahl W, Sies H. beta-Carotene and other carotenoids in protection from sunlight. Am J Clin Nutr. 2012;96:1179S–84S. 10.3945/ajcn.112.034819 [DOI] [PubMed] [Google Scholar]
- 10. Viuda-Martos M, Sanchez-Zapata E, Sayas-Barbera E, Sendra E, Perez-Alvarez JA, Fernandez-Lopez J. Tomato and tomato byproducts. Human health benefits of lycopene and its application to meat products: a review. Crit Rev Food Sci Nutr. 2014;54:1032–49. 10.1080/10408398.2011.623799 [DOI] [PubMed] [Google Scholar]
- 11. O'Neill ME, Carroll Y, Corridan B, Olmedilla B, Granado F, Blanco I, et al. A European carotenoid database to assess carotenoid intakes and its use in a five-country comparative study. Br J Nutr. 2001;85:499–507. [DOI] [PubMed] [Google Scholar]
- 12. Krinsky NI. The antioxidant and biological properties of the carotenoids. Ann N Y Acad Sci.1998;854:443–7. [DOI] [PubMed] [Google Scholar]
- 13. Peto R, Doll R, Buckley JD, Sporn MB. Can dietary beta-carotene materially reduce human cancer rates? Nature. 1981;290:201–8. [DOI] [PubMed] [Google Scholar]
- 14. Shibata A, Paganini-Hill A, Ross RK, Henderson BE. Intake of vegetables, fruits, beta-carotene, vitamin C and vitamin supplements and cancer incidence among the elderly: a prospective study. Br J Cancer. 1992;66:673–9. [DOI] [PMC free article] [PubMed] [Google Scholar]
- 15. Andersson SO, Wolk A, Bergstrom R, Giovannucci E, Lindgren C, Baron J, et al. Energy, nutrient intake and prostate cancer risk: a population-based case-control study in Sweden. Int J Cancer. 1996;68:716–22. [DOI] [PubMed] [Google Scholar]
- 16. Schuurman AG, Goldbohm RA, Brants HA, van den Brandt PA. A prospective cohort study on intake of retinol, vitamins C and E, and carotenoids and prostate cancer risk (Netherlands). Cancer Causes Control. 2002;13:573–82. [DOI] [PubMed] [Google Scholar]
- 17. Zhang J, Dhakal I, Stone A, Ning B, Greene G, Lang NP, et al. Plasma carotenoids and prostate cancer: a population-based case-control study in Arkansas. Nutr Cancer. 2007;59:46–53. [DOI] [PubMed] [Google Scholar]
- 18. Sies H, Stahl W, Sundquist AR. Antioxidant functions of vitamins. Vitamins E and C, beta-carotene, and other carotenoids. Ann N Y Acad Sci.1992;669:7–20. [DOI] [PubMed] [Google Scholar]
- 19. Clinton SK, Emenhiser C, Schwartz SJ, Bostwick DG, Williams AW, Moore BJ, et al. cis-trans lycopene isomers, carotenoids, and retinol in the human prostate. Cancer Epidemiol Biomarkers Prev. 1996;5:823–33. [PubMed] [Google Scholar]
- 20.World Cancer Research Fund International/American Institute for Cancer Research Continuous Update Project Report:Diet, Nutrition, Physical Activity, and Prostate Cancer. 2014. Available at: www.wcrf.org/sites/default/files/Prostate-Cancer-2014-Report.pdf
- 21. Stang A. Critical evaluation of the Newcastle-Ottawa scale for the assessment of the quality of nonrandomized studies in meta-analyses. Eur J Epidemiol. 2010;25:603–5. 10.1007/s10654-010-9491-z [DOI] [PubMed] [Google Scholar]
- 22. DerSimonian R, Laird N. Meta-analysis in clinical trials. Control Clin Trials.1986;7:177–88. [DOI] [PubMed] [Google Scholar]
- 23. Higgins JP, Thompson SG. Quantifying heterogeneity in a meta-analysis. Stat Med. 2002;21:1539–58. [DOI] [PubMed] [Google Scholar]
- 24. Greenland S, Longnecker MP. Methods for trend estimation from summarized dose-response data,with applications to meta-analysis. Am J Epidemiol. 1992;135:1301–9. [DOI] [PubMed] [Google Scholar]
- 25. Orsini N, Bellocco R, Greenland S. Generalized least squares for trend estimation of summarized doseresponse data. Stata Journal. 2006;6:40–57. [Google Scholar]
- 26. Huang HY, Alberg AJ, Norkus EP, Hoffman SC, Comstock GW, Helzlsouer KJ. Prospective study of antioxidant micronutrients in the blood and the risk of developing prostate cancer. Am J Epidemiol. 2003;157:335–44. [DOI] [PubMed] [Google Scholar]
- 27. Peters U, Leitzmann MF, Chatterjee N, Wang Y, Albanes D, Gelmann EP, et al. Serum lycopene,other carotenoids, and prostate cancer risk: a nested case-control study in the prostate, lung,colorectal, and ovarian cancer screening trial. Cancer Epidemiol Biomarkers Prev. 2007;16:962–8. [DOI] [PubMed] [Google Scholar]
- 28. McCann SE, Ambrosone CB, Moysich KB, Brasure J, Marshall JR, Freudenheim JL, et al. Intakes of selected nutrients, foods, and phytochemicals and prostate cancer risk in western New York. Nutr Cancer. 2005;53:33–41. [DOI] [PubMed] [Google Scholar]
- 29. Chang S, Erdman JW Jr., Clinton SK, Vadiveloo M, Strom SS, Yamamura Y, et al. Relationship between plasma carotenoids and prostate cancer. Nutr Cancer. 2005;53:127–34. [DOI] [PubMed] [Google Scholar]
- 30. Roswall N, Larsen SB, Friis S, Outzen M, Olsen A, Christensen J, et al. Micronutrient intake and risk of prostate cancer in a cohort of middle-aged, Danish men. Cancer Causes Control. 2013;24:1129–35. 10.1007/s10552-013-0190-4 [DOI] [PubMed] [Google Scholar]
- 31. Umesawa M, Iso H, Mikami K, Kubo T, Suzuki K, Watanabe Y, et al. Relationship between vegetable and carotene intake and risk of prostate cancer: the JACC study. Br J Cancer. 2014;110:792–6. 10.1038/bjc.2013.685 [DOI] [PMC free article] [PubMed] [Google Scholar]
- 32. Jian L, Du CJ, Lee AH, Binns CW. Do dietary lycopene and other carotenoids protect against prostate cancer? Int J Cancer. 2005;113:1010–4. [DOI] [PubMed] [Google Scholar]
- 33. Kirsh VA, Hayes RB, Mayne ST, Chatterjee N, Subar AF, Dixon LB, et al. Supplemental and dietary vitamin E, beta-carotene, and vitamin C intakes and prostate cancer risk. J Natl Cancer Inst. 2006;98:245–54. [DOI] [PubMed] [Google Scholar]
- 34. Key TJ, Appleby PN, Allen NE, Travis RC, Roddam AW, Jenab M, et al. Plasma carotenoids, retinol, and tocopherols and the risk of prostate cancer in the European Prospective Investigation into Cancer and Nutrition study. Am J Clin Nutr. 2007;86:672–81. [DOI] [PubMed] [Google Scholar]
- 35. Wu K, Erdman JW Jr., Schwartz SJ, Platz EA, Leitzmann M, Clinton SK, et al. Plasma and dietary carotenoids, and the risk of prostate cancer: a nested case-control study. Cancer Epidemiol Biomarkers Prev. 2004;13:260–9. [DOI] [PubMed] [Google Scholar]
- 36. Beilby J, Ambrosini GL, Rossi E, de Klerk NH, Musk AW. Serum levels of folate, lycopene, beta-carotene, retinol and vitamin E and prostate cancer risk. Eur J Clin Nutr. 2010;64:1235–8. 10.1038/ejcn.2010.124 [DOI] [PubMed] [Google Scholar]
- 37. Goodman GE, Schaffer S, Omenn GS, Chen C, King I. The association between lung and prostate cancer risk, and serum micronutrients: results and lessons learned from beta-carotene and retinol efficacy trial. Cancer Epidemiol Biomarkers Prev. 2003;12:518–26. [PubMed] [Google Scholar]
- 38. Ambrosini GL, de Klerk NH, Fritschi L, Mackerras D, Musk B. Fruit, vegetable, vitamin A intakes, and prostate cancer risk. Prostate Cancer Prostatic Dis. 2008;11:61–6. [DOI] [PubMed] [Google Scholar]
- 39. Gill JK, Franke AA, Steven Morris J, Cooney RV, Wilkens LR, Le Marchand L, et al. Association of selenium, tocopherols, carotenoids, retinol, and 15-isoprostane F(2t) in serum or urine with prostate cancer risk: the multiethnic cohort. Cancer Causes Control. 2009;20:1161–71. 10.1007/s10552-009-9304-4 [DOI] [PMC free article] [PubMed] [Google Scholar]
- 40. Gann PH, Ma J, Giovannucci E, Willett W, Sacks FM, Hennekens CH, et al. Lower prostate cancer risk in men with elevated plasma lycopene levels: results of a prospective analysis. Cancer Res. 1999;59:1225–30. [PubMed] [Google Scholar]
- 41. Giovannucci E, Ascherio A, Rimm EB, Stampfer MJ, Colditz GA, Willett WC. Intake of carotenoids and retinol in relation to risk of prostate cancer. J Natl Cancer Inst.1995;87:1767–76. [DOI] [PubMed] [Google Scholar]
- 42. Mettlin C, Selenskas S, Natarajan N, Huben R. Beta-carotene and animal fats and their relationship to prostate cancer risk. A case-control study. Cancer. 1989;64:605–12. [DOI] [PubMed] [Google Scholar]
- 43. Bosetti C, Talamini R, Montella M, Negri E, Conti E, Franceschi S, et al. Retinol, carotenoids and the risk of prostate cancer: a case-control study from Italy. Int J Cancer. 2004;112:689–92. [DOI] [PubMed] [Google Scholar]
- 44. Norrish AE, Jackson RT, Sharpe SJ, Skeaff CM. Prostate cancer and dietary carotenoids. Am J Epidemiol. 2000;151:119–23. [DOI] [PubMed] [Google Scholar]
- 45. Nomura AM, Stemmermann GN, Lee J, Craft NE. Serum micronutrients and prostate cancer in Japanese Americans in Hawaii. Cancer Epidemiol Biomarkers Prev. 1997;6:487–91. [PubMed] [Google Scholar]
- 46. Agalliu I, Kirsh VA, Kreiger N, Soskolne CL, Rohan TE. Oxidative balance score and risk of PCa: results from a case-cohort study. Cancer Epidemiol. 2011;35:353–61. 10.1016/j.canep.2010.11.002 [DOI] [PubMed] [Google Scholar]
- 47. Cohen JH, Kristal AR, Stanford JL. Fruit and vegetable intakes and PCa risk. J Natl Cancer Inst. 2000;92:61–8. [DOI] [PubMed] [Google Scholar]
- 48. Deneo-Pellegrini H, De Stefani E, Ronco A, Mendilaharsu M. Foods, nutrients and PCa: a case-control study in Uruguay. Br J Cancer. 1999;80:591–7. [DOI] [PMC free article] [PubMed] [Google Scholar]
- 49. Hsing AW, Comstock GW, Abbey H, Polk BF. Serologic precursors of cancer. Retinol, carotenoids, and tocopherol and risk of PCa. J Natl Cancer Inst. 1990;82:941–6. [DOI] [PubMed] [Google Scholar]
- 50. Jain MG, Hislop GT, Howe GR, Ghadirian P. Plant foods, antioxidants, and PCa risk: findings from case-control studies in Canada. Nutr Cancer. 1999;34:173–84. [DOI] [PubMed] [Google Scholar]
- 51. Karppi J, Kurl S, Nurmi T, Rissanen TH, Pukkala E, Nyyssonen K. Serum lycopene and the risk of cancer: the Kuopio Ischaemic Heart Disease Risk Factor (KIHD) study. Ann Epidemiol. 2009;19:512–8. 10.1016/j.annepidem.2009.03.017 [DOI] [PubMed] [Google Scholar]
- 52. Lu QY, Hung JC, Heber D, Go VL, Reuter VE, Cordon-Cardo C, et al. Inverse associations between plasma lycopene and other carotenoids and PCa. Cancer Epidemiol Biomarkers Prev. 2001;10:749–56. [PubMed] [Google Scholar]
- 53. Meyer F, Bairati I, Fradet Y, Moore L. Dietary energy and nutrients in relation to preclinical PCa. Nutr Cancer. 1997;29:120–6. [DOI] [PubMed] [Google Scholar]
- 54. Daviglus ML, Dyer AR, Persky V, Chavez N, Drum M, Goldberg J, et al. Dietary beta-carotene, vitamin C, and risk of PCa: results from the Western Electric Study. Epidemiology. 1996;7:472–7. [PubMed] [Google Scholar]
- 55. Druesne-Pecollo N, Latino-Martel P, Norat T, Barrandon E, Bertrais S, Galan P, et al. Beta-carotene supplementation and cancer risk: a systematic review and metaanalysis of randomized controlled trials. Int J Cancer. 2010;127:172–84. 10.1002/ijc.25008 [DOI] [PubMed] [Google Scholar]
- 56. Di Mascio P, Kaiser S, Sies H. Lycopene as the most efficient biological carotenoid singlet oxygen quencher. Arch Biochem Biophys. 1989;274:532–8. [DOI] [PubMed] [Google Scholar]
- 57. Etminan M, Takkouche B, Caamano-Isorna F. The role of tomato products and lycopene in the prevention of PCa: a meta-analysis of observational studies. Cancer Epidemiol Biomarkers Prev. 2004;13:340–5. [PubMed] [Google Scholar]
- 58. Rafi MM, Kanakasabai S, Reyes MD, Bright JJ. Lycopene modulates growth and survival associated genes in PCa. J Nutr Biochem. 2013;24:1724–34. 10.1016/j.jnutbio.2013.03.001 [DOI] [PubMed] [Google Scholar]
- 59. Yang CM, Lu YL, Chen HY, Hu ML. Lycopene and the LXRalpha agonist T0901317 synergistically inhibit the proliferation of androgen-independent PCa cells via the PPARgamma-LXRalpha-ABCA1 pathway. J Nutr Biochem. 2012;23:1155–62. 10.1016/j.jnutbio.2011.06.009 [DOI] [PubMed] [Google Scholar]
- 60. Zu K, Mucci L, Rosner BA, Clinton SK, Loda M, Stampfer MJ, et al. Dietary lycopene, angiogenesis, and PCa: a prospective study in the prostate-specific antigen era. J Natl Cancer Inst. 2014;106:djt430 10.1093/jnci/djt430 [DOI] [PMC free article] [PubMed] [Google Scholar]
- 61. van Poppel G, Goldbohm RA. Epidemiologic evidence for beta-carotene and cancer prevention. Am J Clin Nutr. 1995;62:1393S–402S. [DOI] [PubMed] [Google Scholar]
- 62. Palozza P, Sestito R, Picci N, Lanza P, Monego G, Ranelletti FO. The sensitivity to beta-carotene growth-inhibitory and proapoptotic effects is regulated by caveolin-1 expression in human colon and PCa cells. Carcinogenesis. 2008;29:2153–61. 10.1093/carcin/bgn018 [DOI] [PubMed] [Google Scholar]
- 63. Watters JL, Gail MH, Weinstein SJ, Virtamo J, Albanes D. Associations between alpha-tocopherol, beta-carotene, and retinol and PCa survival. Cancer Res. 2009;69:3833–41. 10.1158/0008-5472.CAN-08-4640 [DOI] [PMC free article] [PubMed] [Google Scholar]
- 64. Murakoshi M, Takayasu J, Kimura O, Kohmura E, Nishino H, Iwashima A, et al. Inhibitory effects of alpha-carotene on proliferation of the human neuroblastoma cell line GOTO. J Natl Cancer Inst. 1989;81:1649–52. [DOI] [PubMed] [Google Scholar]
- 65. Murakoshi M, Nishino H, Satomi Y, Takayasu J, Hasegawa T, Tokuda H, et al. Potent preventive action of alpha-carotene against carcinogenesis: spontaneous liver carcinogenesis and promoting stage of lung and skin carcinogenesis in mice are suppressed more effectively by alpha-carotene than by beta-carotene. Cancer Res. 1992;52:6583–7. [PubMed] [Google Scholar]
- 66. Li C, Ford ES, Zhao G, Balluz LS, Giles WH, Liu S. Serum alpha-carotene concentrations and risk of death among US Adults: the Third National Health and Nutrition Examination Survey Follow-up Study. Arch Intern Med. 2011;171:507–15. 10.1001/archinternmed.2010.440 [DOI] [PubMed] [Google Scholar]
- 67. Rubin MA, Maher CA, Chinnaiyan AM. Common gene rearrangements in PCa. J Clin Oncol. 2011;29:3659–68. 10.1200/JCO.2011.35.1916 [DOI] [PMC free article] [PubMed] [Google Scholar]
- 68. Xue L, Mao X, Ren G, Stankiewicz E, Kudahetti SC, Lin D, et al. Chinese and Western PCas show alternate pathogenetic pathways in association with ERG status. Am J Cancer Res. 2012;2:736–44. [PMC free article] [PubMed] [Google Scholar]
- 69. Mao X, Yu Y, Boyd LK, Ren G, Lin D, Chaplin T, et al. Distinct genomic alterations in PCas in Chinese and Western populations suggest alternative pathways of prostate carcinogenesis. Cancer Res. 2010;70:5207–12. 10.1158/0008-5472.CAN-09-4074 [DOI] [PMC free article] [PubMed] [Google Scholar]
- 70. Shen Y, Lu Y, Yin X, Zhu G, Zhu J. KRAS and BRAF mutations in prostate carcinomas of Chinese patients. Cancer Genet Cytogenet. 2010;198:35–9. 10.1016/j.cancergencyto.2009.12.003 [DOI] [PubMed] [Google Scholar]
Associated Data
This section collects any data citations, data availability statements, or supplementary materials included in this article.
Supplementary Materials
(DOC)
(DOCX)
Data Availability Statement
All relevant data are within the paper and its Supporting Information files.