

Abstract
Two label-free molecular imaging techniques, confocal Raman microscopy (CRM) and secondary ion mass spectrometry (SIMS), are combined for in situ characterization of the spatiotemporal distributions of quinolone metabolites and signaling molecules in communities of the pathogenic bacterium Pseudomonas aeruginosa. Dramatic molecular differences are observed between planktonic and biofilm modes of growth for these bacteria. We observe patterned aggregation and a high abundance of N-oxide quinolines in early biofilms and swarm zones of P. aeruginosa, while the concentrations of these secreted components in planktonic cells and agar plate colonies are below CRM and SIMS detection limits. CRM, in conjunction with principal component analysis (PCA) is used to distinguish between the two co-localized isomeric analyte pairs 4-hydroxy-2-heptylquinoline-N-oxide (HQNO)/2-heptyl-3-hydroxyquinolone (PQS) and 4-hydroxy-2-nonylquinoline-N-oxide (NQNO)/2-nonyl-hydroxyquinolone (C9-PQS) based on differences in their vibrational fingerprints, illustrating how the technique can be used to guide tandem-MS and tandem-MS imaging analysis. Because N-oxide quinolines are ubiquitous and expressed early in biofilms, these analytes may be fundamentally important for early biofilm formation and the growth and organization of P. aeruginosa microbial communities. This study underscores the advantages of using multimodal molecular imaging to study complex biological systems.
1. Introduction
Mass spectrometry imaging (MSI) and confocal Raman microscopy (CRM) are powerful analytical platforms for studying complex biological systems in situ at the molecular level. CRM enables non-destructive characterization of biomolecules based upon their vibrational fingerprints, while MSI uses a focused microprobe to generate position-specific ion maps for identification and characterization through mass-to-charge (m/z) and fragmentation profiles.1,2 Unlike many conventional chemical imaging modalities, such as fluorescence microscopy and positron emission tomography, MSI and CRM require no a priori knowledge about chemical composition, and sample perturbations engendered by staining or genetic label incorporation are avoided.3,4 Multimodal imaging approaches that combine MSI and CRM have proven advantageous for study of biological systems, generating information that is difficult or impossible to obtain with a single technique alone.5,6 Our laboratories have employed time-of-flight (ToF) secondary ion mass spectrometry (SIMS) and CRM to study lignin and cellulose distributions in the perennial grass Miscanthus x giganteus,7 and matrix assisted laser desorption ionization (MALDI) and CRM to characterize the distribution of lipids and peptides across 3-D cell cultures,8 while Zenobi and coworkers have successfully correlated Raman and MALDI to study isolated algal cells.9
We have previously employed correlated CRM and MSI to study the environmentally ubiquitous gram-negative bacterium Pseudomonas aeruginosa.10 P. aeruginosa is an opportunistic pathogen for both plants and humans and is responsible for approximately 8% of the healthcare associated infections each year.11 Among the commonly infected are burn victims and the immuno-compromised, such as cystic fibrosis patients.12 Once an infection is established it is difficult to eradicate, as P. aeruginosa is highly resistant to both antibiotics and the body’s natural immune response.13–15 The prevalence and resilience of P. aeruginosa is largely a result of its complex lifecycle. Under many conditions, these organisms cooperate to remodel their environment, resulting in the secretion of a protective scaffolding of DNA, proteins, polysaccharides, small molecule metabolites, and other extracellular polymeric substances (EPS) termed a biofilm.16,17
Cooperative behavior, and biofilm formation itself, are largely dependent upon an intercellular communication system, called quorum sensing (QS), in which individual cells differentially produce and sequester a diverse array of molecules.18,19 Achieving a threshold concentration of QS molecules results in the up- or down-regulation of target genes, leading to phenotypical differentiation and the manifestation of specific behavioral patterns such as flagella driven surface motility and surface colonization. Particularly prominent among the molecules involved in the P. aeruginosa QS system are the quinolone class of small-molecule secondary metabolites, which have been implicated in a wide array of biological functions including virulence and biofilm formation.17,18
The vast majority of the information about the role of chemical messengers in microbial organization has been obtained from spatially integrated studies of secreted and diffused components and genetic level manipulations. In contrast, here we apply CRM and SIMS imaging to study the spatial and temporal organization of quinolones in emerging P. aeruginosa microbial communities, with a specific focus on three modes of growth: colonies on agar plates, free-floating planktonic cells, and static biofilms. We show here for the first time the use of tandem MS SIMS imaging to image quinolone isomers, we have created enhanced statistical approaches to identify specific quinolones in the CRM data, and we combined these approaches to perform in situ studies of co-localized isomeric analytes in dynamic biological systems. Our CRM and tandem MSI results show a high abundance of distinctly localized N-oxide quinolines in the early biofilms and swarm samples, indicating their potential importance in the development of these surface-attached communities of bacteria. Furthermore, we show how CRM, a non-invasive analytical technique, can be used to guide MS analysis, especially for in situ studies of isomeric analytes, which are difficult or impossible to differentiate with either CRM or MS alone. Our studies demonstrate how the combination of MSI and CRM can provide unambiguous spatially resolved chemical characterization of complex systems and generate information important to the understanding of the collective microbiology of these organisms in biomedically-relevant settings.
2. Materials and Methods
2.1. Materials
Silicon substrates were purchased from WRS Materials (San Jose, CA) as 3 in diameter (100) Si wafers, and they were scored and broken into 2 cm × 2 cm tiles before use. Quinolone standards, 2-heptyl-3-hydroxy-4(1H)-quinolone (Pseudomonas quinolone signal, PQS) and 2-heptyl-4-quinolone (HHQ), were purchased from Sigma-Aldrich (St Louis, MO), while HQNO was purchased from Enzo Life Sciences (Farmingdale, NY) and Cayman Chemicals (Ann Arbor, MI). The standards were dissolved in either HPLC-grade ethanol or methanol (Sigma-Aldrich), then deposited and air-dried on clean Si wafers for SIMS and CRM measurements.
2.2. Static biofilm and swarm plate assays
Pseudomonas aeruginosa strain (PAO1C) was used in all experiments. Bacterial colonies were grown on Lysogeny Broth (LB) agar plates by inoculating the plate with bacterial cells from a glycerol stock. The cells were gently streaked on the LB agar plates using a sterile inoculation loop. The inoculated plates were incubated for 18 hours at 37°C. Cell cultures were grown overnight at 37 °C with shaking at 240 rpm in modified fastidious anaerobe broth (FAB) culture medium supplemented with 30 mM filter sterilized glucose solution as the carbon source. To grow static biofilms, 200 μL of overnight broth culture (OD = 1 at 600 nm) was pipetted onto a 2 cm × 2 cm sterilized Si tile placed in a Petri dish (each Petri dish holding three tiles). After allowing 10–15 min for bacterial attachment, the inoculated Si tiles were immersed in 18 mL of fresh FAB medium containing 450 μL of 1.2 M glucose and incubated at 37 °C until the desired growth time had elapsed. The tiles containing bacterial growth were carefully removed from the petri dish with sterile tweezers and allowed to dry for ~1 h in a hood. When indicated, P. aeruginosa overnight broth culture (source of planktonic cells) and colonies from LB agar plates were transferred to sterile Si tiles and dried prior to analysis. Both dried and hydrated static biofilm samples were analyzed in parallel with CRM to ensure that the observed analyte morphology is not due to sample drying effects, while MSI was conducted exclusively on dried samples. No notable differences in analyte morphology or distribution were observed between dried and hydrated samples.
For CRM imaging under swarm motility conditions, 0.9 g of noble agar was added to 200 mL of FAB media containing 2 g/L (NH4)2SO4. The FAB-agar mixture was autoclaved, cooled to 50 °C, and 2 mL of sterile 1.2 M glucose was added while stirring at room temperature. Sterile medium (7.5 mL) was gently pipetted into 60 mm polystyrene Petri dishes and allowed to cure for 30 min. After drying, the plates were stab-inoculated with an overnight FAB-glucose broth culture (OD = 1 at 600 nm) and incubated at 30 °C for 48 h.20
2.3. Confocal Raman Microscopy (CRM)
Raman imaging was performed using a confocal Raman microscope (Alpha 300R, WITec, GMBH, Germany), equipped with a 532 nm doubled Nd:YAG excitation laser. The laser radiation was delivered to the microscope using a polarization preserving single-mode optical fiber, deflected through a dichroic beam-splitter and focused onto the sample through the microscope objective. The Raman scattered radiation was collected using the same objective and delivered through a 50 μm diameter multi-mode fiber to a UHTS 300 spectrometer equipped with a 600 groove mm−1 grating and a back-illuminated CCD camera (Newton DU970 N-BV, Andor Inc., cooled to −60 °C). Raman images from biofilms were acquired using a coverslip corrected Nikon water immersion 60x objective (NA=1) while a 40x air objective (NA=0.6) was used to image swarm plates. Images were obtained by acquiring a full Raman spectrum from each image pixel (100×100 or 80×80 pixels) over a desired region on the sample with an integration time of 100 ms/spectrum. Data processing software WITec Project 2.10 was used to remove cosmic ray spikes from Raman images. Principal component analysis was performed on the Raman images in MATLAB using previously established procedures.
2.4. Secondary Ion Mass Spectrometry (SIMS)
The dried samples were subjected to mass-to-charge (m/z) analysis using a custom hybrid MALDI/C60-SIMS Q-TOF mass spectrometer, which has been described in detail elsewhere.22 Briefly, this instrument is a modified QTOF XL (AB SCIEX, Framingham, MA) equipped with a 20 kV DC Buckminsterfullerene (C60) primary ion beam and a UV laser for C60-SIMS and MALDI, respectively. All experiments described in this manuscript were conducted using the singly charged C60+ ion beam with a sample current of either 300 pA (40 μm diameter spot) for whole film imaging or 100 pA (15 μm diameter spot) for targeted imaging. Whole film imaging was conducted in raster mode with a 200 μm × 200 μm pixel size and a collection time of 656 ms/pixel, while targeted imaging utilized a 21 μm × 21 μm pixel size and a collection time of 101 ms/pixel. For both operating conditions the spectrometer was set to measure positive secondary ions from m/z 60–300 with a Q1 transmission bias of 15% at m/z 60, 35% at m/z 120, and 50% at m/z 200. Mass calibration was performed using In1–7+ ions. Data were acquired using Analyst v1.2 and oMALDI Server v5.1 (AB SCIEX) and converted from wiff to img format at 20 data points per m/z value. Post conversion analysis of the TIC normalized or raw images (as indicated in the text) was performed in BioMap (Novartis, Switzerland) with voxelated rainbow color map intensities manually chosen to accentuate inter- and intra-film intensity differences. In situ tandem MS and targeted tandem MSI was performed at unit resolution with 15–30 eV in argon collision gas, and molecular assignments were made by fragmentation comparison to analytical standards (where available) and published literature.
2.5. Secondary Electron Microscopy (SEM)
Dry samples were sputter coated (Desk II TSC Turbo Sputter Coater, Denton Vacuum, Morristown, NJ, USA) in Au/Pd for 70 s at 40 % power (estimated thickness of 7 nm). Subsequently, SEM (Philips XL30 ESEM-FEG, FEI Company, Amsterdam, Netherlands) images were acquired with a 5 kV electron beam energy and a 5 mm working distance.
3. Results and Discussion
3.1. Survey of Quinolones
Four conditions were chosen to characterize microbial community development, namely bacterial plate micro-colonies, planktonic cells, 7-h and 48-h biofilms, and each sample was subjected to analysis by both SIMS and CRM imaging. Manually probing the cells with SIMS revealed that the 7-h biofilm mass spectrum exhibits prominent peaks at m/z 244.18, 260.18, 270.20, 272.21, 286.19, 288.21, and 298.23, which have been previously assigned to 2-alkyl-4-(1H) quinolines (AQ) MH+ ions and are confirmed here with tandem MS (Table 1 and Figure S1, Supplemental Information).10,23,24 The observed ions fall into three molecular classes, specifically 2-heptyl-4-quinoline (HHQ)-derived (m/z 244.18, 270.20, and 272.21), 2-heptyl-3-hydroxyquinolone (PQS)-derived (m/z 260.18 and 288.21), and 4-hydroxy-2-heptylquinoline-N-oxide (HQNO)-derived (m/z 260.18, 286.19 and 288.21) ions. Among these compounds, the isomeric pairs PQS/HQNO and C9-PQS/NQNO both appear in the 7-h biofilm based upon tandem-MS fragmentation patterns (Figure S1, Supplemental Information). The 48-h biofilm showed a nearly identical set of tandem-MS spectra for the AQ ions (data not shown), while AQ ion intensities from the LB micro-colonies and FAB overnight broth culture were too low to characterize using tandem-MS fragmentation.
Table 1.
4-hydroxy-2-alkylquinolines observed in 7-h P. aeruginosa biofilms
| Compound ID | Molecular formula | [M+H]+ expected | [M+H]+ observed | In situ tandem MS fragments | |
|---|---|---|---|---|---|
| expected | observed | ||||
| HHQ (2-heptyl-4-quinoline) | C16H21NO | 244.17 | 244.17 | 159.07, 172.08 | 159.08, 172.09 |
| PQS (2-heptyl-3-hydroxyquinolone)* | C16H21NO2 | 260.17 | 260.18 | 175.06, 188.07 | 175.08, 188.09 |
| HQNO (4-hydroxy-2-heptylquinoline-N-oxide) | C16H21NO2 | 260.17 | 260.18 | 159.07, 172.08, 186.09 | 159.08, 172.08, 186.10 |
| C9:1-NHQ (2-nonenyl-4-quinoline) | C18H23NO | 270.19 | 270.20 | 159.07, 172.08, 184.07 | 159.07, 172.08, 184.08 |
| NHQ (2-nonyl-4-quinoline) | C18H25NO | 272.20 | 272.21 | 159.07, 172.08 | 159.07, 172.08 |
| C9:1-NQNO (4-hydroxy-2-nonenylquinoline-N-oxide) | C18H23NO2 | 286.18 | 286.19 | 159.07, 172.08, 184.07, 198.07 | 159.07, 172.08, 184.08, 198.10 |
| C9-PQS (2-nonyl-hydroxyquinolone)* | C18H25NO2 | 288.20 | 288.21 | 175.06, 188.07 | 175.08, 188.09 |
| C9-NQNO (4-hydroxy-2-nonylquinoline-N-oxide) | C18H25NO2 | 288.20 | 288.21 | 159.07, 172.08, 186.09 | 159.08, 172.08, 186.10 |
| C11:1-UHQ (2-undecenyl-4-quinoline) | C20H27NO | 298.22 | 298.23 | 159.07, 172.08, 184.07 | 159.07, 172.08, 184.08 |
Low abundance/minor component of spectrum
3.2. Global SIMS Imaging of P. aeruginosa
The microbial communities were further imaged by C60-SIMS, the results of which are displayed in the false-color ion maps of Fig. 1. The microcolony mass spectrum, Fig. 1(a) is low in abundance (20 counts) and dominated by background ions from the LB medium (m/z 260.88 and 282.89), and the corresponding AQ ion image intensities are near the detection threshold. The prominent ions observed in the overnight culture (m/z 266.89 and 282.89, Fig. 1(b)) arise from the culture medium, while ion images reveal that HHQ (m/z 244.18) and NHQ (m/z 272.21) are present in low amounts. Overnight culture ions m/z 244.18 and 272.21 are beneath the threshold for tandem-MS fragmentation analysis; therefore their presence is confirmed by mass-match alone. The 7-h biofilm SIMS spectrum, Fig. 1(c), is dominated by AQs in the m/z 240–300 range, with an approximate 100-fold and 10-fold increase in ion count over the LB micro-colonies and FAB overnight broth culture, respectively. Ion images reveal a macroscopically uniform distribution of observed AQs, with the highest abundance for the N-oxide quinoline C9:1-NQNO and the C9-PQS/NQNO isomers. In agreement with previous studies of 72-h biofilms, the 48-h biofilms exhibit a quinolone profile with aggregation primarily localized near the biofilm edge.10 The microcolony images in Fig. 1(a) show a diffuse ion distribution with AQ ion abundances comparable to those observed on bare silicon, suggesting that the low abundance ions are at, or below, the limit of detection (LOD). Taken together, these data suggest that initial biofilm formation is marked by a dramatic increase in the production of select AQs, with a preferential accumulation of those with a 9-carbon side-chain.
Figure 1.

Secondary ion mass spectrometry reveals dramatic differences in 4-hydroxy-2-alkylquinoline (AQ) abundance in different states of P aeruginosa organization (a) micro-colonies on LB, (b) planktonic cell culture, and (c) biofilm grown for 7 h Spectra are an average of four pixels from representative regions of the samples (as indicated by the red arrows), AQs are observed as protonated MH+ ions, and ion images are normalized to the total ion count (TIC) The TIC images include values in the m/z 60–300 range, scaled from 0 to 5 counts, while the individual ion images are scaled as indicated by color bars to the right of each row.
The development-based variability in AQ expression may be the result of a number of factors, including changes in phenotypical expression and variability in the supply of nutrients.25 Over 50 AQs, including those examined here, have been observed in bulk studies of P. aeruginosa PA14 cell culture using LC-MS,24 therefore the AQ molecules detected here with SIMS are likely only those that are sufficiently spatially accumulated to rise above the C60-SIMS LOD. Ion images for C9:1-NHQ and C11:1-UHQ (not displayed) show similar global distributions.
3.3. CRM and Targeted SIMS Imaging of Static Biofilms
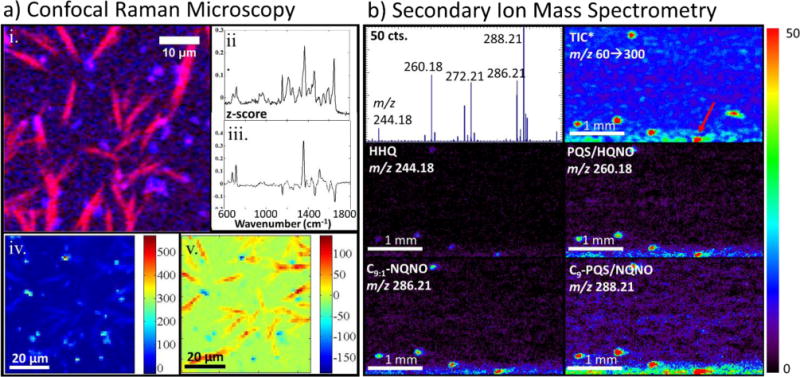
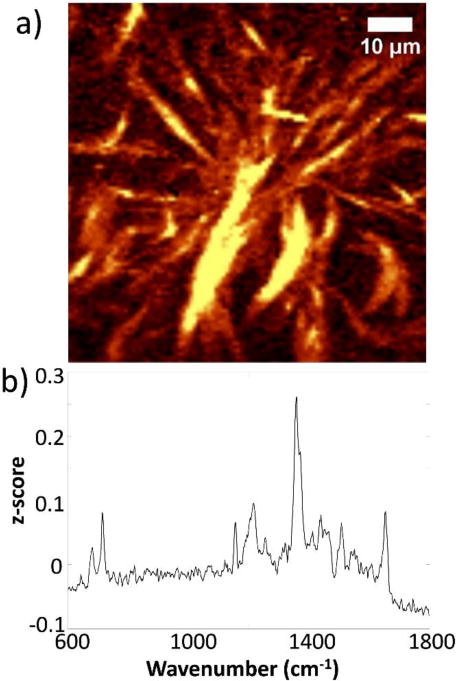
In 7-h biofilms, a high abundance of morphologically distinct structures are observed with bright field microscopy, one of which can be seen in image (i) of Fig. 2(a). In agreement with the SIMS results of Fig. 1(c), Raman spectra acquired from these regions exhibit a strong band at 1357 cm−1, which is attributed to the quinolone ring stretch.26 Other observed vibrations are related to the quinolone ring, including –CH bending/twisting and C-O stretching centered at ~1205 cm−1, pyridine ring stretch vibrations in the 1550–1600 cm−1 region, as well as the symmetric ring breathing vibrations of the aromatic ring at ~715 cm−1.27,28 Raman image (ii) was generated from a region within (i) and integrated over the 1338–1376 cm−1 window which includes the quinolone ring stretch. Principal component analysis (PCA) was performed on this region, and the first chemically significant principal component, PC3, exhibits high z-score features at 679, 715, 1205, 1357, 1435, and 1511 cm−1 in the loading plot (iii), a pattern of features that strongly resembles the bands in the spectrum of HQNO standard (Supplemental Information, Fig. S3 (i)), The congruence between the HQNO standard spectrum and the PC3 loading plot from the in situ image indicates that the distinct structures, as seen in image (iv), in 7 h biofilms arise from N-oxide quinolines.
Figure 2.

(a) Bright field microscopy and CRM, and (b) targeted SIMS imaging and microspectroscopy of a 7-h P aeruginosa biofilm (a) (i) Bright field microscopy of a quinoline rich region found in 7-h static biofilms (ii) Raman image acquired from the circled region in (i) and integrated over 1338–1376 cm−1 (iii) PC3 from the Raman image (iv) heat map showing the spatial distribution and magnitude of PC3 (b) SIMS imaging of regions of high AQ abundance Inset regions with variable color map intensity show that patterning is present for most AQs, however the intensity differences are most pronounced for the isomeric C9-PQS/NQNO ion at m/z 28821 The mass spectrum is an average of four pixels from a representative high-intensity region of the TIC image (as indicated by the red arrow) The TIC images include values in the m/z 60–300 range, scaled from 0 to 2 counts, while the individual ion images are scaled as indicated by the color bar on the right.
While HQNO and PQS standard spectra are used to assign an identity to the secreted components present in these quinolone/N-oxide quinoline rich regions, it is not possible to distinguish between AQs possessing the same functional group, but with alkyl chains of different lengths or degree of unsaturation, e.g. PQS and C9-PQS, from CRM data alone. Images displaying these AQs require mass spectrometric data for a definitive assignment. Thus, guided by the microscopic spatial heterogeneity in AQ abundances observed by CRM, 7-h P. aeruginosa biofilms were subjected to targeted analysis with C60-SIMS. As can be seen in the representative ion images of Fig. 2(b), a series of high intensity regions are found distributed across the entire colony surface. The mass spectra of these regions are predominantly composed of AQ MH+ ions, and although all detected quinolones appear to be enriched to some degree, m/z 288.21 (C9-PQS/NQNO) and m/z 286.21 (C9:1-NQNO) are the predominant contributors. The ion images also reveal that AQs are present in the interstitial areas, albeit at lower abundance. For example, a line scan across six of the rich regions shows that the intensity of m/z 288.21 changes from 440 (± 2% standard deviation) to 280 (± 7%), or 36 (± 1)% between peak and trough (Fig. S2, Supplemental Information).
Similar CRM analysis of quinolone accumulations in 48-h static biofilms, Fig. 3(a), reveals that, in addition to N-oxide quinolines from the HQNO family, co-localized quinolones from the PQS family are also present in visually and spectrally distinct regions near the film edge. For example, PC2 (Fig. 3(a)–ii) contains features with peaks at 1369, 1461, 1556, and 1591 cm−1 that strongly correlate with bands from the spectrum of PQS standard (Fig. S3(ii), Supplemental Information) while PC3 (Fig. 3(a)–iii) exhibits features with peaks at 679, 715, 1205, 1357, 1435, and 1511 cm−1, that match bands from the standard spectrum of HQNO. The most distinct difference between the spectra of HQNO and PQS is the quinolone ring stretch, which occurs at ~1357 cm−1 in HQNO, while in PQS this band is shifted to ~1369 cm−1. The two secreted components are clearly differentiated by the distinct features in the loading plots, cf. Figs. 3(a)–ii and iii, which correspond to vibrational bands in the respective Raman spectra of the standard compounds and by the anti-correlated intensities in the heat maps of PC2 and PC3, cf. Figs. 3(a)–iv and v.
Figure 3.
CRM (a) and targeted SIMS (b) imaging and microspectroscopy of a representitve region of a 48-hour P aeruginosa biofilm (a) (i) Composite Raman image acquired from the edge of a 48-h static biofilm constructed from images integrated over 1338–1376 cm−1 (pink) and 1638–1676 cm−1 (blue) show the co-location of two distinct chemical entities within the same region (ii) PC2 and (iii) PC3 contain features resembling bands of PQS and HQNO standards, respectively heat maps of PC2 (iv) and PC3 (v) (b) SIMS images at lower resolution reveal that the central regions of the 48-h films are mostly devoid of the high intensity regions, with the AQs primarily confined to the colony boundary The mass spectrum is an average of four pixels from a high-intensity region of the film (as indicated by the red arrow) The TIC images include values in the m/z 60–300 range, scaled from 0 to 2 counts, while the individual ion images are scaled as indicated by the color bar on the right.
Subsequent SIMS analysis of a similar region near the edge of the 48-h biofilm, Fig. 3(b), shows a ~10-fold reduction in AQ ion intensity when compared to the 7-h biofilm, Fig. 2(b). Although the C9-PQS/HQNO isomer is still the most abundant ion, the PQS/HQNO ion at m/z 260.18 is observed with a much higher relative abundance than in the 7-h film. Furthermore, the center of the film is all-but devoid of AQs, which are primarily confined to the film boundary. The appearance of high intensity ions near the colony edge in the low resolution SIMS images generally correlates with a thinner biofilm and may reflect either analyte migration during the drying process or natural variability in EPS composition.
3.4. SIMS Imaging of Isomeric Species
The surprising observation of discrete regions of high N-oxide quinoline abundance by CRM in the 7-h biofilm inspired the development of tandem MSI methods targeting the PQS/HQNO and C9-PQS/NQNO isomeric pairs at m/z 260.18 and m/z 288.21 respectively. Tandem MSI methods were employed to examine adjacent regions of the microbial community to probe for the parent ions ion as well as characteristic fragments of the PQS (m/z 175.08, and 188.10) and N-oxide (m/z 159.08 and m/z 172.09) families, Fig. 4. Ion images for the C9-PQS/NQNO precursor ion at m/z 288.21, Fig. 4(a) show the same microscopic pattern as in the MSI of Fig. 2, as do the images from the NQNO fragment at m/z 159.08. This is in contrast to the most abundant C9-PQS fragment at m/z 175.07, which is near the lower abundance limit of our imaging capabilities and shows no discernable microscopic patterning. This result is in agreement with the product ion images acquired through fragmentation of m/z 260.18, Fig. 4(b), which shows microscopic patterning for m/z 260.18 and the HQNO specific fragment at 159.08 and low abundance for the PQS specific fragment at 175.08. These results support the tentative conclusions based on the CRM analysis above, indicating that although all four analytes are present, the primary contributions to the early biofilm SIMS spectrum at m/z 260.18 and m/z 288.21 are the N-oxide constituents of the PQS/HQNO and C9-PQS/NQNO isomeric pairs.
Figure 4.

SIMS product ion spectra and images near the edge of a 7-hr biofilm (a) Tandem MS of m/z 288 reveals prominent fragments at m/z 15908, 17209, and 18610 (red), which correspond to alkyl chain loss and rearrangement from the protonated N-oxide quinoline precursor, NQNO Characteristic fragments for C9-PQS (blue) are also observable at m/z 17507 and 18808, although at a much lower intensity Product ion images for the NQNO fragment (m/z 15908) reveal microscopic patterning, while those for C9-PQS do not (b) Tandem MS of m/z 260 reveals a similar fragmentation pattern, with prominent HQNO fragments (red) observable at m/z 15908, 17209, and m/z 18610, and minor contributions from the PQS fragments (blue) at m/z 17507 and 18808 Microscopic patterning is observed for the NQNO fragment, but not the PQS fragment.
3.5. Secondary Electron Microscopy for EPS Characterization
The distinct spatial heterogeneity in AQ distribution observed with CRM and SIMS, especially in the 7-h biofilms, raises obvious questions about the correlation between morphological and chemical features in the biofilms. Therefore, a 7-h biofilm was studied by scanning electron microscopy, which revealed that regions of high AQ abundance are morphologically distinct from the adjacent low intensity regions. Figure 5(a) shows that SEM micrographs of the 7-h biofilms exhibit a pattern of dark areas across the colony surface, the size and shape of which match the quinolone localization profiles observed with SIMS and CRM. Upon closer inspection, cf. Figs. 5(b) and (c), the cells in the dark regions of the film are encased in a thick material (left side of Fig 5 (c)), while the surrounding regions are relatively barren and more exposed to the surrounding environment. Dark and light regions in the SEM micrograph indicate regions of low and high electron emission, respectively, which further supports an interpretation of the CRM and SIMS images in terms of a heterogeneous chemical distribution.29 It is possible that these regions represent nucleation sites for the local onset of biofilm attachment or EPS production.
Figure 5.

Scanning electron microscopy of early biofilms shows morphological patterning of the EPS across the colony surface The rod-shapes are individual P aeruginosa cells The box in (a) and the arrow in (b) indicates the location of images b and c, respectively Scale bars are 500, 100, and 5 μm for a, b, and c.
3.6. CRM Imaging of Swarm Zones
Moving beyond the inoculated Si wafer constructs, high density aggregations of quinolones and N-oxide quinolines were also observed within surface motile communities of swarming P. aeruginosa after 48 h. PC analysis of the full dataset used to produce the Raman image in Fig. 6(a) generated a PC1 loading plot, Fig. 6(b) that contains features resembling bands of both PQS and HQNO. Features at 682 and 718 cm−1 are at the same position as bands from the spectrum of HQNO standard, while features with peaks at 1553 and 1654 cm−1 match bands from the spectrum of the PQS standard. The broad feature at ~1359 cm−1 appears to be a combination of closely spaced features in the 1350–1400 cm−1 regime, which is tentatively assigned to contributions from the quinolone ring vibration of both N-oxide quinolines and 3-hydroxy-4-quinolones, indicating that these analytes are highly co-localized and thus contribute to the same principal component, PC1. The observation that similar quinolone accumulations occur both in static biofilms and within swarm zones highlights the dichotomy between surface motility and biofilm formation. The quinolones and quinolines tend to accumulate in regions where the cells have colonized the surface and may have begun forming stationary biofilms, as opposed to the advancing swarm edge where the cells are actively motile.29,30
Figure 6.
(a) Raman image acquired from a 48 h swarm plate constructed from a 1338–1376 cm−1 filter to include the marker band for quinolones/quinolines (b) Loading plot of PC1 generated from analysis of the Raman image of the 48 h swarm plate PC1 contains features that correspond to bands from both PQS and HQNO standard spectra.
CONCLUSIONS
In this work a combination of SIMS and CRM imaging was used to characterize the spatial distribution of several quinolone quorum sensing molecules and quinoline secondary metabolites across the surface of P. aeruginosa throughout various states of organization. CRM in conjunction with PCA was first used to identify broad molecular classes, e.g. quinolones and quinolines, and this information was used to guide mass spectrometric analysis. This multimodal approach allowed for the conclusion that the primary AQs belong to the N-oxide family as opposed to the isomeric PQS family at 7-h of biofilm growth. This is in contrast with 48-h biofilms, which are marked by a dramatic decrease in the quantity of all AQs and a shift from the N-oxide family towards the PQS family, with co-localization of the two species. These combined CRM/MSI experiments demonstrate how molecular information was obtained across several orders of magnitude in length, with distinct chemical distributions observed at length scales from a few micrometers to centimeters.
Our results demonstrate the efficacy of a combined MSI/CRM approach for characterization of complex biological systems and suggest an important role for N-oxide quinolines in early biofilm formation. We show that the transition from the planktonic state to the formation of a biofilm is marked by a dramatic increase in the presence of the N-oxide family of quinolines, and chemical similarities between swarming motility and early biofilms indicate conserved chemical expression across multiple phenotypical states. Furthermore, CRM and SIMS imaging in conjunction with electron microscopy reveal a dramatic patterning of highly localized biomolecules across the surface of 7-h biofilms, which correspond to areas of thick matrix composition.
Supplementary Material
Acknowledgments
This work was supported by the National Institute of Health grant 1R01AI113219-01, and the Department of Energy grant DE SC-0006642. The authors would like to thank the Springborn Endowment and the NSF Graduate Research Fellowship Program for additional financial support, Dr. Bin Li and Dr. Eric Lanni for helpful MSI discussion, as well as Dr. Scott Robinson and Dr. Cate Wallace in the Beckman Institute Imaging Technology Group, which is partially supported by the National Science Foundation grant DBI-9871103.
References
- 1.Rubakhin SS, Sweedler JV. Mass spectrometry imaging: Principles and protocols. Humana Press; New York: 2010. [Google Scholar]
- 2.Huang WE, Li M, Jarvis RM, Goodacre R, Banwart SA. In: Advances in Applied Microbiology. Allen IL, Sima S, Geoffrey MG, editors. Vol. 70. Academic Press; 2010. p. 153. [DOI] [PubMed] [Google Scholar]
- 3.McDonnell LA, Heeren RMA. Mass Spectrom Rev. 2007;26:606–643. doi: 10.1002/mas.20124. [DOI] [PubMed] [Google Scholar]
- 4.Petry R, Schmitt M, Popp J. ChemPhysChem. 2003;4:14–30. doi: 10.1002/cphc.200390004. [DOI] [PubMed] [Google Scholar]
- 5.Ilin Y, Kraft ML. Curr Opin Biotechnol. 2015;31:108–116. doi: 10.1016/j.copbio.2014.10.011. [DOI] [PMC free article] [PubMed] [Google Scholar]
- 6.Masyuko R, Lanni EJ, Sweedler JV, Bohn PW. Analyst. 2013;138:1924–1939. doi: 10.1039/c3an36416j. [DOI] [PMC free article] [PubMed] [Google Scholar]
- 7.Li Z, Chu L-Q, Sweedler JV, Bohn PW. Anal Chem. 2010;82:2608–2611. doi: 10.1021/ac100026r. [DOI] [PubMed] [Google Scholar]
- 8.Ahlf DR, Masyuko RN, Hummon AB, Bohn PW. Analyst. 2014;139:4578–4585. doi: 10.1039/c4an00826j. [DOI] [PubMed] [Google Scholar]
- 9.Fagerer SR, Schmid T, Ibanez AJ, Pabst M, Steinhoff R, Jefimovs K, Urban PL, Zenobi R. Analyst. 2013;138:6732–6736. doi: 10.1039/c3an01135f. [DOI] [PubMed] [Google Scholar]
- 10.Lanni EJ, Masyuko RN, Driscoll CM, Dunham SJB, Shrout JD, Bohn PW, Sweedler JV. Anal Chem. 2014;86:10885–10891. doi: 10.1021/ac5030914. [DOI] [PMC free article] [PubMed] [Google Scholar]
- 11.CDC. Pseudomonas aeruginosa in Healthcare Settings. [Online Early Access] Published Online: 2014. accessed 05/04/2015. [Google Scholar]
- 12.Lyczak JB, Cannon CL, Pier GB. Clin Microbiol Rev. 2002;15:194–222. doi: 10.1128/CMR.15.2.194-222.2002. [DOI] [PMC free article] [PubMed] [Google Scholar]
- 13.Stewart PS, William Costerton J. The Lancet. 2001;358:135–138. doi: 10.1016/s0140-6736(01)05321-1. [DOI] [PubMed] [Google Scholar]
- 14.Høiby N, Ciofu O, Bjarnsholt T. Future Microbiol. 2010;5:1663–1674. doi: 10.2217/fmb.10.125. [DOI] [PubMed] [Google Scholar]
- 15.Antibiotic Resistance Threats in the United States. Centers for Disease Control and Prevention. Atlanta, GA: 2013. http://wwwcdcgov/drugresistance/pdf/ar-threats-2013-508.pdf. [Google Scholar]
- 16.Singh PK, Schaefer AL, Parsek MR, Moninger TO, Welsh MJ, Greenberg EP. Nature. 2000;407:762–764. doi: 10.1038/35037627. [DOI] [PubMed] [Google Scholar]
- 17.Dubern J-F, Diggle SP. Mol BioSyst. 2008;4:882–888. doi: 10.1039/b803796p. [DOI] [PubMed] [Google Scholar]
- 18.Reen FJ, Mooij MJ, Holcombe LJ, McSweeney CM, McGlacken GP, Morrissey JP, O’Gara F. FEMS Microbiol Ecol. 2011;77:413–428. doi: 10.1111/j.1574-6941.2011.01121.x. [DOI] [PubMed] [Google Scholar]
- 19.De Kievit TR. Environ Microbiol. 2009;11:279–288. doi: 10.1111/j.1462-2920.2008.01792.x. [DOI] [PubMed] [Google Scholar]
- 20.Morales-Soto N, Anyan ME, Mattingly AE, Madukoma CS, Harvey CW, Alber M, Deziel E, Kearns DB, Shrout JD. J Vis Exp. 2015;98B:e52338. doi: 10.3791/52338. [DOI] [PMC free article] [PubMed] [Google Scholar]
- 21.Lanni E, Dunham SB, Nemes P, Rubakhin S, Sweedler J. J Am Soc Mass Spectrom. 2014;25:1897–1907. doi: 10.1007/s13361-014-0978-9. [DOI] [PubMed] [Google Scholar]
- 22.Lanni EJ, Masyuko RN, Driscoll CM, Aerts JT, Shrout JD, Bohn PW, Sweedler JV. Anal Chem. 2014;86:9139–9145. doi: 10.1021/ac5020222. [DOI] [PMC free article] [PubMed] [Google Scholar]
- 23.Lépine F, Milot S, Déziel E, He J, Rahme L. J Am Soc Mass Spectrom. 2004;15:862–869. doi: 10.1016/j.jasms.2004.02.012. [DOI] [PubMed] [Google Scholar]
- 24.Heeb S, Fletcher MP, Chhabra SR, Diggle SP, Williams P, Cámara M. FEMS Microbiol Rev. 2011;35:247–274. doi: 10.1111/j.1574-6976.2010.00247.x. [DOI] [PMC free article] [PubMed] [Google Scholar]
- 25.Neugebauer U, Szeghalmi A, Schmitt M, Kiefer W, Popp J, Holzgrabe U. Spectrochim Acta A Mol Biomol Spectrosc. 2005;61:1505–1517. doi: 10.1016/j.saa.2004.11.014. [DOI] [PubMed] [Google Scholar]
- 26.Wang Y, Yu K, Wang S. Spectrochim Acta A Mol Biomol Spectrosc. 2006;65:159–163. doi: 10.1016/j.saa.2005.09.043. [DOI] [PubMed] [Google Scholar]
- 27.Frosch T, Popp J. J Mol Struct. 2009:924–926. [Google Scholar]
- 28.Reimer L. Scanning Electron Microscopy. Vol. 45. Springer; Berlin Heidelberg: 1998. p. 207. [Google Scholar]
- 29.Shrout JD, Chopp DL, Just CL, Hentzer M, Givskov M, Parsek MR. Mol Microbiol. 2006;62:1264–1277. doi: 10.1111/j.1365-2958.2006.05421.x. [DOI] [PubMed] [Google Scholar]
- 30.Verstraeten N, Braeken K, Debkumari B, Fauvart M, Fransaer J, Vermant J, Michiels J. Trends Microbiol. 2008;16:496–506. doi: 10.1016/j.tim.2008.07.004. [DOI] [PubMed] [Google Scholar]
Associated Data
This section collects any data citations, data availability statements, or supplementary materials included in this article.