

Abstract
Sph, S1P, and Cer, derived from the membrane sphingolipids, act as intracellular and intercellular mediators, involved in various (path) physiological functions. Accordingly, determining the distributions and concentrations of these sphingolipid mediators in body tissues is an important task. Consequently, a method for determination of sphingolipids in small quantities of tissue is required. Sphingolipids analysis has been dependent on improvements in mass spectrometry (MS) technology. Additionally, decomposition of sphingosine-1-phosphate (S1P) in the tissue samples before preparation for MS has hindered analysis. In the present study, a method for stabilization of liver samples before MS preparation was developed using a heat stabilizer (Stabilizor™ T1). Then, a LC-MS/MS method using a triple-quadrupole mass spectrometer with a C8 column was developed for simultaneous determination of sphingolipids in small quantities of liver specimens. This method showed good separation and validation results. Separation was performed with a gradient elution of solvent A (5 mmol L−1 ammonium formate in water, pH 4.0) and solvent B (5 mmol L−1 ammonium formate in 95% acetonitrile, pH 4.0) at 300 μL min−1. The lower limit of quantification was less than 132 pmol L−1, and this method was accurate (∼13.5%) and precise (∼7.13%) for S1P analysis. The method can be used to show the tissue distribution of sphingolipids.
Keywords: sphingosine, sphingosine-1-phosphates, ceramide, liver, heat stabilizer
INTRODUCTION
Sphingosine (Sph), sphingosine-1-phosphate (S1P) and Ceramides (Cer) are present in all eukaryotes as structural components of cell membranes. Synthesis and degradation of these compounds in lysosomes are controlled by glycosidases or acid sphingomyelinases that remove the head groups to form ceramides (Cer).1,2) Sph and the phosphorylated S1P are generated by deacylation of Cer, and have attracted attention as bioactive signaling molecules.3) Cer mediates cell stress responses, such as induction of apoptosis4) and cell senescence,5) whereas S1P plays important roles in cell survival, migration, and inflammation.6) The metabolic pathways of sphingolipids contribute to the development and progression of cancer, and chemotherapy.7–9)
The various sphingolipids have similar structures with different fatty acid side chains. They are present in biological tissues at picomolar to micromolar per liter concentrations. The concentrations of sphingolipids are high in blood and lymph, and low in tissue.10) Recently, attention has focused on determining the distribution of sphingolipids in the tissues. For example, the sphingolipid phosphokinases SphK1 and SphK2 and transporter Spns2 are present at different concentrations inside and outside cells.2) Secretion of S1P from hepatocytes is influenced by apolipoprotein M (apoM), which delivers S1P to tissues.11–13) Determination of the sphingolipid concentrations in different tissues is required to clarify their function.
To date, developments in the analysis of sphingolipids have been dependent on improvements to mass spectrometry (MS) technology. The development of the soft ionization techniques of electrospray and atmospheric pressure chemical ionization in 1997 allowed for combination of liquid chromatography (LC) with MS and MS/MS systems for sphingolipids analysis.14,15) Selected reaction monitoring (SRM) mode, in which the transitions of precursor ions to product ion can be quantified with high sensitivity and selectivity, also allowed for development of many protocols for simultaneous determination of sphingolipids.16–21) The distributions of glycerophospholipids and sphingolipids have also been studied using Matrix Assisted Laser Desorption/Ionization-imaging mass spectrometry (MALDI-IMS).22,23) However, most of these methods cannot detect sphingolipids in small quantities of tissue. Therefore, sensitive and quantitative method has been required for distribution analysis of sphingolipids in micro tissue, and we have developed a micro-tissue analysis by LC-MS/MS with laser micro dissection (LMD) system. LMD analysis has to be taken into account degradation of compounds in the tissue during sample preparation, which involves several steps from freezing to sample analysis by MS. Multiple strategies can be used to prevent degradation of compounds, such as addition of cocktails of enzymes, freezing, heating, pressurizing, and chemical manipulations. Rapid stabilization of tissue samples can be achieved using a heat stabilizer (Stabilizor™ T1, Denator, Gothenburg, Sweden), which provides stabilization of low molecular weight compounds and peptides containing phosphate groups in biological samples.24,25)
In the present study, we optimized a preparation procedure for analysis of sphingolipids from liver samples using the Stabilizor™ T1 for heat stabilization of the samples. A LC-MS/MS method for simultaneous determination of 10 sphingolipids in small quantities of tissue was developed, and the sensitivity and reproducibility optimized.
EXPERIMENTAL
Materials
Sph, sphinganine (dhSph), S1P, sphinganine-1-phosphate (dhS1P), Cer (d18 : 1/16 : 0) (Cer d18 : 1/16 : 0), Cer d18 : 1/18 : 1, Cer d18 : 1/18 : 0, Cer d18 : 1/20 : 0, Cer d18 : 1/22 : 0 and Cer d18 : 1/24 : 0 were purchased from Avanti Polar Lipids (Alabaster, AL). Sph 17 : 1, dhSph 17 : 1, S1P 17 : 1, dhS1P 17 : 1, and Cer d18 : 1/17 : 0 were also purchased from Avanti Polar Lipids and used as internal standards. Methanol, chloroform and acetonitrile for LC-MS were purchased from Kanto Chemical (Tokyo, Japan). Ammonium formate (1 mol L−1) and formic acid for LC-MS were purchased from Wako Pure Chemical Industries, Ltd. (Osaka, Japan).
Stock solution and working solution for calibration
Solutions of the sphingolipids were prepared in methanol containing 0–10% (volume fraction) chloroform. S1P, S1P 17 : 1, Sph and dhSph were dissolved in 5 mL of methanol. DhS1P was dissolved in chloroform (1.0 mL), and diluted with methanol to 10 mL. Sph 17 : 1 was dissolved in chloroform (0.5 mL), and diluted with methanol to 5 mL. All Cer species were dissolved in chloroform (1.0 mL) and diluted with methanol to 5 mL. The standard solutions were diluted to 10.0 μg/mL for optimization of MS/MS. Solutions for eight point calibration curves were prepared by diluting the standard solutions to 0.05, 0.1, 0.5, 1.0, 5.0, 10.0, 50.0 and 100 ng mL−1. Sph 17 : 1, dhSph 17 : 1, S1P 17 : 1, dhS1P 17 : 1, and Cer d18:1/17 : 0 were mixed and diluted to 1.0 μg mL−1. All solutions were stored at −30°C.
Optimization of MS/MS by infusion analysis
The MS system was a triple quadrupole mass spectrometer (TSQ Quantiva, Thermo Fisher Scientific, San Jose, CA) equipped with a heated-electrospray ionization-II (HESI-II) source. Each solution (1.0 μg mL−1) was continuously introduced into the MS at 5 μL min−1 using a syringe pump. The parameters for ionization by infusion analysis for optimization are described below. The positive HESI-II spray voltage was 3,000 V. The heated capillary temperature was 350°C, the sheath gas pressure was 0.069 MPa, the auxiliary gas setting was 0.034 MPa, and the heated vaporizer temperature was 50°C. Nitrogen was used as the sheath gas and auxiliary gas. The collision gas was argon at a pressure of 2.0 mTorr. The MS/MS transitions were detected in full scan mode (m/z 50–800). The tube lens offset and collision energy for SRM analysis were optimized. SRM was of the transition of the [M+H]+ precursor ions to their product ions for Sph, dhSph, S1P, dhS1P, Cer d18 : 1/16 : 0, Cer d18 : 1/18 : 1, Cer d18 : 1/18 : 0, Cer d18 : 1/20 : 0, Cer d18 : 1/22 : 0, Cer d18 : 1/24 : 0, Sph 17 : 1, dhSph 17 : 1, S1P 17 : 1, dhS1P 17 : 1, and Cer d18 : 1/17 : 0. Xcalibur™ software (Thermo Fisher Scientific) was used for control of the LC-MS/MS system and data collection.
Optimization of LC-MS/MS
The LC system consisted of a NANOSPACE NASCA2 (Shiseido). Two reverse phase (RP) columns were used in the LC optimization, including a Capcell Pak ACR (C18 column, 100 mm×2.0 mm i.d., 3 μm particle size; Shiseido) and a Capcell Pak C8 UG120 (C8 column, 100 mm×1.5 mm i.d., 5 μm particle size; Shiseido). Elution was as detailed in an earlier study26) with mobile phases A (5 mmol L−1 ammonium formate in water, pH 4.0) and B (5 mmol L−1 ammonium formate in 95% (v/v) acetonitrile, pH 4.0).
Sample preparation procedure using the heat stabilizer
C57BL/6 mice were purchased from CLEA Japan and maintained according to the Guidelines for Animal Experimentation of Tohoku University. The Institutional Animal Care and Use Committee at Tohoku University approved the animal protocol. This study was carried out in accordance with the ethical guidelines of the 1975 Declaration of Helsinki and was approved by the Institutional Research Ethics Committees of the authors’ institutions (i.e., Graduate School of Medicine, The University of Tokyo and Graduate School of Pharmaceutical Sciences, Tohoku University). Tissue was obtained from the mice using an established method.26) Liver (approximately 10–50 mg) was placed into a sample tube (2.0 mL) and snap frozen in liquid nitrogen. The frozen sample was divided into 40 sections, which were placed in plastic tubes and separated into two groups. For the first group 1 of samples, the heat stabilizer was not used and the samples were kept at room temperature (25°C). For the second group 2, the samples were immediately stabilized at 95°C for 1 min (Stabilizor™ T1, Denator), and then kept at room temperature (25°C). Both groups of samples were then treated in the following way. Two-hundred microliters of formic acid (0.1% (volume fraction) in methanol) containing the IS solution (10.0 ng mL−1) was added at the following times (n=4 for each time): 0, 15, 30, 60, and 120 min. After addition of the formic acid, the mixture was homogenized for 30 s using a Micro Smash MS-100R (TOMY) (3,000×rpm at 4°C). After centrifugation at 16,400×g for 20 min at 4°C, the supernatant was passed through a 96-well plate for deproteinization (Sirocco, Waters), and 4 μL of sample was analyzed by LC-MS/MS. The peak area ratio between the analyte and IS was used for quantification using the calibration curve.
Accuracy and precision
Sphingolipids mixtures at eight concentrations (0.05, 0.1, 0.5, 1.0, 5.0, 10.0, 50.0, and 100 ng mL−1) were prepared as working solutions by dilution with 0.1% (volume fraction) formic acid in methanol. These solutions also contained the IS mixture at 1.0 μg mL−1. Samples of mouse liver 10 mg were placed in tubes (2.0 mL). For intra-day assays, aliquots (200 μL) of the three working solutions (n=6 for each concentration) and a blank solution of 0.1% (volume fraction) formic acid in methanol (n=6) (200 μL) were added to separate tubes containing mouse liver. The mixtures were homogenized using a lysis and homogenization system (Precellys) (5,000×rpm, 15 s, 1 Zr bead). The samples were then centrifuged at 16,400×g for 20 min at 4°C, and the supernatants were passed through a 96-well plate for deproteinization (Sirocco, Waters). Aliquots (5 μL) of the deproteinized samples were analyzed by LC-MS/MS. The ratio of the peak area of the analyte to the IS was used for quantification with the calibration curves. Eight point (0.05, 0.1, 0.5, 1.0, 5.0, 10.0, 50.0, and 100 ng mL−1) calibration curves of the sphingolipids were prepared using solutions diluted with 0.1% (volume fraction) formic acid in methanol (n=3 for each concentration). The solutions were analyzed after following the sample preparation procedure described above. The calibration curves were evaluated for linearity (r). The result for the blank (mean value) was subtracted from each liver sample result. The accuracy and precision of the method were evaluated using six samples analyzed on same day (intra-day) and over three days (inter-day). The accuracy of the method was evaluated by calculating the percentage deviation of the mean from the true value of mean concentrations. This accuracy was calculated from recovery rate of spiked standard solution. The precisions was evaluated by calculating the coefficient of variation (CV, %).
Micro tissue analysis
A whole liver was taken out from mice after sacrificed and perfused stored at −80°C. Then, the sample was sliced at 20 μm thickness by cryostat (the space and plate temperature were at −20°C and at −20°C, respectively). Immediately, the slice was placed slide glass covered by the film sheet made by polyethylene naphthalate. Then, the slide glass was set and three parts of liver section were selected in five continuous slice, and cut by a laser micro dissection (LMD) system (LMD 7000, Lica, Tokyo). The dissected sample was placed in sample tube (0.5 mL). Then, 0.1% format in methanol (0.05 mL) including IS mixture added into the tube. After homogenized by untrasonic bath for 10 min, the sample was centrifuged at 16,400×g for 20 min at 4°C. The supernatant was passed through a 96-well plate for deproteinization (Sirocco, Waters), and 10 μL of sample was analyzed by LC-MS/MS. The peak area ratio between the analyte and IS was used for quantification using the calibration curve. Approximately number of cells in micro tissue was calculated by the equitation as following below; Auto calculated area (mm2) by LMD×thickness (0.02 mm)/volume of one cell (0.000001 mm3).
RESULTS AND DISCUSSION
Optimization of MS/MS
The MS/MS transitions were detected in full scan mode (m/z 50–800). The precursor ions [M+H]+, product ions and their collision energy were continuously optimized by infusion analysis of standards (1.0 μg mL−1). The optimal SRM transition for analytes were m/z 300.3>282.2 (20 eV) for Sph, m/z 302.3>284.2 (20 eV) for dhSph, m/z 380.3>264.2 (20 eV) for S1P, m/z 382.3>266.2 (20 eV) for dhS1P, m/z 538.7>264.2 (20 eV) for Cer d18 : 1/16 : 0, m/z 564.7>264.2 (20 eV) for Cer d18 : 1/18 : 1, m/z 566.7>264.2 (20 eV) for Cer d18:1/18 : 0, m/z 594.7>264.2 (20 eV) for Cer d18:1/20 : 0, m/z 622.7>264.2 (20 eV) for Cer d18:1/22 : 0, m/z 650.7>264.2 (20 eV) for Cer d18:1/24 : 0, m/z 286.3>268.2 (20 eV) for Sph 17 : 1, m/z 288.3>270.2 (20 eV) for dhSph 17 : 1, m/z 366.3>250.2 (20 eV) for S1P 17 : 1, m/z 368.3>252.2 (20 eV) for dhS1P 17 : 1, and m/z 552.6>250.3 (20 eV) for Cer d18:1/17 : 0 by positive ion scanning mode.
Optimization of LC-MS/MS
The SRM chromatograms obtained using the C18 and C8 columns are shown in Figs. 1 A and B. The total run time using the C8 column was one quarter that of the C18 column. Additionally, while peak tailing was a problem for C1P using the C18 column (data not shown), this problem was resolved by the C8 column. These results are indicative of ion suppression for the 1-acyl sphingolipids (Sph and S1P) with the C18 column. This arose because without column washing Cer accumulated in the column after a number of experimental runs and disrupted ionization. For good chromatographic separation of the sphingolipids, peak shapes (symmetry and sharpness) should be optimized by evaluating the number of theoretical plates to improve the sensitivity. Peak tailing is caused by interaction between phosphate groups in the sphingolipids and residual silanol groups (imperfect hydration state) or metal ions in the C18 column. Therefore, a column with few residual silanol groups should be selected for sphingolipids analysis to resolve the peak tailing problem. The results indicated that the C8 column was more suitable than the C18 column for sphingolipids analysis by LC-MS/MS. The optimal SRM conditions for the LC-MS/MS analysis are described below. The positive HESI-II spray voltage was 3,000 V. The heated capillary temperature was 350°C, the sheath gas pressure was 0.34 MPa, the auxiliary gas setting was 0.14 MPa, and the heated vaporizer temperature was 450°C. The collision gas was argon at a pressure of 2.0 mTorr. LC separation was performed using a Capcell Pak C8 UG120 (100 mm×1.5 mm i.d., 5 μm particle size) with a gradient elution of solvent A and B at 300 μL min−1. The oven temperature was 40°C. The initial solvent composition was 30% B. The following solvent gradient was applied: 30% B for 1.0 min, increased linearly to 100% B from 1.0 to 8.0 min, and held at 100% B for 15 min. The mobile phase was then immediately returned to the initial conditions and maintained at 30% B for 2.0 min to end the run.
Fig. 1. SRM chromatograms of sphingolipids (1.0 ng mL−1) obtained with the developed method. The separation was performed with (a) a Capcell Pak ACR column (100 mm×1.5 mm i.d., 3 μm particle size) or (b) a Capcell Pak C8 UG120 column (100 mm×1.5 mm i.d., 5 μm particle size).

Sample preparation procedure using the heat stabilizer
The stability results for the sphingolipids in liver are shown in Fig. 2. The levels of S1P and dhS1P decreased significantly in the liver samples without heat stabilization, but were stabilized after 15 min of treatment with the heat stabilizer. S1P can be dephosphorylated by two S1P-specific phosphatases, S1P phosphohydrolase (SPP) 1 and SPP2, or degraded by S1P lyase (SPL) to phosphoethanolamine and hexadecenal, which can be incorporated into glycerolipids.2) These enzymes are activated at room temperature and degrade S1P in tissues. These enzyme are also related the degradation of dhS1P.27) Therefore, dhS1P are decreased significantly in tissue. The levels of Sph, dhSph and Cer species were also stable after treatment with the heat stabilizer, compared with the significant increases observed over 2 h without the heat stabilizer. Sph and dhSph are produced from Cer and degraded to S1P and dhS1P by sphingosin kinase (SphK).27) Our results of non-stabilized sample indicated that the degradation performance of them were depended with Cer degradation, and not the activation of SphK. In addition, at least half of the Sph is converted back to Cer to maintain homeostasis.1) Even with this conversion, after stabilization the levels of Sph and Cer were maintained for at least 1 h. After cell death occurred, significant increases were observed in the levels of these compounds. The significant differences in the levels of sphingolipids observed between non-stabilized and stabilized tissues indicate that the sample stabilization is important for sphingolipids analysis in tissue samples, and the heat stabilizer (Stabilizor™ T1) inactivates these enzymes but does not degrade the sphingolipids. Clinically, biopsy is often used to diagnoses liver diseases, and the biopsy samples are often small and also used for other analyses. In future, this developed preparation procedure should be applied to analysis of sphingolipids in clinical samples. However, it should be taken in account of postmortem changes in contents of tissue metabolites in a few minutes. The focused microwave irradiation (FMW) method can be inactivated within a few seconds.28) Therefore, FMW will be useful for evaluation of the degradation of sphingolipids in tissue to improve the present analysis in the future.
Fig. 2. Results for the determination of sphingolipids in liver at room temperature (25°C) without (n=4, dark gray, non-stabilized) or with the heat stabilizer (n=4, clear gray, stabilized). Values are mean±S.D.

Micro tissue analysis
Micro-tissue that were included thousands (5,695–9,486) cells were obtained from liver slice by LMD. Sphingolipids were detected in micro-tissue with the exception of dhS1P because of under its LLOQ. The calculated amounts (pmol/mg tissue) of Sph, dhSph, S1P, Cer d18 : 1/16 : 0, Cer d18 : 1/18 : 1, Cer d18 : 1/18 : 0, Cer d18 : 1/20 : 0, Cer d18 : 1/22 : 0, and Cer d18 : 1/24 : 0 were summarized in Table 1. The values of sphingolipids were different among three parts of section. The values of sphingolipids were the same as previous reports.29) The present method is sensitive and useful for quantifying sphingolipids in a micro-tissue by LMD, and apply for distribution analysis of sphingolipids in several disease models.
Table 1. Results of determination analysis of sphingolipids in micro-tissue.
| (pmol/mg) | |||
| Liver section | 1 | 2 | 3 |
|---|---|---|---|
| Sph | 13.4±4.9 | 12.9±2.4 | 11.2±5.2 |
| dhSph | 87.0±11.7 | 82.7±7.1 | 73.7±10.9 |
| S1P | 0.92±0.61 | 0.14±0.09 | 0.57±0.32 |
| Cer d18 : 1/16 : 0 | 15.8±6.3 | 11.1±4.4 | 11.6±3.2 |
| Cer d18 : 1/18 : 1 | 4.89±2.41 | 5.34±3.04 | 3.83±1.17 |
| Cer d18 : 1/18 : 0 | 7.72±1.84 | 6.74±1.34 | 5.81±1.24 |
| Cer d18 : 1/20 : 0 | 1.67±0.80 | 1.30±0.24 | 1.09±0.47 |
| Cer d18 : 1/22 : 0 | 15.9±7.7 | 9.91±5.90 | 11.4±3.3 |
| Cer d18 : 1/24 : 0 | 42.0±20.8 | 27.6±16.1 | 33.9±11.6 |
Accuracy and precision
The lower limit of quantification (LLOQ) was defined as the lowest concentration of quantification that was measurable with a CV of >20 and a signal-to-noise (S/N) ratio of >10. The lower limit of detection (LLOD) was defined in a similar way but with a S/N ratio of three. The LLOQ and LLOD values for S1P were 0.05 and 0.01 ng mL−1, respectively. Eight point (0.05, 0.1, 0.5, 1.0, 5.0, 10.0, 50.0, and 100 ng mL−1) calibration curves were used to evaluate the linearity. The results of calibration curves of the 10 sphingolipids were summarized in Table 2. The curves were fitted to a linear equation of the slope and intercept (y=ax+b). Correlation coefficients were better than 0.99 for all analytes.
Table 2. Calibration curves of sphingolipids.
| Compounds | Calibration range (ng mL−1) | Equations | Coefficient correlation (r) |
|---|---|---|---|
| Sph | 1.0–100 | Y=0.0105+0.000463X | >0.999 |
| dhSph | 0.1–100 | Y=0.000340+0.000148X | >0.997 |
| S1P | 0.05–100 | Y=0.0000184+0.000155X | >0.999 |
| dhS1P | 0.5–100 | Y=0.000120+0.000279X | >0.998 |
| Cer d18 : 1/16 : 0 | 5.0–100 | Y=0.0161+0.000172X | >0.989 |
| Cer d18 : 1/18 : 1 | 1.0–100 | Y=0.000635+0.000150X | >0.999 |
| Cer d18 : 1/18 : 0 | 1.0–100 | Y=0.00245+0.0000950X | >0.998 |
| Cer d18 : 1/20 : 0 | 5.0–100 | Y=0.000959+0.0000868X | >0.994 |
| Cer d18 : 1/22 : 0 | 5.0–100 | Y=0.00544+0.0000765X | >0.987 |
| Cer d18 : 1/24 : 0 | 5.0–100 | Y=0.0100+0.0000816X | >0.979 |
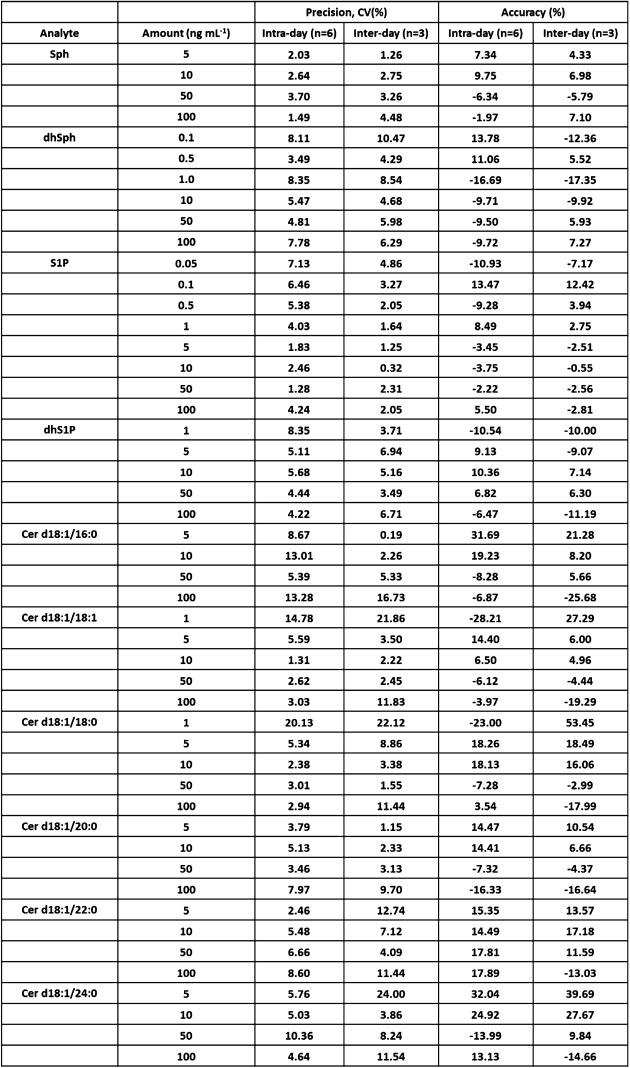
The results for the accuracy and precision are shown in Table 3. These results indicate that the present method is reliable.
Table 3. Accuracy and precision of the method.
 |
CONCLUSION
Addition of a heat stabilizer effectively prevented degradation of the sphingolipids during sample preparation. The developed preparation protocol will be useful for determining the localization of sphingolipids in tissue. Using a C8 column, the chromatographic separation and peak shapes improved and the total run time was only one quarter of that with the C18 column. The LLOD was 10 pg mL−1, and the method was evaluated using intra-day and inter-day assays. Our present protocol for the analysis of sphingolipids in small quantities of tissues, validated using human liver, has huge possibilities to reveal the involvement of sphingolipid mediators in human diseases since biopsy can now be applicable to various tissues due to the progress of endoscopy technologies.
Acknowledgments
This research was supported by JST and CREST.
D. Saigusa, et al., Simultaneous Quantification of Sphingolipids in Small Quantities of Liver by LC-MS/MS, Mass Spectrom (Tokyo) 2014; 3(4): S0046; DOI: 10.5702/massspectrometry.S0046
- LC-MS/MS
high-performance liquid chromatography tandem mass spectrometry
- Sph
sphingosine
- dhSph
sphinganine
- S1P
sphingosine-1-phosphates
- dhS1P
sphinganine-1-phosphates
- Cer
ceramide
- SRM
selected reaction monitoring
- MALDI-IMS
Matrix Assisted Laser Desorption/Ionization-imaging mass spectrometry
- HESI-II
heated-electrospray ionization-II
References
- 1) Y. Hannun, L. Obeid. Principles of bioactive lipid signalling: Lessons from sphingolipids. Nat. Rev. Mol. Cell Biol. 9: 139–150, 2008. [DOI] [PubMed] [Google Scholar]
- 2) M. Maceyka, S. Spiegel. Sphingolipid metabolites in inflammatory disease. Nature 510: 58–67, 2014. [DOI] [PMC free article] [PubMed] [Google Scholar]
- 3) I. Dobrosotskaya, A. Seegmiller, M. Brown, J. Goldstein, R. Rawson. Regulation of SREBP processing and membrane lipid production by phospholipids in Drosophila. Science 296: 879–883, 2002. [DOI] [PubMed] [Google Scholar]
- 4) L. Obeid, C. Linardic, L. Karolak, Y. Hannun. Programmed cell death induced by ceramide. Science 259: 1769–1771, 1993. [DOI] [PubMed] [Google Scholar]
- 5) M. Venable, J. Lee, M. Smyth, A. Bielawska, L. Obeid. Role of ceramide in cellular senescence. J. Biol. Chem. 270: 30701–30708, 1995. [DOI] [PubMed] [Google Scholar]
- 6) T. Hla. Physiological and pathological actions of sphingosine 1-phosphate. Semin. Cell Dev. Biol. 15: 513–520, 2004. [DOI] [PubMed] [Google Scholar]
- 7) H. Furuya, Y. Shimizu, T. Kawamori. Sphingolipids in cancer. Cancer Metastasis Rev. 30: 567–576, 2011. [DOI] [PubMed] [Google Scholar]
- 8) S. Morad, M. Cabot. Ceramide-orchestrated signalling in cancer cells. Nat. Rev. Cancer 13: 51–65, 2013. [DOI] [PubMed] [Google Scholar]
- 9) M. Kondo, T. Ishizawa, K. Enooku, Y. Tokuhara, R. Ohkawa, B. Uranbileg, H. Nakagawa, R. Tateishi, H. Yoshida, N. Kokudo, K. Koike, Y. Yatomi, H. Ikeda. Increased serum autotaxin levels in hepatocellular carcinoma patients were caused by background liver fibrosis but not by carcinoma. Clin. Chim. Acta 433: 128–134, 2014. [DOI] [PubMed] [Google Scholar]
- 10) D. Saigusa, K. Shiba, A. Inoue, K. Hama, M. Okutani, N. Iida, M. Saito, K. Suzuki, T. Kaneko, N. Suzuki, H. Yamaguchi, N. Mano, J. Goto, T. Hishinuma, J. Aoki, Y. Tomioka. Simultaneous quantitation of sphingoid bases and their phosphates in biological samples by liquid chromatography/electrospray ionization tandem mass spectrometry. Anal. Bioanal. Chem. 403: 1897–1905, 2012. [DOI] [PubMed] [Google Scholar]
- 11) M. Liu, J. Seo, J. Allegood, X. Bi, X. Zhu, E. Boudyguina, A. Gebre, D. Avni, D. Shah, M. Sorci-Thomas, M. Thomas, G. Shelness, S. Spiegel, J. Parks. Hepatic apolipoprotein M (apoM) overexpression stimulates formation of larger apoM/sphingosine 1-phosphate-enriched plasma high density lipoprotein. J. Biol. Chem. 289: 2801–2814, 2014. [DOI] [PMC free article] [PubMed] [Google Scholar]
- 12) M. Kurano, K. Tsukamoto, R. Ohkawa, M. Hara, J. Iino, Y. Kageyama, H. Ikeda, Y. Yatomi. Liver involvement in sphingosine 1-phosphate dynamism revealed by adenoviral hepatic overexpression of apolipoprotein M. Atherosclerosis 229: 102–109, 2013. [DOI] [PubMed] [Google Scholar]
- 13) M. Kurano, M. Hara, K. Tsuneyama, H. Sakoda, T. Shimizu, K. Tsukamoto, H. Ikeda, Y. Yatomi. Induction of insulin secretion by apolipoprotein M, a carrier for sphingosine 1-phosphate. Biochim. Biophys. Acta 1841: 1217–1226, 2014. [DOI] [PubMed] [Google Scholar]
- 14) N. Mano, Y. Oda, K. Yamada, N. Asakawa, K. Katayama. Simultaneous quantitative determination method for sphingolipid metabolites by liquid chromatography/ionspray ionization tandem mass spectrometry. Anal. Biochem. 244: 291–300, 1997. [DOI] [PubMed] [Google Scholar]
- 15) L. Couch, M. Churchwell, D. Doerge, W. Tolleson, P. Howard. Identification of ceramides in human cells using liquid chromatography with detection by atmospheric pressure chemical ionization-mass spectrometry. Rapid Commun. Mass Spectrom. 11: 504–512, 1997. [DOI] [PubMed] [Google Scholar]
- 16) S. Hammad, J. Pierce, F. Soodavar, K. Smith, M. Al Gadban, B. Rembiesa, R. Klein, Y. Hannun, J. Bielawski, A. Bielawska. Blood sphingolipidomics in healthy humans: Impact of sample collection methodology. J. Lipid Res. 51: 3074–3087, 2010. [DOI] [PMC free article] [PubMed] [Google Scholar]
- 17) J. Bielawski, J. Pierce, J. Snider, B. Rembiesa, Z. Szulc, A. Bielawska. Comprehensive quantitative analysis of bioactive sphingolipids by high-performance liquid chromatography-tandem mass spectrometry. Methods Mol. Biol. 579: 443–467, 2009. [DOI] [PubMed] [Google Scholar]
- 18) R. Shaner, J. Allegood, H. Park, E. Wang, S. Kelly, C. Haynes, M. Sullards, A. Merrill Jr. Quantitative analysis of sphingolipids for lipidomics using triple quadrupole and quadrupole linear ion trap mass spectrometers. J. Lipid Res. 50: 1692–1707, 2009. [DOI] [PMC free article] [PubMed] [Google Scholar]
- 19) M. Scherer, K. Leuthauser-Jaschinski, J. Ecker, G. Schmitz, G. Liebisch. A rapid and quantitative LC-MS/MS method to profile sphingolipids. J. Lipid Res. 51: 2001–2011, 2010. [DOI] [PMC free article] [PubMed] [Google Scholar]
- 20) M. Scherer, A. Bottcher, G. Schmitz, G. Liebisch. Sphingolipid profiling of human plasma and FPLC-separated lipoprotein fractions by hydrophilic interaction chromatography tandem mass spectrometry. Biochim. Biophys. Acta 1811: 68–75, 2011. [DOI] [PubMed] [Google Scholar]
- 21) H. Ogiso, M. Taniguchi, S. Araya, S. Aoki, L. O. Wardhani, Y. Yamashita, Y. Ueda, T. Okazaki. Comparative analysis of biological sphingolipids with glycerophospholipids and diacylglycerol by LC-MS/MS. Metabolites 4: 98–114, 2014. [DOI] [PMC free article] [PubMed] [Google Scholar]
- 22) M. Hanada, Y. Sugiura, R. Shinjo, N. Masaki, S. Imagama, N. Ishiguro, Y. Matsuyama, M. Setou. Spatiotemporal alteration of phospholipids and prostaglandins in a rat model of spinal cord injury. Anal. Bioanal. Chem. 403: 1873–1884, 2012. [DOI] [PubMed] [Google Scholar]
- 23) E. Jones, S. Dworski, D. Canals, J. Casas, G. Fabrias, D. Schoenling, T. Levade, C. Denlinger, Y. Hannun, J. Medin, R. Drake. On-tissue localization of ceramides and other sphingolipids by MALDI mass spectrometry imaging. Anal. Chem. 86: 8303–8311, 2014. [DOI] [PMC free article] [PubMed] [Google Scholar]
- 24) M. Svensson, M. Boren, K. Sköld, M. Fälth, B. Sjögren, M. Andersson, P. Svenningsson, P. E. Andren. Heat stabilization of the tissue proteome: A new technology for improved proteomics. J. Proteome Res. 8: 974–981, 2009. [DOI] [PubMed] [Google Scholar]
- 25) Y. Sugiura, R. Taguchi, M. Setou. Visualization of spatiotemporal energy dynamics of hippocampal neurons by mass spectrometry during a kainate-induced seizure. PLoS ONE 6: e17952, 2011. [DOI] [PMC free article] [PubMed] [Google Scholar]
- 26) M. Okudaira, A. Inoue, A. Shuto, K. Nakanaga, K. Kano, K. Makide, D. Saigusa, Y. Tomioka, J. Aoki. Separation and quantification of 2-acyl-1-lysophospholipids and 1-acyl-2-lysophospholipids in biological samples by LC-MS/MS. J. Lipid Res. 55: 2178–2192, 2014. [DOI] [PMC free article] [PubMed] [Google Scholar]
- 27) Y. Kariya, A. Kihara, M. Ikeda, F. Kikuchi, S. Nakamura, S. Hashimoto, C. H. Choi, Y. M. Lee, Y. Igarashi. Products by the sphingosine kinase/sphingosine 1-phosphate (S1P) lyase pathway but not S1P stimulate mitogenesis. Genes Cells 10: 605–615, 2005. [DOI] [PubMed] [Google Scholar]
- 28) Y. Sugiura, K. Honda, M. Kajimura, M. Suematsu. Visualization and quantification of cerebral metabolic fluxes of glucose in awake mice. Proteomics 14: 829–838, 2014. [DOI] [PubMed] [Google Scholar]
- 29) E. V. Berdyshev, I. A. Gorshkova, J. G. Garcia, V. Natarajan, W. C. Hubbard. Quantitative analysis of sphingoid base-1-phosphates as bisacetylated derivatives by liquid chromatography-tandem mass spectrometry. Anal. Biochem. 339: 129–136, 2005. [DOI] [PubMed] [Google Scholar]