Abstract
Findings from studies examining interactions between fat taste and dietary fat intake or body weight are mixed. A convenience sample of 735 visitors to the Denver Museum of Nature & Science ≥8 years old rated the taste intensity of edible taste strips impregnated with varying concentrations (%v/v) of linoleic acid (LA) (blank = 0.0, low = 0.06, medium = 0.15, high = 0.38). Percent body fat (BF%) was measured using bioelectrical impedance. Fat taste intensity was rated as significantly different across all concentrations (P < 0.001) except between the blank and low concentrations (P = 0.1). Ratings increased monotonically across concentrations. Children (<18 years; N = 180) rated all concentrations as more intense than adults (P < 0.001 for all). Women and girls rated the highest concentration as more intense than men and boys (P < 0.02 for all). BF% was not correlated with fat taste intensity ratings. Self-reported dietary intake indicated that obese individuals’ intensity ratings for medium and high concentrations of LA were inversely related to recent mono- and poly-unsaturated fat exposure (r = −0.19 to −0.27; P < 0.03 for all). No such associations were observed in the nonobese group. Findings suggest that factors other than simple adiposity status influence fat taste intensity ratings, and that participants in fat taste studies should receive standardized meals prior to testing.
Key words: bioelectrical impedance, children, fat taste, linoleic acid, psychophysical testing, taste intensity
Introduction
Previously, detection of fat in the oral cavity was thought to occur through olfactory and textural modalities. More recently, evidence suggests that nonesterified fatty acids also generate taste responses in humans as measured by thresholds when potential olfactory and textural cues from fat stimuli are masked or eliminated (for reviews see Running et al. 2013; Tucker et al. 2014a). Taste contributes to the flavor of foods, and consumers report that taste/flavor is the primary driver of food selection (Glanz and Basil 1998; Dressler and Smith 2013). Because food choice influences body weight, relationships between “fat taste” sensitivity, dietary fat intake, and measures of adiposity, such as body mass index (BMI), have been the subject of growing research attention.
Fat taste sensitivity and suprathreshold responsiveness have generally been negatively correlated with dietary fat intake (Stewart et al. 2010, 2011a; Chevrot et al. 2014; Martinez-Ruiz et al. 2014). That is, higher thresholds (lower sensitivity) to the taste of fat are associated with higher dietary fat intake. However, there are conflicting reports of associations between fat taste thresholds and dietary fat consumption when analyzed by BMI, with 1 study reporting a direct relationship only among lean and overweight participants (Tucker et al. 2014b), and another demonstrating direct associations only in the obese (Chevrot et al. 2014).
In terms of adiposity, BMI has been associated with fat taste sensitivity in some (Stewart et al. 2010, 2011a, 2011b; Stewart and Keast 2012; Martinez-Ruiz et al. 2014) but not all studies (Mattes 2009, 2011; Stewart and Keast 2012; Chevrot et al. 2014; Tucker et al. 2014b). When observed, associations are inverse, leading some researchers to conclude that reduced fat taste sensitivity leads to increased consumption of high-fat foods. The lower perceived fat content purportedly leads to decreased satiety thereby promoting weight gain and obesity (Keast et al. 2014). However, BMI frequently misclassifies the adiposity status (normal, overweight, obese) of individuals undergoing taste testing compared with more accurate measures of adiposity, like bioelectrical impedance (BIA) (Roubenoff 1996). This misclassification could contribute to the differences in the above reported findings.
The varying results reported above concerning the role of fat taste sensitivity in both dietary fat intake and adiposity are complicated by limitations in sample size and measurement selection. To overcome these limitations, we tested fat taste sensitivity in a large sample of visitors (N = 735) to the Genetics of Taste Lab at the Denver Museum of Nature & Science in Denver, Colorado, USA between 2013 and 2014. A primary aim was to determine if participants could rate the intensity of varying concentrations of linoleic acid (C18:2) (LA) presented in the form of edible taste strips. Secondary aims included: determining associations between fat taste sensitivity and body fatness as measured by BIA, examining how food and beverage intake prior to testing influenced fat taste sensitivity, and comparing fat taste sensitivity of adults versus children and men versus women. DNA samples were collected to explore a possible genetic basis for oral fat detection, and results from that analysis will be presented in a second report.
Materials and methods
Participants
Written consent was obtained for adults (≥18). Children (≤17) both gave assent and had written approval obtained from a legal guardian. The testing protocol was approved by the Purdue University Institutional Review Board, and the study complied with the Declaration of Helsinki for Medical Research involving Human Subjects. Because the study took place in the Museum, individuals were not excluded from participating based on smoking status, medication use and so forth. Participants with pacemakers did not participate in percent body fat (BF%) measurements.
Study design
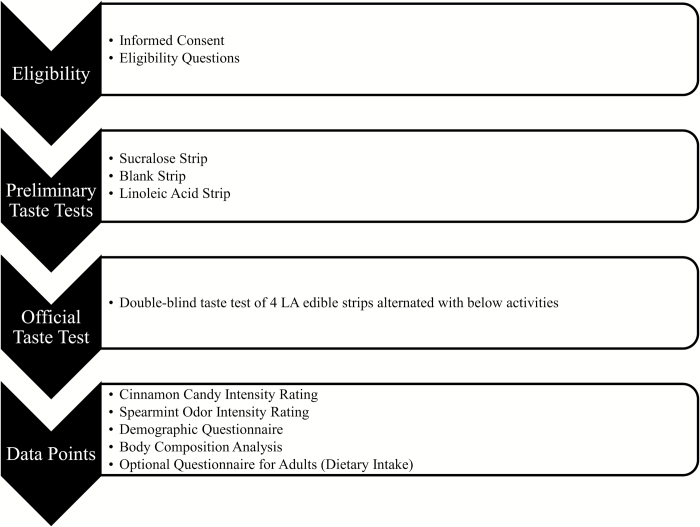
Wearing nose clips, participants rated the intensity of edible strips impregnated with either no stimulus (blank) or varying concentrations of LA (low = 0.06% v/v, medium = 0.15% v/v, high = 0.38% v/v) on a 100mm visual analog scale (VAS). The VAS was selected due to its ease of use for younger participants and was anchored with “extremely weak” and “extremely strong.” LA is a cis-unsaturated 18-carbon essential fatty acid that activates taste receptor cells (Liu et al. 2011), and concentrations were selected to represent amounts commonly found in the diet (Pop et al. 2010; USDA 2010). LA was selected due to its essentiality in the diet. Presentation of the edible strips was randomized, and the study was double blinded. Prior to rating the edible strips, participants sampled a blank strip and a strip with the highest concentration of LA to become familiar with both the sensation of the strip dissolving in the oral cavity and with the taste quality because an agreed upon descriptor for fat taste in the English language is lacking (Tucker and Mattes 2012). The testing period for each edible strip was 45 s. To avoid fatigue, participants were instructed to place the strip on one side of the tongue as far in the back of the mouth as possible; participants alternated sides with each new presentation. To further avoid fatigue, additional data collection activities were interspersed between each tasting, including intensity ratings of an edible taste strip containing sucralose, a spicy cinnamon candy, and the odor of spearmint extract (Figure 1). The time between tasting activities varied as a function of the number of people participating during each testing session. Nose clips were worn for all stimuli except the spearmint odor presentation. The sucralose stimulus served to check that participants could perform the rating task using the VAS scale. The cinnamon candy was selected to evaluate trigeminal nerve/chemesthetic sensitivity. The odorant confirmed functional olfactory capability.
Figure 1.
Testing visit protocol.
Stimuli
Edible strips were selected as the stimulus delivery method because the strips rapidly and completely dissolve in the mouth and eliminate bulk viscosity textural cues encountered with solution-based stimuli (Running et al. 2013), and possess a longer shelf-life compared with fatty acid emulsions (Ebba et al. 2012). The edible strips were made using a solution of pullulan-hydroxypropyl methylcellulose (HPMC) (Smutzer et al. 2008) combined with a stable emulsion of 0.5% w/v LA, 12% w/v gum Arabic, 0.01% w/v ethylenediaminetetraacetic acid (EDTA, an antioxidant), and 0.01% w/v tert-Butylhydroquinone (TBHQ, an antioxidant). Pullulan was obtained from Hayashibara Co., Ltd. HPMC was obtained from Dow Chemical Company. LA, EDTA, and TBHQ were all obtained from Spectrum Chemical. The gum Arabic was purchased from Sigma–Aldrich Corporation. The LA emulsion was homogenized with a Branson sonifier cell disruptor (model S-150D; Branson Ultrasonics) at 90% amplitude for 25min on ice. The pullulan-HPMC and LA solutions were combined to produce LA concentrations of 0.05%, 0.12%, and 0.28% v/v. Evaporation of water resulted in the higher amounts of LA in the finished strip, that is, 0.06%, 0.15%, and 0.38% v/v by calculation. Because the edible strips were prepared using a given concentration of LA solution, the stimuli will be referred to as concentrations throughout this article. A total of 0.75mL of each LA concentration was pipetted into plastic weigh boats that served as molds. The solutions dried to a thin film within 24h at room temperature. The edible strips were stored frozen under nitrogen. Gas chromatography–mass spectrometry analysis revealed no appreciable oxidation products.
Anthropomorphic and dietary data
Percent body fat and dietary intake data were also collected. BF% was assessed by BIA (Tanita, Body Composition Analyzer, model TBF-215; Tanita Corp. of America Inc.) with participants in street clothes but shoes and socks removed. BF% of ≥25% in men and ≥30% in women resulted in classification as obese (Shah and Braverman 2012). A subset of adults recorded the amount of food and beverage consumed during their last eating occasion prior to testing. Participants were asked to be as specific as possible in terms of what and how much was consumed. One undergraduate dietetics student entered the data into Nutritionist Pro 5.0 (Axxya Systems) dietary analysis software to eliminate inter-rater error.
Statistics
Data were analyzed using IBM SPSS Statistics version 22. Demographic data are presented as means ± standard deviations (SD). Taste intensity data are presented as means ± standard error of the mean (SEM). Repeated measures analysis of variance (RMANOVA) and pairwise comparisons with Bonferroni corrections were used to evaluate differences in intensity ratings between LA concentrations. Between group comparisons were made using independent t-tests. Pearson’s correlation coefficients were used to assess associations between participant characteristics and taste intensity ratings. Slope analysis quantified changes in intensity ratings relative to gradations of LA concentration. The level of significance was set at P < 0.05, 2-tailed.
Results
A total of 735 participants completed taste testing (N = 549 adults, 180 children [8–17 years old], 6 unknown). Of these participants, 37.9% were male. The majority of the participants were White (85.9% White, 3.1% Asian, 1.4% Black, and 8.8% Hispanic). The average age was 33±19.4 years (range: 8–90 years). Mean BF% among adults was 26.9±11.0%. Because levels of risk associated with BF% vary in children by sex and age (McCarthy et al. 2006), sample sizes were too small to make meaningful comparisons, so these data were not statistically analyzed.
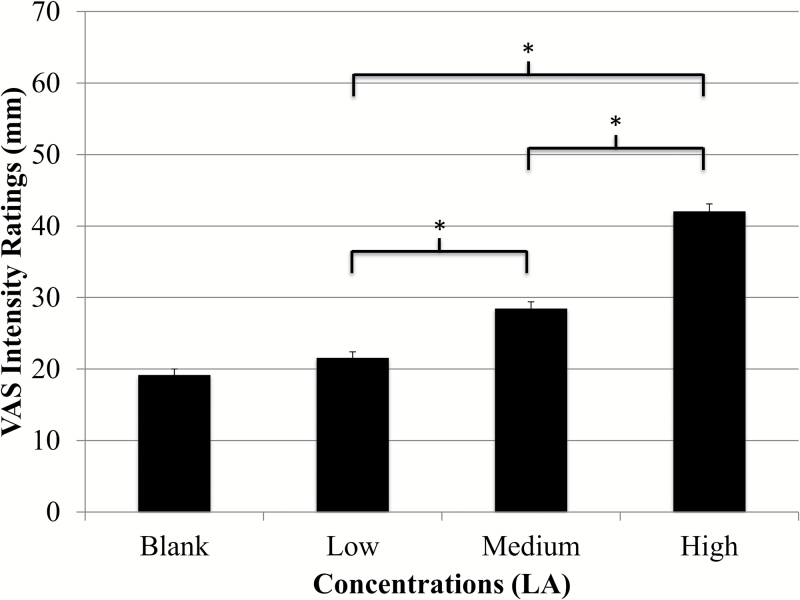
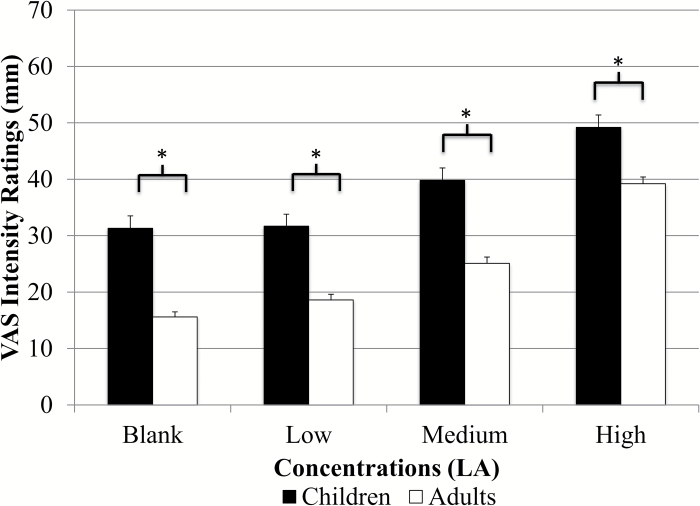
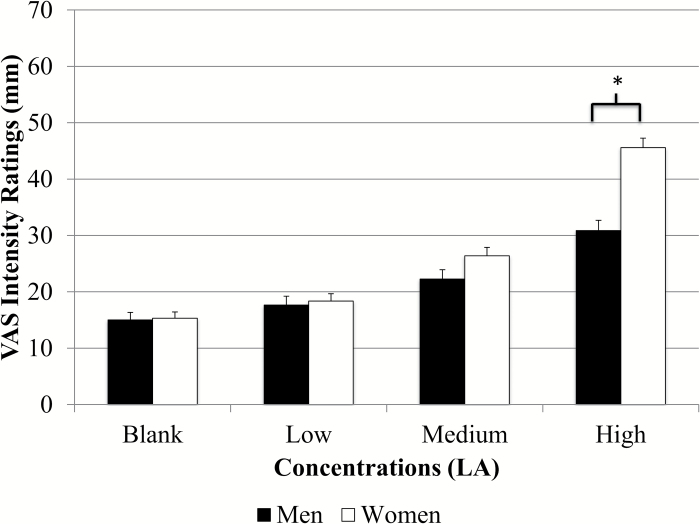
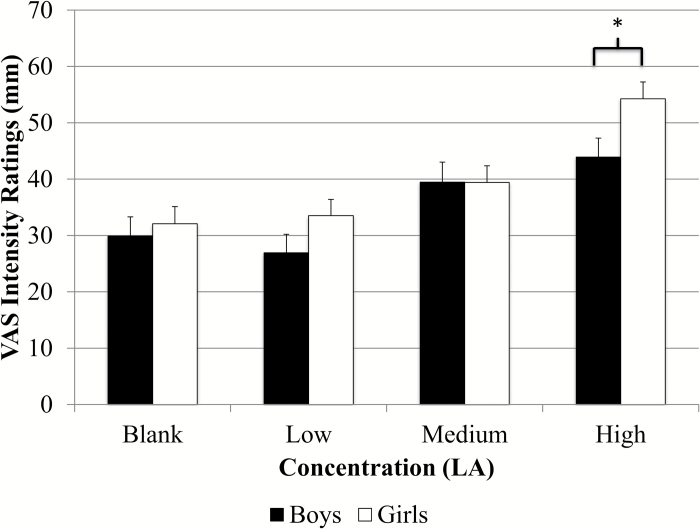
Intensity ratings for the entire group and ratings for both adults and children are presented in Figure 2. Results from RMANOVA indicated significant differences in intensity ratings across all 3 fat concentrations for the entire group [F(2.9, 1998.5) = 170.2, P < 0.001], adults [F(2.8, 1472.4) = 153.6, P < 0.001], and children [F(3.0, 500.5) = 24.3 P < 0.001]. Paired comparisons showed significantly different ratings between all concentrations (P < 0.004 for all) except between the blank and low concentration (P = 0.1) (Figure 2). Children rated all concentrations as significantly more intense than adults (P < 0.001 for all) (Figure 3). Children also rated the taste of the sucralose strip (37.9±1.9mm vs. 27.8±0.9mm), the spiciness of the cinnamon candy (61.8±2.4mm vs. 39.8±1.2mm), and the odor of the spearmint extract (76.3±1.5mm vs. 68.5±0.8mm) as significantly more intense than adults (P < 0.001 for all), and children rated the spiciness of the cinnamon candy as significantly higher than that of the highest LA strip (P < 0.001). Adult women rated the highest concentration as significantly more intense than men (47.6±1.5mm vs. 34.3±1.6mm, P < 0.001) (Figure 4) and girls rated the highest concentration as significantly more intense than boys (54.3±3.0mm vs. 43.9±3.4mm; P = 0.02) (Figure 5). Women also judged the spiciness of the cinnamon candy more intense (P = 0.001) than men, but sucralose intensity and odor ratings did not differ between sexes. Slope analysis revealed that for every 0.1% increase in LA concentration, mean intensity ratings increased by 5.9mm.
Figure 2.
Whole group intensity ratings of LA (N = 735). There were significant differences (P < 0.001) for intensity ratings of low (21.5±0.9mm), medium (28.4±1.0), and high concentrations (42.0±1.1) of fat taste stimuli as recorded on a VAS scale. Ratings increased in a dose-dependent fashion (mean ± SEM).
Figure 3.
Children versus adult intensity ratings of LA (N = 549 adults, 180 children, 5 unknown). There were significant differences (P < 0.001) between children’s and adults’ ratings of fat taste intensity on a VAS scale. Ratings for children and adults were as follows: low (31.2±2.1mm vs. 18.2±1.0mm), medium (38.3±2.1mm vs. 24.9±1.1mm), and high (49.3±2.2mm vs. 39.4±1.3mm). Ratings increased in a dose-dependent fashion (mean ± SEM).
Figure 4.
Men versus women intensity ratings of LA (N = 219 male, 330 female). There were significant differences (P < 0.001) in fat taste intensity ratings of the highest concentration of LA between men and women on a VAS scale (47.6±1.5mm vs. 34.3±1.6mm).
Figure 5.
Boys versus girls intensity ratings of LA (N = 74 boys; 106 girls). There were significant differences (P = 0.02) in fat taste intensity ratings of the highest concentration of LA between boys and girls on a VAS scale (54.3±3.0mm vs. 43.9±3.4mm).
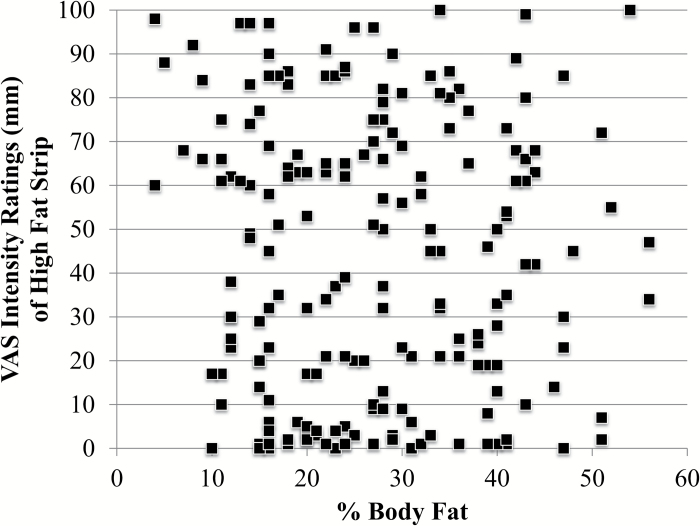
In adults, BF% was not significantly correlated with fat taste intensity ratings (Figure 6). No differences in fat taste intensity ratings were noted between nonobese (N = 236) and obese adults (BF% ≥25% in males and ≥30% in females; N = 304), except for the medium LA concentration where lean participants rated the taste strip as more intense (31.0±1.7mm vs. 25.9±1.5mm; P = 0.03). When analyzed by obesity status, nonobese women were more sensitive than nonobese men at the highest concentration (46.8±2.5mm vs. 37.2±2.6mm, P = 0.01). Obese women were also more sensitive than obese men (47.9±2.1mm vs. 32.1±2.6 m, P < 0.001) at the highest concentration. No differences in ratings between nonobese and obese men or women were identified.
Figure 6.
Scatterplot of intensity rating of highest concentration and BF% (N = 223; 83 male; 140 female). There was no significant association between the 2 variables. These findings are representative of those observed with the low and medium concentrations.
Finally, self-reported dietary intake of the meal consumed prior to testing was obtained from a subset of adults (N = 223; 83 male; 140 female; 125 obese; 94 not obese). Age and %BF did not differ between those who reported dietary data and those who did not (P > 0.4 for all). Intensity ratings for LA did not differ between those who reported dietary data and those who did not (P > 0.2 for all). Total fat and monounsaturated fat intake at the prior eating occasion were negatively correlated with taste intensity ratings of the medium concentration of LA (r = −0.14 for both; P = 0.03–0.04); a trend was seen for polyunsaturated fat intake (r = −0.13; P = 0.054) for all participants. When stratified into obese and nonobese categories by %BF, correlations between recent fat intake and fat taste intensity ratings in lean individuals were not significant; however, in the obese participants, for the medium concentration, mono- and polyunsaturated fat intake was negatively associated with fat taste intensity ratings (r = −0.21, P = 0.021; r = −0.24, P = 0.006, respectively). Similar findings were observed for the high concentration: (r = −0.19, P = 0.03; r = −0.265, P = 0.003, respectively). Trends were noted for relationships between total fat intake and intensity ratings for both the medium and high concentrations (r = −0.16, P = 0.08; r = −0.15; P = 0.084, respectively). The time between the eating occasion and testing averaged 3.2±2.5h but was not associated with fat intensity ratings.
Discussion
This large, double-blind study confirms previous work (Ebba et al. 2012) that participants were able to perceive and monotonically rate the intensity of graded concentrations of LA in edible taste strips. This study expands upon previous studies by including children and utilizing a more accurate measure of adiposity, BIA, to explore relationships between fat taste sensitivity and adiposity. Fat taste intensity increased with increasing LA concentration in both adults and children, consistent with findings in adults using LA (Martinez-Ruiz et al. 2014) as well as other fatty acid solutions (caproic, lauric, and stearic) (Mattes 2009).
Children rated all LA concentrations as significantly more intense than adults. As children rated all stimuli as more intense than adults, this finding is not specific to fat taste. Differences in VAS scores were similar for fat taste, odor, and sweet intensities. Because fatty acids have the potential to be chemesthetic stimuli at high concentrations, we compared ratings of the highest LA strip to the ratings for the cinnamon candy. Children rated the spiciness of the cinnamon candy as significantly higher than that of the highest LA strip (P < 0.001), suggesting that the strip did not impart a strong chemesthetic quality.
Although aging is generally associated with diminished taste perception (Murphy 1993), findings are variable (Hyde and Feller 1981; Mojet et al. 2003). Direct comparisons of taste function between children and adults are few, but findings are mixed and are influenced by the age and sex of the child, the psychophysical method used, as well as the taste quality (Stein et al. 1994; James et al. 1997; Temple et al. 2002; James et al. 2004). Some have posited an evolutionary advantage to increased taste sensitivity in children; children would benefit from the ability to quickly learn which foods are beneficial (Mennella and Ventura 2010). To that end, 1 study observed that taste pore density in the fungiform papillae of children was higher than adults (Segovia et al. 2002), which could lead to increased taste sensation; whether taste pore density influences fat taste sensitivity is currently unknown. We observed intensity ratings that were higher in girls compared with boys. Others have noted higher detection thresholds (decreased taste acuity) in 8–9 year old boys for sweet and salty tastes compared with girls (James et al. 1997). The authors suggested that girls’ gustatory systems mature faster than boys of the same age, as girls’ thresholds did not differ from those of young adults.
As with girls, women also rated the highest concentration of LA as more intense than men. Previous research has been unable to resolve whether there are differences in fat taste sensitivity between males and females as some observe none (Mattes 2009; Stewart et al. 2010; Tucker et al. 2013), whereas others report increased sensitivity in women (Kamphuis et al. 2001; Tucker and Mattes 2013). Only one of these studies evaluated taste intensity (Mattes 2009), but LA was not evaluated. In general, our findings of increased sensitivity in women are in agreement with many (Ahne et al. 2000; Gudziol and Hummel 2007; Landis et al. 2009; Pingel et al. 2010) studies of other taste qualities but not all (James et al. 1997; Chang et al. 2006).
We observed no difference in the intensity ratings between obese versus nonobese adults in all but 1 instance. This finding is largely consistent with previous studies failing to observe differences between lean and overweight/obese individuals discussed above. Unlike other fat taste studies that relied on BMI, BIA was used to assess adiposity status. BMI is a popular measurement because it requires no specialized equipment, can be easily calculated by dividing weight (kg) by height (m)2, and is understood by a wide variety of audiences, including the general public. However, its predictive power for body fatness declines at low and high extremes (Ruiz et al. 2008; Romero-Corral et al. 2010).
Dietary intake data were collected from a subset of adult participants to examine whether previous intake influenced fat taste sensitivity. Rodent data suggests that dietary fat exposure decreases both CD36 mRNA and protein expression (Martin et al. 2011), but only in lean animals (Chevrot et al. 2013). CD36 is a putative nonesterified fatty acid receptor that is activated by LA (Gaillard et al. 2008). It has been posited that fewer CD36 receptors would reduce fat taste sensitivity. Consistent with this animal work, we observed that higher total and monounsaturated fat intakes at the previous eating occasion were weakly but significantly associated with decreased intensity ratings and polyunsaturated fat intake showed a trend in the same direction. However, unlike the rodent study, when stratified by obesity status based on BF% measured by BIA, obese participants’ ratings of the medium and high concentrations of LA were weakly but inversely associated with recent mono- and poly-unsaturated fat intake. Thus, it appears that obese humans’ taste sensitivity to fat diminishes to a greater degree due to prior dietary fat exposure than the nonobese. Ostensibly, reducing sensitivity to fat taste might be a protective mechanism designed to reduce intake of a high-energy nutrient in those with abundant fat reserves; however, the taste of fatty acids are routinely characterized as aversive by humans (Tucker et al. 2013), compared with rodents (Tsuruta et al. 1999), so this explanation relying simply on taste is unsatisfactory. Since the time between testing and eating occasion was not associated with intensity ratings, a question remains about the critical window of dietary fat intake and altered fat taste responsiveness. Until resolved, it would be prudent to ensure meals consumed prior to fat taste testing are standardized across participants.
This study features a number of strengths and limitations. The study setting, the Denver Museum of Nature & Science, is both. The Museum allowed for a very large sample size and greater statistical power, but ensuring the visitor experience at the Museum was enjoyable meant that testing had to be done in a short (30–45min) time frame. This restriction limited the amount and kind of testing that could be performed; thus, rather than determining detection thresholds as has been done in most of the other studies regarding fat taste sensitivity, we measured intensity ratings, which can be accomplished much more quickly. Body fatness was measured by BIA, a more accurate measure than BMI (Roubenoff 1996), reducing the likelihood of misclassification of obesity status. Analysis of dietary data was conducted on self-reported information of foods and beverages consumed during the last eating occasion prior to testing. A total of 360 adults provided intake data, but the information was not complete enough to be used in 138 (39%) of the cases. Thus, these data should be interpreted with some caution as there may be systematic differences in the intake or characteristics of those who did and did not provide usable data. However, there were no significant demographic differences (age, %BF) between those who provided diet information and those who did not.
In summary, this study further confirms that fatty acids are effective taste stimuli and are judged to be more intense by children and females. Edible taste strips were rated monotonically across increasing concentrations. Fat intake at the eating occasion prior to testing was negatively associated with intensity ratings, suggesting that participants in fat taste studies should receive standardized meals prior to testing. Adiposity status, as measured by BIA, was not reliably associated with taste intensity ratings in adults. Although adiposity fails to explain differences in fat taste intensity perception, other factors may play important roles. These factors include genetics (Keller et al. 2012), salivary composition (Mounayar et al. 2013; Voigt et al. 2014), habitual (Stewart and Keast 2012) or acute dietary fat intake as observed in this study, and/or other, as yet unidentified, factors.
Funding
This work was supported by the US Department of Agriculture (HATCH IND084055). The Genetics of Taste Lab is supported by both the Denver Museum of Nature & Science and the Denver Museum of Nature & Science Foundation.
Acknowledgments
The authors wish to thank the corps of volunteer citizen scientists in the Genetics of Taste Lab that helped to conduct this work; the Expedition Health core team at the Museum for their support of this crowdsourced and citizen science research model; Stephanie A. Santorico, PhD Associate Professor University of Colorado Denver, Dept. of Mathematical & Statistical Sciences Human Medical Genetics and Genomics Program, for statistical consulting; and Megan Hemmelgarn, Undergraduate Research Assistant at Bowling Green State University, for her assistance with the dietary analysis.
References
- Ahne G, Erras A, Hummel T, Kobal G. 2000. Assessment of gustatory function by means of tasting tablets. Laryngoscope. 110:1396–1401. [DOI] [PubMed] [Google Scholar]
- Chang WI, Chung JW, Kim YK, Chung SC, Kho HS. 2006. The relationship between phenylthiocarbamide (PTC) and 6-n-propylthiouracil (PROP) taster status and taste thresholds for sucrose and quinine. 51:427–432. [DOI] [PubMed] [Google Scholar]
- Chevrot M, Bernard A, Ancel D, Buttet M, Martin C, Abdoul-Azize S, Merlin J, Poirier H, Niot I, Khan NA, et al. 2013. Obesity alters the gustatory perception of lipids in the mouse: plausible involvement of the lingual CD36. J Lipid Res. 54:2485–2494. [DOI] [PMC free article] [PubMed] [Google Scholar]
- Chevrot M, Passilly-Degrace P, Ancel D, Bernard A, Enderli G, Gomes M, Robin I, Issanchou S, Verges B, Nicklaus S, et al. 2014. Obesity interferes with the orosensory detection of long-chain fatty acids in humans. Am J Clin Nutr. 99:975–983. [DOI] [PubMed] [Google Scholar]
- Dressler H, Smith C. 2013. Food choice, eating behavior, and food liking differs between lean/normal and overweight/obese, low-income women. Appetite. 65:145–152. [DOI] [PubMed] [Google Scholar]
- Ebba S, Abarintos RA, Kim DG, Tiyouh M, Stull JC, Movalia A, Smutzer G. 2012. The examination of fatty acid taste with edible strips. Physiol Behav. 106:579–586. [DOI] [PMC free article] [PubMed] [Google Scholar]
- Gaillard D, Laugerette F, Darcel N, El-Yassimi A, Passilly-Degrace P, Hichami A, Khan NA, Montmayeur JP, Besnard P. 2008. The gustatory pathway is involved in CD36-mediated orosensory perception of long-chain fatty acids in the mouse. FASEB J. 22:1458–1468. [DOI] [PubMed] [Google Scholar]
- Glanz K, Basil M. 1998. Why Americans eat what they do: taste, nutrition, cost, convenience, and weight control concerns. J Am Diet Assoc. 98(10):1118–1126. [DOI] [PubMed] [Google Scholar]
- Gudziol H, Hummel T. 2007. Normative values for the assessment of gustatory function using liquid tastants. Acta Oto-Laryngologica. 127:658–661. [DOI] [PubMed] [Google Scholar]
- Hyde RJ, Feller RP. 1981. Age and sex effects on taste of sucrose, NaCl, citric acid and caffeine. Neurobiol Aging. 2(4):315–318. [DOI] [PubMed] [Google Scholar]
- James CE, Laing DG, Jinks AL, Oram N, Hutchinson I. 2004. Taste response functions of adults and children using different rating scales. Food Qual Pref. 15(1):77–82. [Google Scholar]
- James CE, Laing DG, Oram N. 1997. A comparison of the ability of 8–9-year-old children and adults to detect taste stimuli. Physiol Behav. 62:193–197. [DOI] [PubMed] [Google Scholar]
- Kamphuis MM, Westerterp-Plantenga MS, Saris WH. 2001. Fat-specific satiety in humans for fat high in linoleic acid vs fat high in oleic acid. Eur J Clin Nutr. 55:499–508. [DOI] [PubMed] [Google Scholar]
- Keast RS, Azzopardi KM, Newman LP, Haryono RY. 2014. Impaired oral fatty acid chemoreception is associated with acute excess energy consumption. Appetite. 80:1–6. [DOI] [PubMed] [Google Scholar]
- Keller KL, Liang LC, Sakimura J, May D, van Belle C, Breen C, Driggin E, Tepper BJ, Lanzano PC, Deng L, et al. 2012. Common variants in the CD36 gene are associated with oral fat perception, fat preferences, and obesity in African Americans. Obesity. 20:1066–1073. [DOI] [PMC free article] [PubMed] [Google Scholar]
- Landis BN, Welge-Luessen A, Bramerson A, Bende M, Mueller CA, Nordin S, Hummel T. 2009. “Taste strips”—a rapid, lateralized, gustatory bedside identification test based on impregnated filter papers. J Neurol. 256:242–248. [DOI] [PubMed] [Google Scholar]
- Liu P, Shah BP, Croasdell S, Gilbertson TA. 2011. Transient receptor potential channel type M5 is essential for fat taste. J Neurosci. 31:8634–8642. [DOI] [PMC free article] [PubMed] [Google Scholar]
- Martin C, Passilly-Degrace P, Gaillard D, Merlin JF, Chevrot M, Besnard P. 2011. The lipid-sensor candidates CD36 and GPR120 are differentially regulated by dietary lipids in mouse taste buds: impact on spontaneous fat preference. PLoS One. 6:e24014. [DOI] [PMC free article] [PubMed] [Google Scholar]
- Martinez-Ruiz NR, Lopez-Diaz J, Wall-Medrano A, Jimenez-Castro JA, Angulo O. 2014. Oral fat perception is related with body mass index, preference and consumption of high-fat foods. Physiol Behav. 129:36–42. [DOI] [PubMed] [Google Scholar]
- Mattes RD. 2009. Oral thresholds and suprathreshold intensity ratings for free fatty acids on 3 tongue sites in humans: Implications for transduction mechanisms. Chem Senses. 34:415–423. [DOI] [PMC free article] [PubMed] [Google Scholar]
- Mattes RD. 2011. Oral fatty acid signaling and intestinal lipid processing: support and supposition. Physiol Behav. 105:27–35. [DOI] [PubMed] [Google Scholar]
- McCarthy H, Cole T, Fry T, Jebb S, Prentice A. 2006. Body fat reference curves for children. Int J Obes. 30(4):598–602. [DOI] [PubMed] [Google Scholar]
- Mennella JA, Ventura AK. 2010. Understanding the basic biology underlying the flavor world of children. Curr Zool. 56(6):834–841. [Google Scholar]
- Mojet J, Heidema J, Christ-Hazelhof E. 2003. Taste perception with age: generic or specific losses in supra-threshold intensities of five taste qualities? Chem Senses. 28(5):397–413. [DOI] [PubMed] [Google Scholar]
- Mounayar R, Septier C, Chabanet C, Feron G, Neyraud E. 2013. Oral fat sensitivity in humans: links to saliva composition before and after stimulation by oleic acid. Chemosens Percept. 6:118–126. [Google Scholar]
- Murphy C. 1993. Nutrition and chemosensory perception in the elderly. Crit Rev Food Sci Nutr. 33(1):3–15. [DOI] [PubMed] [Google Scholar]
- Pingel J, Ostwald J, Pau H, Hummel T, Just T. 2010. Normative data for a solution-based taste test. Eur Arch Otorhinolaryngol. 267:1911–1917. [DOI] [PubMed] [Google Scholar]
- Pop C, Bara L, Horj E, Iordache A, Laslo C, Culea M. 2010. Determination of free fatty acids in sausage meat. Bull UASVM Agric. 67(2):373–377. [Google Scholar]
- Romero-Corral A, Somers VK, Sierra-Johnson J, Korenfeld Y, Boarin S, Korinek J, Jensen MD, Parati G, Lopez-Jimenez F. 2010. Normal weight obesity: a risk factor for cardiometabolic dysregulation and cardiovascular mortality. Eur Heart J. 31(6):737–746. [DOI] [PMC free article] [PubMed] [Google Scholar]
- Roubenoff R. 1996. Applications of bioelectrical impedance analysis for body composition to epidemiologic studies. Am J Clin Nutr. 64(3 Suppl):459S–462S. [DOI] [PubMed] [Google Scholar]
- Ruiz JR, Sui X, Lobelo F, Morrow JR, Jr, Jackson AW, Sjöström M, Blair SN. 2008. Association between muscular strength and mortality in men: prospective cohort study. BMJ. 337:a439. [DOI] [PMC free article] [PubMed] [Google Scholar]
- Running CA, Mattes RD, Tucker RM. 2013. Fat taste in humans: sources of within- and between-subject variability. Prog Lipid Res. 52:438–445. [DOI] [PubMed] [Google Scholar]
- Segovia C, Hutchinson I, Laing DG, Jinks AL. 2002. A quantitative study of fungiform papillae and taste pore density in adults and children. Dev Brain Res. 138(2):135–146. [DOI] [PubMed] [Google Scholar]
- Shah NR, Braverman ER. 2012. Measuring adiposity in patients: the utility of body mass index (BMI), percent body fat, and leptin. PloS One. 7(4):e33308. [DOI] [PMC free article] [PubMed] [Google Scholar]
- Smutzer G, Lam S, Hastings L, Desai H, Abarintos RA, Sobel M, Sayed N. 2008. A test for measuring gustatory function. Laryngoscope. 118:1411–1416. [DOI] [PMC free article] [PubMed] [Google Scholar]
- Stein N, Laing D, Hutchinson I. 1994. Topographical differences in sweetness sensitivity in the peripheral gustatory system of adults and children. Dev Brain Res. 82(1):286–292. [DOI] [PubMed] [Google Scholar]
- Stewart JE, Feinle-Bisset C, Golding M, Delahunty C, Clifton PM, Keast RSJ. 2010. Oral sensitivity to fatty acids, food consumption and BMI in human subjects. Br J Nutr. 104:145–152. [DOI] [PubMed] [Google Scholar]
- Stewart JE, Keast RSJ. 2012. Recent fat intake modulates fat taste sensitivity in lean and overweight subjects. Int J Obes. 36:834–842. [DOI] [PubMed] [Google Scholar]
- Stewart JE, Newman LP, Keast RS. 2011a. Oral sensitivity to oleic acid is associated with fat intake and body mass index. Clin Nutr. 30:838–844. [DOI] [PubMed] [Google Scholar]
- Stewart JE, Seimon RV, Otto B, Keast RSJ, Clifton PM, Feinle-Bisset C. 2011b. Marked differences in gustatory and gastrointestinal sensitivity to oleic acid between lean and obese men. Am J Clin Nutr. 93:703–711. [DOI] [PubMed] [Google Scholar]
- Temple EC, Laing DG, Hutchinson I, Jinks AL. 2002. Temporal perception of sweetness by adults and children using computerized time-intensity measures. Chem Senses. 27:729–737. [DOI] [PubMed] [Google Scholar]
- Tsuruta M, Kawada T, Fukuwatari T, Fushiki T. 1999. The orosensory recognition of long-chain fatty acids in rats. Physiol Behav 66:285–288. [DOI] [PubMed] [Google Scholar]
- Tucker RM, Edlinger C, Craig BA, Mattes RD. 2014a. Associations between BMI and fat taste sensitivity in humans. Chem Senses. 39:349–357. [DOI] [PMC free article] [PubMed] [Google Scholar]
- Tucker RM, Laguna L, Quinn R, Mattes RD. 2013. The effect of short, daily oral exposure on non-esterified fatty acid sensitivity. Chemosens Percept. 6:78–85. [Google Scholar]
- Tucker RM, Mattes RD. 2012. Are free fatty acids effective taste stimuli in humans? Presented at the symposium “The Taste for Fat: New Discoveries on the Role of Fat in Sensory Perception, Metabolism, Sensory Pleasure and Beyond” held at the Institute Of Food Technologists 2011 Annual Meeting, New Orleans, LA., June 12, 2011. J Food Sci. 77:S148–S151. [DOI] [PubMed] [Google Scholar]
- Tucker RM, Mattes RD. 2013. Influences of repeated testing on nonesterified fatty acid taste. Chem Senses. 38:325–332. [DOI] [PubMed] [Google Scholar]
- Tucker RM, Mattes RD, Running CA. 2014b. Mechanisms and effects of “fat taste” in humans. Biofactors. 40:313–326. [DOI] [PubMed] [Google Scholar]
- USDA. 2010. Standards for grades of olive oil and olive-pomace oil. Available from: http://www.ams.usda.gov/AMSv1.0/getfile?dDocName=STELDEV3011889 [Google Scholar]
- Voigt N, Stein J, Galindo MM, Dunkel A, Raguse JD, Meyerhof W, Hofmann T, Behrens M. 2014. The role of lipolysis in human orosensory fat perception. J Lipid Res. 55(5):870–882. [DOI] [PMC free article] [PubMed] [Google Scholar]


