

Abstract
Background
Genome wide-association studies have successfully identified several hundred independent loci harboring common cancer susceptibility alleles that are distinct from the more than 110 cancer predisposition genes. The latter are generally characterized by disruptive mutations in coding genes that have been established as ‘drivers’ of cancer in large somatic sequencing studies. We set out to determine whether, similarly, common cancer susceptibility loci map to genes that have altered frequencies of mutation.
Results
In our analysis of the intervals defined by the cancer susceptibility markers, we observed that cancer susceptibility regions have gene mutation frequencies comparable to background mutation frequencies. Restricting analyses to genes that have been determined to be pleiotropic across cancer types, genes affected by expression quantitative trait loci, or functional genes indicates that most cancer susceptibility genes classified into these subgroups do not display mutation frequencies that deviate from those expected. We observed limited evidence that cancer susceptibility regions that harbor common alleles with small estimated effect sizes are preferential targets for altered somatic mutation frequencies.
Conclusions
Our findings suggest a complex interplay between germline susceptibility and somatic mutation, underscoring the cumulative effect of common variants on redundant pathways as opposed to driver genes. Complex biological pathways and networks likely link these genetic features of carcinogenesis, particularly as they relate to distinct polygenic models for each cancer type.
Background
The genetic basis of cancer susceptibility was first recognized in 1866 by the French neuroscientist Paul Broca, who noted clustering of breast cancer cases in his own family [1]. Generations of studies have observed an increase in the frequencies of cancer within families and between twins. In 1953, Nordling proposed that cancer is caused not by one but a number of mutations that are multiplied and accumulated over time [2]. Knudson further extended Nordling’s theory with his “two hit” hypothesis in which he proposed that retinoblastoma could develop due to an inherited germline mutation in combination with a somatic mutation [3]. While limited data were available when Nordling and Knudson first introduced their theories of the genetic basis of select cancers, recent cancer consortiums and technological advances have produced troves of data to explore the interplay between germline genetics and acquired somatic mutations.
Genome-wide association studies (GWAS) have generated a catalog of common susceptibility variants with small effect sizes that cumulatively contribute to sporadic cancer through a polygenic model [4, 5]. The combination of an agnostic analytical approach for scanning thousands of markers across the genome together with the scalability of studies drawn from different designs has accelerated the pace of discovery of markers, usually single nucleotide polymorphisms (SNPs) with minor allele frequencies greater than 5 %. Cancer GWAS have conclusively identified over 400 distinct susceptibility loci in over two dozen distinct cancers, including common cancers (e.g., breast, colon, and prostate) as well as rarer pediatric cancers (e.g., Ewing sarcoma and neuroblastoma) [6, 7]. To date, nearly all discovered susceptibility loci harbor many highly correlated SNPs, almost all mapping to the non-coding regions in genes, and roughly one-fifth have no nearby plausible candidate gene [7].
The Cancer Genome Atlas (TCGA) project along with other cancer genome sequencing initiatives, such as the International Cancer Genome Consortium, have emerged as indispensable resources for investigating the mutational landscape of cancer genomes [8, 9]. Utilizing next-generation sequencing technologies, these projects have mapped somatic mutations, localized copy number changes, and demonstrated that cancer genomes accumulate mutations over time; many of the mutations map to genes known to alter mechanisms that keep cellular proliferation in check [10].
An abundance of data exists on either cancer germline susceptibility alleles or somatic mutations, but little has been done to explore the interplay between germline genetics and somatic mutations in carcinogenesis. It is possible there is an overlap between germline cancer predisposing mutations and somatic cancer driver mutations. A prior investigation of cancer predisposition genes found that perhaps more than 40 % were oncogenic when mutated in tumor DNA [11]. The investigation also surveyed known cancer GWAS susceptibility loci at the time and found only 4 % of GWAS loci falling within cancer predisposition genes. For these cancer predisposition genes, none of the GWAS associated cancers matched the respective cancer subtypes that occurred in carriers of rare, high penetrant mutations, suggesting the mechanisms linking common, low penetrant alleles and rare, high penetrant alleles with cancer may be etiologically distinct.
Our goal was to investigate whether genes in cancer susceptibility regions harboring common variants with small estimated effect sizes have altered somatic mutation frequencies. Based on a literature search to aggregate published cancer susceptibility loci, we investigated somatic mutation frequencies using the cBioPortal database [12, 13] and TCGA in genes that fall within the intervals defined by the correlated variants discovered in cancer GWAS, and compared these mutation frequencies with expected cancer-specific background mutation frequencies. We explored further the relationship between germline susceptibility loci and somatic mutation frequency by examining mutation frequencies in a refined subset of genes shown to be pleiotropic across cancer types, affected by expression quantitative trait loci, or functionally important. Apart from a few notable exceptions, cancer-specific mutation frequencies for genes in susceptibility regions were not found to significantly differ from background mutation frequencies.
Results
Results from the cancer GWAS literature search for each cancer subtype investigated are presented in Table 1. A total of 263 distinct germline susceptibility regions were reported as of 25 August 2014 and serve as the basis for this analysis. Breast and prostate cancer had the most discovered susceptibility regions with 80 and 71, respectively, after which were colon and skin cancer, each with 14 or more discovered susceptibility regions. Stomach and endometrial cancer had the fewest number of discovered susceptibility regions, each having fewer than five.
Table 1.
Number of included cancer susceptibility regions and nearby genes for each cancer type investigated
| Cancer subtype | GWAS loci | LD genes | Nearby genes |
|---|---|---|---|
| Bladder | 12 | 103 | 264 |
| Breast | 80 | 702 | 1324 |
| Cervical | 7 | 148 | 290 |
| Colon | 25 | 215 | 421 |
| Endometrial | 1 | 1 | 18 |
| Glioma | 9 | 90 | 212 |
| Kidney | 5 | 12 | 48 |
| Liver | 7 | 89 | 195 |
| Lung | 10 | 257 | 350 |
| Multiple myeloma | 5 | 129 | 219 |
| Ovarian | 10 | 119 | 213 |
| Prostate | 71 | 697 | 1583 |
| Skin | 14 | 311 | 493 |
| Stomach | 2 | 12 | 24 |
| Thyroid | 5 | 15 | 40 |
| Total | 263 | 2190 | 4103 |
All cancer susceptibility regions have a published p value less than 5 × 10⁻⁸, are independent of each other, are associated with cancer in European populations, and were discovered prior to 25 August 2014. Linkage disequilibrium (LD) genes are those within the LD block of the susceptibility variant. Nearby genes are defined as those within the LD block of the susceptibility variant or within 500 kb of the LD block. For the genes, the total is for all unique genes and excludes duplicates across cancer types
Each cancer susceptibility variant was run through our analysis pipeline to generate a list of potentially affected genes that are within or near the linkage disequilibrium (LD) block defined by the combination of correlated SNPs and recombination hot spots that encompasses the susceptibility variant. The total number of genes is tabulated in Table 1. A total of 2190 unique genes are located in LD blocks of GWAS susceptibility loci and an additional 1913 are located ±500 kb of the LD blocks. A total of 24,482 genes are annotated in RefSeq Genes and 8.9 % of these genes thus fall within LD blocks of currently discovered variants for the cancer subtypes reported.
To investigate cancer subtype-specific background frequencies of mutation for genes falling within GWAS regions, we estimated cancer-specific frequencies of somatic mutation for all RefSeq genes. Across all cancers, the majority of RefSeq genes were not mutated; genes that did have mutations generally had frequencies lower than 4 % of individuals sampled. The top mutated gene for each cancer subtype is listed in Table 2. Examples of highly mutated genes include APC, ERG, PTEN, TP53, and TTN. Interestingly, none of these highly mutated genes map within or around LD blocks of cancer susceptibility regions for the respective cancer subtype.
Table 2.
Top somatically mutated genes by cancer subtype
| Cancer subtype | Samples | Most mutated (percentage samples) | GWAS locus |
|---|---|---|---|
| Bladder | 328 | PIK3CA (20.43) | No |
| Breast | 1257 | TP53 (33.73) | No |
| Cervical | 39 | TTN (51.28) | No |
| Colon | 224 | APC (75.00) | No |
| Endometrial | 248 | PTEN (64.92) | No |
| Glioma | 289 | IDH1 (76.12) | No |
| Kidney (chrom) | 66 | MUC4 (66.67) | No |
| Kidney (clear) | 522 | VHL (46.55) | No |
| Kidney (pap) | 168 | TTN (25.00) | No |
| Liver | 258 | TP53 (32.17) | No |
| Lung (adeno) | 676 | TP53 (47.34) | No |
| Lung (small) | 71 | TP53 (87.32) | No |
| Lung (squamous) | 178 | TP53 (90.45) | No |
| Multiple Myeloma | 205 | ADAM6 (30.73) | No |
| Ovarian (serous) | 316 | TP53 (94.62) | No |
| Ovarian (small) | 12 | SMARCA4 (91.67) | No |
| Prostate | 584 | ERG (29.87) | No |
| Skin | 490 | TTN (67.14) | No |
| Stomach | 220 | TTN (56.36) | No |
| Thyroid | 401 | BRAF (61.35) | No |
Distributions of gene mutation frequencies within cancer susceptibility regions are compared with expected background frequencies of mutation for all RefSeq genes in Fig. 1. Differences in overall distribution of gene mutation frequencies were noted across cancer types and mirrored previously described cancer-specific mutation frequencies [14]. Skin, lung, colon, and cervical cancer subtypes were observed to exhibit higher background mutation frequencies than kidney, liver, or thyroid cancer. However, mutation frequencies for genes within or around LD blocks of cancer-specific susceptibility regions closely mirrored cancer subtype-specific background mutation frequencies. Only prostate and liver cancer displayed significantly different distributions for background and cancer susceptibility region mutation frequencies (Kolmogorov-Smirnov p < 0.05). Prostate cancer susceptibility regions were found to have a marginally lower mean gene mutation frequency than background (0.137 versus 0.154, p value = 0.038). Likewise, liver cancer susceptibility regions had lower mean gene mutation frequency than background (0.086 versus 0.321, p value < 0.001).
Fig. 1.

Mutations frequencies in cancer susceptibility regions compared with subtype-specific background mutation frequencies. Cancer subtypes displayed for breast (a), colon (b), melanoma (c), and prostate cancer (d)
Highly mutated genes within LD regions of each cancer subtype are presented in Table 3. Overall, skin cancer had the highest somatic mutation frequencies for genes within cancer susceptibility regions, with SORCS3, CDKN2A, and TRIOBP all having mutations in over 10 % of samples. Bladder cancer, colon cancer, cervical cancer, and glioblastoma also had genes located in susceptibility regions with mutations in more than 10 % of samples. Cancers with low mutation frequencies in susceptibility regions include all subtypes of kidney, liver, multiple myeloma, and serous ovarian cancers; for each of these cancers, the somatic mutation prevalence was less than 5 %. Thyroid cancer had a particularly low somatic mutation frequency in susceptibility regions, with all genes having somatic mutations below 1 %.
Table 3.
Top somatically mutated genes in cancer susceptibility regions
| Cancer subtype | First | Second | Third | Fourth | Fifth |
|---|---|---|---|---|---|
| Bladder | FGFR3 (14.939) | EPG5 (3.049) | TP63 (2.744) | GIGYF2 (2.439) | MECOM (2.439) |
| Breast | MAP3K1 (6.285) | SYNE1 (4.773) | BRCA2 (2.784) | ZFHX4 (2.705) | NOTCH2 (1.591) |
| Cervical | COL11A2 (10.256) | MED1 (10.256) | EHMT2 (7.692) | CDK12 (7.692) | ABCF1 (5.128) |
| Colon | HYDIN (11.161) | RYR3 (9.821) | MAP3K4 (7.143) | IGF2R (6.696) | MYO1B (5.804) |
| Endometrial | ACACA (7.661) | SYNRG (2.823) | TADA2A (2.419) | DUSP14 (1.613) | C17orf78 (1.210) |
| Glioma (glioblastoma) | EGFR (20.235) | PLEKHG4B (1.760) | CDKN2A (1.466) | HELZ2 (1.466) | SLC6A19 (1.173) |
| Glioma (low grade) | EGFR (5.882) | SLC6A3 (2.076) | PLEKHG4B (1.384) | SLC6A19 (1.384) | KMT2A (1.384) |
| Kidney (chromophobe) | ORAOV1 (1.515) | PPFIA1 (1.515) | SHANK2 (1.515) | NA (−.---) | NA (−.---) |
| Kidney (clear cell) | ITPR2 (1.724) | PPFIA1 (1.149) | PRKCE (0.766) | ZEB2 (0.766) | EPAS1 (0.575) |
| Kidney (papillary) | ITPR2 (3.571) | PPFIA1 (2.381) | PRKCE (1.190) | ZEB2 (1.190) | FGF3 (1.190) |
| Liver | PIK3CD (1.938) | KIF1B (1.938) | CASZ1 (1.550) | MYO1B (1.550) | CLDN8 (1.550) |
| Lung (adenoma) | NOTCH4 (6.509) | TNXB (5.178) | MDC1 (3.402) | PLEKHG4B (3.254) | ZBED9 (3.254) |
| Lung (small cell) | ZBED9 (7.042) | SLC17A2 (5.634) | BRD9 (4.225) | SLC6A19 (4.225) | HIST1H2AA (4.225) |
| Lung (squamous) | TNXB (5.618) | SLC6A3 (5.056) | LRRC16A (3.933) | BTN2A2 (3.933) | ZBED9 (3.933) |
| Multiple myeloma | LTB (1.951) | NEU1 (1.951) | DNAH11 (1.951) | TNXB (1.463) | CACNA1I (1.463) |
| Ovarian (serous) | CPAMD8 (1.899) | UNC13A (1.266) | MAST3 (1.266) | HOXD10 (0.949) | C10orf113 (0.949) |
| Ovarian (small) | JAK3 (8.333) | NA (−.---) | NA (−.---) | NA (−.---) | NA (−.---) |
| Prostate | SPOP (7.877) | SYNE1 (3.425) | RYR1 (2.397) | TNXB (2.055) | APOB (1.712) |
| Skin | SORCS3 (14.082) | CDKN2A (13.878) | TRIOBP (11.224) | ANKRD11 (8.571) | AOX1 (8.367) |
| Stomach | ZBTB20 (7.273) | MROH2B (5.455) | C6 (4.545) | DRD3 (2.727) | OXCT1 (2.727) |
| Thyroid | TNS1 (0.748) | TDRD7 (0.499) | TBC1D2 (0.499) | MBIP (0.499) | NKX2-1 (0.499) |
Top gene name shown with percentage of samples mutated shown in parentheses
NA no additional mutated genes for cancer subtype
When we merged all genes from cancer susceptibility loci together and assessed their mutation frequency in relation to distance from the most associated susceptibility variant, we observed a pattern in which genes with higher mutation frequency tend to be closer in proximity to the most highly associated susceptibility variant (Fig. 2). This relationship was observed both within susceptibility regions of each cancer subtype (data shown for breast and prostate) and overall across cancer type. However, when comparing the distribution of gene mutation frequency for all cancer susceptibility regions to ten permutations of randomly selected array genotyped variants, the same overall pattern of a few genes in close proximity to the original susceptibility variant with higher mutation frequencies was observed. This suggests the observed relationship is not a function of genes near cancer susceptibility variants harboring higher mutation frequencies, but rather due to non-random placement of genes throughout the genome resulting in a higher density of genes in these susceptibility regions and thus a greater probability of outliers. To investigate if average frequencies of gene mutation are different based on distance from the susceptibility variant, 500-kb bins were constructed around susceptibility variants and mean frequencies of gene mutation were calculated (Fig. 3). No biologically relevant relationship was observed in gene mutation frequency in relation to distance from cancer susceptibility variant.
Fig. 2.
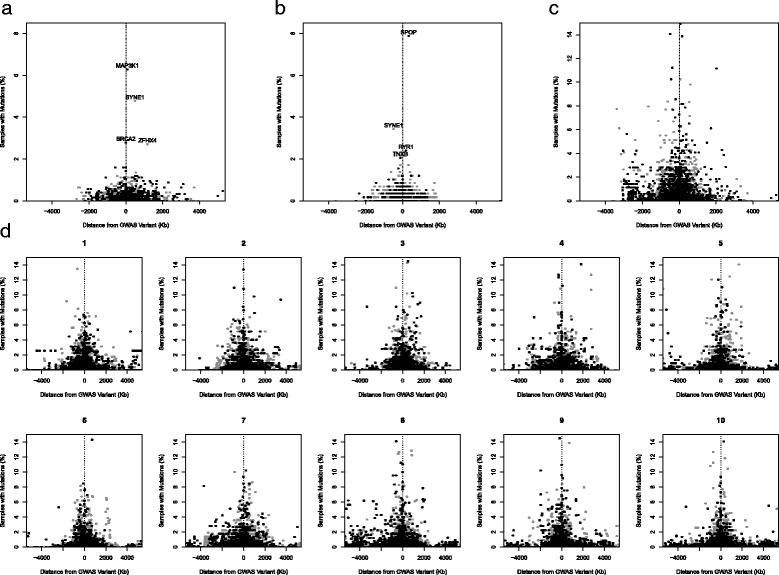
Frequency of gene mutations around cancer susceptibility variants. Black points are genes in LD blocks and gray points are genes outside LD blocks. Data for breast (a), prostate (b), all cancers (c), and random permutations (d) are plotted
Fig. 3.

Mean gene mutation frequencies based on 500-kb bins. Solid black line is the average mutation frequency. Points are the mean bin mutation frequencies and error bars represent the 95 % confidence interval around the bin mean. Dashed gray lines are bin boundaries and the dashed black line is the location of the cancer susceptibility SNP relative to genes in the 500-kb bins
In an effort to remove the mutational signal of a possibly affected gene or genes at the cancer susceptibility loci from the background noise of other nearby but unaffected genes, the most mutated gene at each cancer susceptibility locus was selected and combined with all other top mutated genes in susceptibility regions. The analysis only included cancers with more than 200 sequenced cancer genomes, so stable estimates of mutation frequency were available. The distribution of gene mutation frequency for top mutated genes in cancer susceptibility regions was compared with distributions of top mutated genes from ten permutations of randomly selected SNPs. The observed distributions were remarkably similar with Kolmogorov-Smirnov tests indicating no significant differences with respect to GWAS susceptibility loci (Fig. 4).
Fig. 4.

Top mutated gene for each cancer susceptibility region in cancers with more than 200 samples. GWAS Genes shows the observed distribution across all cancer types. Permutation Genes are a merged gene set across ten permutations of autosomal regions randomly selected throughout the genome
In an attempt to filter out potential functional genes in cancer susceptibility regions we performed a set of restricted analyses based on the level of functional evidence for each gene. Three classes of genes were of interest: (1) genes found to be in cancer susceptibility regions across multiple cancer subtypes, “pleiotropic genes”; (2) genes whose expression levels are associated with cancer susceptibility loci, “eQTL genes”; and (3) genes with experimental evidence linking a cancer susceptibility locus to a “functional gene”, based on laboratory investigation demonstrating an alteration in the regulation of one or more genes [15–30]. MutSigCV was used to find matching genes for each gene in these gene sets that have similar gene expression levels, DNA replication timing, and chromatin state, all of which are factors know to influence mutation frequency. For the pleiotropic gene analysis, results indicated no overall difference in mutation frequency z score (mean z score = 0.299, 95 % confidence interval (CI) = −0.074–0.672, p value = 0.11; Fig. 5a). Elevated frequencies of mutations were observed for CDKN2A (skin), PIK3C2B (breast, prostate), PLCE1 (esophageal), TET2 (breast), and TP63 (bladder, lung). The eQTL gene analysis results also indicated no overall difference in mutation frequency z score (mean z score = 0.339, 95 % CI = −0.010–0.688, p value = 0.06; Fig. 5b). The highest mutation frequencies for eQTL genes were observed in FGFR2, ITPR1, KIF13P, MAGI3, MGGT10, NOTCH2, SYNE1, and TACC2 for breast cancer, MAP3K4 for colon cancer, MYO1B and PIK3CD for liver cancer, IRX4 for pancreatic cancer, and LMTK2, PDLIM5, SP4, and SYNE1 for prostate cancer. The analysis of functional genes found an overall increased mutation frequency (mean z score = 0.827, 95 % CI = 0.087–1.568, p value = 0.03; Fig. 5c). Of the 29 functional genes investigated, six had elevated mutation frequencies. These genes include TP63 for bladder cancer, FGFR2 and MAP3K1 for breast cancer, HNF1B for ovarian cancer, KLK3 for prostate cancer, and CDKN2A for skin cancer.
Fig. 5.

Normalized mutation frequency (z scores) of genes with varying levels of functional evidence. Analyses are shown for three overall gene classes: (a) pleiotropic genes, (b) eQTL genes, and (c) functional target genes. Grey points are mutation z score values and black diamonds are mean mutation frequencies
Discussion
Our analysis of 263 published cancer susceptibility regions harboring common alleles, the majority of which were identified by GWAS, suggests that frequencies of somatically acquired mutations do not differ from background frequencies of gene mutation observed in the corresponding cancer. In other words, we did not observe evidence that common risk alleles appear to overlap with drivers of cancers. When refining our analysis to a subset of genes with functional evidence linking them to a susceptibility signal, our analysis indicates most of these target genes do not experience mutation frequencies that deviate from the expected. Except for a few notable examples, our observations suggest genes in regions harboring common germline susceptibility alleles do not exhibit an overall increase in mutation frequency, which is distinct from the more than 110 cancer predisposition genes [11].
The absence of an overall observed difference in mutation frequency at cancer susceptibility regions could be attributed to a signal-to-noise detection issue in which the methods we employed were not sufficiently sensitive to remove the signal of one to possibly two affected genes from a pool of potentially dozens of unaffected genes. To reduce the possibility that changes in mutation frequency were masked by statistical noise, we analyzed the data under several different analytical frameworks. First, frequencies of somatic mutation of all genes located in susceptibility regions do not deviate from expected background frequencies based on cancer subtype. Second, distributions of gene mutation frequency were similar when comparing susceptibility regions with ten permutations of random regions. Third, when restricted to the most highly mutated genes in intervals defined by susceptibility alleles in comparison to the randomly selected regions, no difference in distribution of somatic mutation frequency was detected.
The large genomic regions and number of genes covered by the spread of linkage disequilibrium with cancer susceptibility variants highlight the complexity of functionally mapping variants to their biological underpinnings. Regional and ancestry-specific differences in LD structure coupled with cell line-specific differences in chromatin patterns and receptor binding sites make it difficult to design high-throughput methods that are sensitive and specific enough to filter the large list of possibly affected genes. Focusing on genes implicated in multiple cancer subtypes as well as genes whose expression levels are influenced by cancer susceptibility loci are ways of enriching for genes that may be functional and thus may experience altered mutation frequencies [31, 32]. In addition, several focused efforts have been fruitful in identifying a handful of cancer susceptibility regions where the affected gene has been determined [15–30]. When we compared sets of polygenic genes, eQTL genes, and functionally mapped genes with covariate matched genes, a modest overall enrichment for elevated mutation frequency was observed; however, this enrichment was only statistically significant for the functionally mapped genes (p = 0.03). In each set, a subset of genes experienced elevated mutation frequencies, whereas the majority of genes in these regions demonstrate no elevated mutation frequencies. These observations suggest that if the functional genes of cancer susceptibility alleles do have elevated mutation frequencies, then the increases are minimal for most and do not overlap with established drivers of cancer.
The observation of no notable overall change in somatic mutation frequency in genes within cancer susceptibility regions could perhaps be explained as follows. Most cancer-associated variants are relatively common, have low estimated effects, and are often located in regulatory elements that cause minor changes in gene expression (e.g., the bladder cancer rs2978974 locus and PSCA expression levels [16]). It is also plausible that genes targeted by cancer susceptibility regions might affect other host factors — for example, the cells responsible for the immune response to tumors — and we may, therefore, be looking at mutation frequencies in the wrong tissue type. Purifying selection is expected to remove deleterious variation from the gene pool, but is less effective at removing cancer susceptibility variants with minor effects, allowing such variants to reach common frequencies in human populations, particularly since most cancers occur well after the age of reproduction. On the contrary, somatic mutations across cancer genomes often cluster in important genes regulating cellular growth, cell cycle checkpoints, and DNA repair. These mutations act as driver mutations (e.g., oncogenes or tumor suppressor genes) with highly deleterious effects, usually leading to a downstream cascade of later mutations in other important genes. Differences in mutational frequency in cancer susceptibility target genes and cancer predisposition genes might reflect the level of functional importance of these genes in maintenance of normal cellular integrity. For example, cancer predisposition genes that are often somatically mutated may be located at highly conserved cores of essential biological pathways, whereas cancer susceptibility target genes with average mutation frequencies might be genes with a high degree of functional redundancy. As a result, a somatic mutation of a cancer susceptibility functional gene (defined by a common, low-effect variant) may be neither sufficient nor necessary to lead to cancer development, as evidenced by the low relative risks observed in GWAS. Still, the accumulation of many small effects of common alleles appears to account for a substantial fraction of the genetic risk for sporadic adult cancers; the steady cataloging of common susceptibility alleles supports the contribution of a polygenic risk model, involving many small perturbations of redundant pathways, as suggested by our data.
Conclusions
There is likely a complex interplay between germline genetics and somatic mutations. The germline can alter cancer risk over time due to small perturbations in many key, redundant pathways, some of which could permit escape of dangerous somatically altered cells. Somatic mutations occurring in important oncogenes or tumor suppressor genes may serve as a necessary hit required to drive the process of carcinogenesis. Apart from a few exceptions, our analysis suggests genes nearby common germline susceptibility variants do not display overall increased somatic mutation frequencies, unlike the cancer predisposition genes. Future work focused on understanding the biological basis of cancer susceptibility alleles will be instrumental in better understanding the complex interplay between germline genetics and somatic mutations.
Materials and methods
A literature search of PubMed was performed to identify all reports of cancer susceptibility studies published before 25 August 2014. These publications were merged with reports from the National Human Genome Research Institute’s Catalog of Published Genome-wide Association Studies [6] to arrive at a comprehensive list of genetic variants associated with germline susceptibility to cancer. Further filtering was performed to remove variants with association p values greater than 5 × 10⁻⁸, highly correlated variants in high LD, and variants discovered in populations of non-European ancestry.
An analysis pipeline using custom Python scripts (Python 2.7.5 [33]) was developed to extract potential genes of interest around cancer susceptibility regions (available at [34] through the MIT license). First, LD blocks were defined based on European recombination frequency data from HapMap Phase 2 [35]. These frequencies were estimated from phased haplotypes in HapMap release 22 (NCBI 36) for the CEU population and are publically available for download [36]. We defined LD blocks as all genomic positions neighboring the tagging susceptibility variant that are within recombination frequency peaks of 20 cM/Mb or higher. Second, a window of interest around the tagging susceptibility variant was extended by 500 kb in both directions beyond the LD block boundaries to ensure the inclusion of additional genes potentially regulated by the susceptibility region since cancer susceptibility variants may have functional effects on genes that are outside the LD block. Third, genes were extracted that overlap the window of interest around each significant cancer susceptibility locus. We utilized the RefSeq Gene [37] database publically available on the UCSC FTP site [38]. For genes with multiple transcripts, inclusion in the susceptibility window of interest was based on the start coordinate of the transcript with the earliest start position and the end coordinate of the transcript with the latest stop position.
The analytical pipeline generated lists of putative genes altered or regulated by one or more variants residing in the LD block of a GWAS associated tagging SNP. Each gene was investigated for mutations using available tumor genomes from databases. The frequency of mutations per gene of several cancer types was extracted from the cBioPortal database [12, 13, 39]. Tumor genomes were available from Asan Medical Center (AMC) [40], Beijing Genomics Institute (BGI) [41, 42], British Columbia Cancer Research Centre [43], BROAD Institute [44–49], Cornell University [47, 48], Clinical Lung Cancer Genome Project (CLCGP) [50], Genentech [51], Johns Hopkins University [52], Memorial Sloan-Kettering Cancer Center (MSKCC) [53–55], International Cancer Genome Consortium (ICGC), RIKEN [56], Sanger Institute [57], TCGA [58–68], Tumor Sequencing Project (TSP) [69], University of Michigan [70], and Yale University [71]. We queried tumor sequencing data through the CGDS-R package using R version 3.0.1 “Good Sport” [72].
To estimate cancer-specific background frequencies of mutation, mutation frequencies for all RefSeq genes were queried for each cancer subtype. Background mutation frequencies were compared with frequencies of mutation for genes within cancer susceptibility regions to investigate differences in mutation frequency. Statistical significance was assessed by two-sample Kolmogorov-Smirnov tests. Furthermore, to estimate the expected distribution of gene mutational burden across cancer genomes, we performed random sampling throughout the genome. For each cancer type, a random autosomal SNP present on the commercially available Illumina 660 W-Quad genotyping platform was chosen to represent each significant cancer susceptibility allele marked by one or more SNP variants. Randomly chosen SNPs were analyzed using the same pipeline, the genes in the LD region were extracted, and mutational frequencies for the genes were queried in cBioPortal. To provide statistical robustness, ten permutations of this procedure were performed for each cancer type. Distributions from each of the ten permutations were compared with that of the observed mutational distribution of the cancer type to assess for significant differences in mutational frequency.
Several cancer susceptibility regions have at least some level of evidence linking a gene to a cancer susceptibility signal. The first set of genes with a higher probability of being functional is a set of “pleiotropic genes” which we define as any gene that was associated at genome-wide significance levels (p < 5 × 10⁻⁸) with more than one cancer subtype. A second set of interest is “eQTL genes”, which are genes whose expression levels are affected by a cancer susceptibility variant. These eQTL genes are filtered out by performing eQTL analyses for all genes in the LD window plus 500 kb around cancer susceptibility variants. Publically available TCGA expression and genotyping data were used in combination with linear regression models to determine if there was significant evidence for an eQTL. If the cancer susceptibility variant of interest was not directly genotyped, a genotyped variant in high LD (R2 > 0.6) was used as a surrogate. Finally, a set of “functional genes” was extracted from a literature search. Functional genes were defined as any gene with at least one publication linking a cancer susceptibility locus to a gene with experimental evidence [15–30]. To explore whether these sets of functionally enriched genes had altered frequencies of somatic mutation, lists of genes with similar expected background mutation frequencies were generated using MutSigCV [14]. Genes were matched based on transcriptional activity, DNA replication timing, and chromatin state. Lists of up to 50 matching genes were generated for each functional gene. Cancer-specific frequencies of mutation were extracted from cBioPortal, and mutation z scores were calculated based on means and standard deviations of matching gene sets.
All plotting and statistical analyses were performed in R version 3.0.1 “Good Sport” [72] on a 64-bit Windows platform. Statistical tests and reported p values are two-sided.
Data availability
All datasets used to assess tumor mutation frequency are publically available at cBioPortal. Cancer subtype-specific accession codes are as follows: bladder (blca_mskcc_solit_2012, blca_bgi, blca_tcga_pub, blca_tcga); breast (brca_bccrc, brca_broad, brca_sanger, brca_tcga_pub, brca_tcga); cervical (cesc_tcga); colon (coadread_genetech, coadread_tcga_pub, coadread_tcga); endometrial (ucec_tcga, ucec_tcga_pub); esophageal (esca_broad); glioma (glioblastoma: gbm_tcga_pub2013, gbm_tcga_pub, gbm_tcga; glioma: lgg_tcga); kidney (chromophobe: kich_tcga; clear: kirc_bgi, kirc_tcga_pub, kirc_tcga; papillary: kirp_tcga); liver (lihc_amc_prv, lihc_riken); lung (adeno: luad_broad, luad_tcga_pub, luad_tcga, luad_tsp; small: sclc_clcgp, sclc_jhu; squamous: lusc_tcga_pub, lusc_tcga); multiple myeloma (mm_broad); ovarian (serous: ov_tcga_pub, ov_tcga; small: scco_mskcc); pancreatic (paad_icgc, paad_tcga); prostate (prad_broad_2013, prad_broad, prad_mskcc, prad_tcga, prad_mich); skin (skcm_broad, skcm_tcga, skcm_yale); stomach (stad_tcga); and thyroid (thca_tcga).
Abbreviations
- CI
confidence interval
- eQTL
expression quantitative trait locus
- GWAS
genome-wide association study
- LD
linkage disequilibrium
- SNP
single nucleotide polymorphism
- TCGA
The Cancer Genome Atlas
Footnotes
Competing interests
The authors declare that they have no competing interests.
The findings and conclusions in this report are those of the author(s) and do not necessarily represent the views of the National Institute of Health.
Authors’ contributions
MM participated in the design of the study, performed statistical analyses and drafted the manuscript. BH participated in Python script development, performed statistical analyses, and drafted the manuscript. VF participated in the literature review and drafted the manuscript. XH participated in the design of the study and the MutSigCV analysis. SC conceived of the study, participated in the design, and drafted the manuscript. All authors read and approved the final manuscript.
Contributor Information
Mitchell J. Machiela, Phone: (301) 435-6391, Email: mitchell.machiela@nih.gov
Brian M. Ho, Email: bmh5@rice.edu
Victoria A. Fisher, Email: fisherva@mail.nih.gov
Xing Hua, Email: xing.hua@nih.gov.
Stephen J. Chanock, Email: chanocks@mail.nih.gov
References
- 1.Broca P. Traite des tumeurs. Paris: P. Asselin; 1866. [Google Scholar]
- 2.Nordling CO. A new theory on cancer-inducing mechanism. Br J Cancer. 1953;7:68–72. doi: 10.1038/bjc.1953.8. [DOI] [PMC free article] [PubMed] [Google Scholar]
- 3.Knudson AG., Jr Mutation and cancer: statistical study of retinoblastoma. Proc Natl Acad Sci U S A. 1971;68:820–3. doi: 10.1073/pnas.68.4.820. [DOI] [PMC free article] [PubMed] [Google Scholar]
- 4.Yang J, Manolio TA, Pasquale LR, Boerwinkle E, Caporaso N, Cunningham JM, et al. Genome partitioning of genetic variation for complex traits using common SNPs. Nat Genet. 2011;43:519–25. doi: 10.1038/ng.823. [DOI] [PMC free article] [PubMed] [Google Scholar]
- 5.Pharoah PD, Antoniou AC, Easton DF, Ponder BA. Polygenes, risk prediction, and targeted prevention of breast cancer. N Engl J Med. 2008;358:2796–803. doi: 10.1056/NEJMsa0708739. [DOI] [PubMed] [Google Scholar]
- 6.Welter D, MacArthur J, Morales J, Burdett T, Hall P, Junkins H, et al. The NHGRI GWAS Catalog, a curated resource of SNP-trait associations. Nucleic Acids Res. 2014;42:D1001–6. doi: 10.1093/nar/gkt1229. [DOI] [PMC free article] [PubMed] [Google Scholar]
- 7.Chanock S. Cancer biology: Genome-wide association studies. In: Stewart BW, editor. World Cancer Report 2014. WC: International Agency for Research on Cancer; 2014. pp. 193–202. [Google Scholar]
- 8.Cancer Genome Atlas Research N Comprehensive genomic characterization defines human glioblastoma genes and core pathways. Nature. 2008;455:1061–8. doi: 10.1038/nature07385. [DOI] [PMC free article] [PubMed] [Google Scholar]
- 9.International Cancer Genome C. Hudson TJ, Anderson W, Artez A, Barker AD, Bell C, et al. International network of cancer genome projects. Nature. 2010;464:993–8. doi: 10.1038/nature08987. [DOI] [PMC free article] [PubMed] [Google Scholar]
- 10.Garraway LA, Lander ES. Lessons from the cancer genome. Cell. 2013;153:17–37. doi: 10.1016/j.cell.2013.03.002. [DOI] [PubMed] [Google Scholar]
- 11.Rahman N. Realizing the promise of cancer predisposition genes. Nature. 2014;505:302–8. doi: 10.1038/nature12981. [DOI] [PMC free article] [PubMed] [Google Scholar]
- 12.Cerami E, Gao J, Dogrusoz U, Gross BE, Sumer SO, Aksoy BA, et al. The cBio cancer genomics portal: an open platform for exploring multidimensional cancer genomics data. Cancer Discov. 2012;2:401–4. doi: 10.1158/2159-8290.CD-12-0095. [DOI] [PMC free article] [PubMed] [Google Scholar]
- 13.Gao J, Aksoy BA, Dogrusoz U, Dresdner G, Gross B, Sumer SO, et al. Integrative analysis of complex cancer genomics and clinical profiles using the cBioPortal. Sci Signal. 2013;6:pl1. doi: 10.1126/scisignal.2004088. [DOI] [PMC free article] [PubMed] [Google Scholar]
- 14.Lawrence MS, Stojanov P, Polak P, Kryukov GV, Cibulskis K, Sivachenko A, et al. Mutational heterogeneity in cancer and the search for new cancer-associated genes. Nature. 2013;499:214–8. doi: 10.1038/nature12213. [DOI] [PMC free article] [PubMed] [Google Scholar]
- 15.Fletcher MN, Castro MA, Wang X, de Santiago I, O'Reilly M, Chin SF, et al. Master regulators of FGFR2 signalling and breast cancer risk. Nat Commun. 2013;4:2464. doi: 10.1038/ncomms3464. [DOI] [PMC free article] [PubMed] [Google Scholar]
- 16.Fu YP, Kohaar I, Rothman N, Earl J, Figueroa JD, Ye Y, et al. Common genetic variants in the PSCA gene influence gene expression and bladder cancer risk. Proc Natl Acad Sci U S A. 2012;109:4974–9. doi: 10.1073/pnas.1202189109. [DOI] [PMC free article] [PubMed] [Google Scholar]
- 17.Lewis A, Freeman-Mills L, de la Calle-Mustienes E, Giraldez-Perez RM, Davis H, Jaeger E, et al. A polymorphic enhancer near GREM1 influences bowel cancer risk through differential CDX2 and TCF7L2 binding. Cell Rep. 2014;8:983–90. doi: 10.1016/j.celrep.2014.07.020. [DOI] [PMC free article] [PubMed] [Google Scholar]
- 18.Schodel J, Bardella C, Sciesielski LK, Brown JM, Pugh CW, Buckle V, et al. Common genetic variants at the 11q13.3 renal cancer susceptibility locus influence binding of HIF to an enhancer of cyclin D1 expression. Nat Genet. 2012;44:420–5. doi: 10.1038/ng.2204. [DOI] [PMC free article] [PubMed] [Google Scholar]
- 19.Painter JN, O'Mara TA, Batra J, Cheng T, Lose FA, Dennis J, et al. Fine-mapping of the HNF1B multicancer locus identifies candidate variants that mediate endometrial cancer risk. Hum Mol Genet. 2015;24:1478–92. doi: 10.1093/hmg/ddu552. [DOI] [PMC free article] [PubMed] [Google Scholar]
- 20.Jia J, Bosley AD, Thompson A, Hoskins JW, Cheuk A, Collins I, et al. CLPTM1L promotes growth and enhances aneuploidy in pancreatic cancer cells. Cancer Res. 2014;74:2785–95. doi: 10.1158/0008-5472.CAN-13-3176. [DOI] [PMC free article] [PubMed] [Google Scholar]
- 21.von Figura G, Morris JP, Wright CV, Hebrok M. Nr5a2 maintains acinar cell differentiation and constrains oncogenic Kras-mediated pancreatic neoplastic initiation. Gut. 2014;63:656–64. doi: 10.1136/gutjnl-2012-304287. [DOI] [PMC free article] [PubMed] [Google Scholar]
- 22.Flandez M, Cendrowski J, Canamero M, Salas A, del Pozo N, Schoonjans K, et al. Nr5a2 heterozygosity sensitises to, and cooperates with, inflammation in KRas(G12V)-driven pancreatic tumourigenesis. Gut. 2014;63:647–55. doi: 10.1136/gutjnl-2012-304381. [DOI] [PubMed] [Google Scholar]
- 23.Grisanzio C, Werner L, Takeda D, Awoyemi BC, Pomerantz MM, Yamada H, et al. Genetic and functional analyses implicate the NUDT11, HNF1B, and SLC22A3 genes in prostate cancer pathogenesis. Proc Natl Acad Sci U S A. 2012;109:11252–7. doi: 10.1073/pnas.1200853109. [DOI] [PMC free article] [PubMed] [Google Scholar]
- 24.Darabi H, McCue K, Beesley J, Michailidou K, Nord S, Kar S, et al. Polymorphisms in a putative enhancer at the 10q21.2 breast cancer risk locus regulate NRBF2 expression. Am J Hum Genet. 2015;97:22–34. doi: 10.1016/j.ajhg.2015.05.002. [DOI] [PMC free article] [PubMed] [Google Scholar]
- 25.French JD, Ghoussaini M, Edwards SL, Meyer KB, Michailidou K, Ahmed S, et al. Functional variants at the 11q13 risk locus for breast cancer regulate cyclin D1 expression through long-range enhancers. Am J Hum Genet. 2013;92:489–503. doi: 10.1016/j.ajhg.2013.01.002. [DOI] [PMC free article] [PubMed] [Google Scholar]
- 26.Glubb DM, Maranian MJ, Michailidou K, Pooley KA, Meyer KB, Kar S, et al. Fine-scale mapping of the 5q11.2 breast cancer locus reveals at least three independent risk variants regulating MAP3K1. Am J Hum Genet. 2015;96:5–20. doi: 10.1016/j.ajhg.2014.11.009. [DOI] [PMC free article] [PubMed] [Google Scholar]
- 27.Permuth-Wey J, Kim D, Tsai YY, Lin HY, Chen YA, Barnholtz-Sloan J, et al. LIN28B polymorphisms influence susceptibility to epithelial ovarian cancer. Cancer Res. 2011;71:3896–903. doi: 10.1158/0008-5472.CAN-10-4167. [DOI] [PMC free article] [PubMed] [Google Scholar]
- 28.Permuth-Wey J, Lawrenson K, Shen HC, Velkova A, Tyrer JP, Chen Z, et al. Identification and molecular characterization of a new ovarian cancer susceptibility locus at 17q21.31. Nat Commun. 2013;4:1627. doi: 10.1038/ncomms2613. [DOI] [PMC free article] [PubMed] [Google Scholar]
- 29.Rhie SK, Coetzee SG, Noushmehr H, Yan C, Kim JM, Haiman CA, et al. Comprehensive functional annotation of seventy-one breast cancer risk Loci. PLoS One. 2013;8 doi: 10.1371/journal.pone.0063925. [DOI] [PMC free article] [PubMed] [Google Scholar]
- 30.Yang M, Xie W, Mostaghel E, Nakabayashi M, Werner L, Sun T, et al. SLCO2B1 and SLCO1B3 may determine time to progression for patients receiving androgen deprivation therapy for prostate cancer. J Clin Oncol. 2011;29:2565–73. doi: 10.1200/JCO.2010.31.2405. [DOI] [PMC free article] [PubMed] [Google Scholar]
- 31.Barabasi AL, Gulbahce N, Loscalzo J. Network medicine: a network-based approach to human disease. Nat Rev Genet. 2011;12:56–68. doi: 10.1038/nrg2918. [DOI] [PMC free article] [PubMed] [Google Scholar]
- 32.Ongen H, Andersen CL, Bramsen JB, Oster B, Rasmussen MH, Ferreira PG, et al. Putative cis-regulatory drivers in colorectal cancer. Nature. 2014;512:87–90. doi: 10.1038/nature13602. [DOI] [PubMed] [Google Scholar]
- 33.Python Software Foundation. Python Language Reference. http://www.python.org. Accessed August 21, 2015.
- 34.Machiela MJ, Ho BM. GWAS Genes. GitHub Repository. https://github.com/machiela/gwas_genes. Accessed August 3, 2015.
- 35.International HapMap C, Frazer KA, Ballinger DG, Cox DR, Hinds DA, Stuve LL, et al. A second generation human haplotype map of over 3.1 million SNPs. Nature. 2007;449:851–61. doi: 10.1038/nature06258. [DOI] [PMC free article] [PubMed] [Google Scholar]
- 36.University of California Santa Cruz Genome Browser. refGene database. ftp://ftp-trace.ncbi.nih.gov/1000genomes/ftp/pilot_data/technical/reference/genetic_map_b36.tar.gz. Accessed August 6, 2014.
- 37.Pruitt KD, Tatusova T, Maglott DR. NCBI Reference Sequence (RefSeq): a curated non-redundant sequence database of genomes, transcripts and proteins. Nucleic Acids Res. 2005;33:D501–4. doi: 10.1093/nar/gki025. [DOI] [PMC free article] [PubMed] [Google Scholar]
- 38.University of California Santa Cruz Genome Browser. refGene database. ftp://hgdownload.cse.ucsc.edu/apache/htdocs/goldenPath/hg18/database/refGene.txt.gz. Accessed August 4, 2014.
- 39.Memorial Sloan Kettering Cancer Center. cBioPortal for Cancer Genomics. http://www.cbioportal.org/public-portal/. Accessed June 10, 2015.
- 40.Ahn SM, Jang SJ, Shim JH, Kim D, Hong SM, Sung CO, et al. Genomic portrait of resectable hepatocellular carcinomas: Implications of RB1 and FGF19 aberrations for patient stratification. Hepatology. 2014;60:1972–82. doi: 10.1002/hep.27198. [DOI] [PubMed] [Google Scholar]
- 41.Guo G, Sun X, Chen C, Wu S, Huang P, Li Z, et al. Whole-genome and whole-exome sequencing of bladder cancer identifies frequent alterations in genes involved in sister chromatid cohesion and segregation. Nat Genet. 2013;45:1459–63. doi: 10.1038/ng.2798. [DOI] [PMC free article] [PubMed] [Google Scholar]
- 42.Guo G, Gui Y, Gao S, Tang A, Hu X, Huang Y, et al. Frequent mutations of genes encoding ubiquitin-mediated proteolysis pathway components in clear cell renal cell carcinoma. Nat Genet. 2012;44:17–9. doi: 10.1038/ng.1014. [DOI] [PubMed] [Google Scholar]
- 43.Shah SP, Roth A, Goya R, Oloumi A, Ha G, Zhao Y, et al. The clonal and mutational evolution spectrum of primary triple-negative breast cancers. Nature. 2012;486:395–9. doi: 10.1038/nature10933. [DOI] [PMC free article] [PubMed] [Google Scholar]
- 44.Banerji S, Cibulskis K, Rangel-Escareno C, Brown KK, Carter SL, Frederick AM, et al. Sequence analysis of mutations and translocations across breast cancer subtypes. Nature. 2012;486:405–9. doi: 10.1038/nature11154. [DOI] [PMC free article] [PubMed] [Google Scholar]
- 45.Imielinski M, Berger AH, Hammerman PS, Hernandez B, Pugh TJ, Hodis E, et al. Mapping the hallmarks of lung adenocarcinoma with massively parallel sequencing. Cell. 2012;150:1107–20. doi: 10.1016/j.cell.2012.08.029. [DOI] [PMC free article] [PubMed] [Google Scholar]
- 46.Lohr JG, Stojanov P, Carter SL, Cruz-Gordillo P, Lawrence MS, Auclair D, et al. Widespread genetic heterogeneity in multiple myeloma: implications for targeted therapy. Cancer Cell. 2014;25:91–101. doi: 10.1016/j.ccr.2013.12.015. [DOI] [PMC free article] [PubMed] [Google Scholar]
- 47.Baca SC, Prandi D, Lawrence MS, Mosquera JM, Romanel A, Drier Y, et al. Punctuated evolution of prostate cancer genomes. Cell. 2013;153:666–77. doi: 10.1016/j.cell.2013.03.021. [DOI] [PMC free article] [PubMed] [Google Scholar]
- 48.Barbieri CE, Baca SC, Lawrence MS, Demichelis F, Blattner M, Theurillat JP, et al. Exome sequencing identifies recurrent SPOP, FOXA1 and MED12 mutations in prostate cancer. Nat Genet. 2012;44:685–9. doi: 10.1038/ng.2279. [DOI] [PMC free article] [PubMed] [Google Scholar]
- 49.Hodis E, Watson IR, Kryukov GV, Arold ST, Imielinski M, Theurillat JP, et al. A landscape of driver mutations in melanoma. Cell. 2012;150:251–63. doi: 10.1016/j.cell.2012.06.024. [DOI] [PMC free article] [PubMed] [Google Scholar]
- 50.Peifer M, Fernandez-Cuesta L, Sos ML, George J, Seidel D, Kasper LH, et al. Integrative genome analyses identify key somatic driver mutations of small-cell lung cancer. Nat Genet. 2012;44:1104–10. doi: 10.1038/ng.2396. [DOI] [PMC free article] [PubMed] [Google Scholar]
- 51.Seshagiri S, Stawiski EW, Durinck S, Modrusan Z, Storm EE, Conboy CB, et al. Recurrent R-spondin fusions in colon cancer. Nature. 2012;488:660–4. doi: 10.1038/nature11282. [DOI] [PMC free article] [PubMed] [Google Scholar]
- 52.Rudin CM, Durinck S, Stawiski EW, Poirier JT, Modrusan Z, Shames DS, et al. Comprehensive genomic analysis identifies SOX2 as a frequently amplified gene in small-cell lung cancer. Nat Genet. 2012;44:1111–6. doi: 10.1038/ng.2405. [DOI] [PMC free article] [PubMed] [Google Scholar]
- 53.Iyer G, Al-Ahmadie H, Schultz N, Hanrahan AJ, Ostrovnaya I, Balar AV, et al. Prevalence and co-occurrence of actionable genomic alterations in high-grade bladder cancer. J Clin Oncol. 2013;31:3133–40. doi: 10.1200/JCO.2012.46.5740. [DOI] [PMC free article] [PubMed] [Google Scholar]
- 54.Taylor BS, Schultz N, Hieronymus H, Gopalan A, Xiao Y, Carver BS, et al. Integrative genomic profiling of human prostate cancer. Cancer Cell. 2010;18:11–22. doi: 10.1016/j.ccr.2010.05.026. [DOI] [PMC free article] [PubMed] [Google Scholar]
- 55.Jelinic P, Mueller JJ, Olvera N, Dao F, Scott SN, Shah R, et al. Recurrent SMARCA4 mutations in small cell carcinoma of the ovary. Nat Genet. 2014;46:424–6. doi: 10.1038/ng.2922. [DOI] [PMC free article] [PubMed] [Google Scholar]
- 56.Fujimoto A, Totoki Y, Abe T, Boroevich KA, Hosoda F, Nguyen HH, et al. Whole-genome sequencing of liver cancers identifies etiological influences on mutation patterns and recurrent mutations in chromatin regulators. Nat Genet. 2012;44:760–4. doi: 10.1038/ng.2291. [DOI] [PubMed] [Google Scholar]
- 57.Stephens PJ, Tarpey PS, Davies H, Van Loo P, Greenman C, Wedge DC, et al. The landscape of cancer genes and mutational processes in breast cancer. Nature. 2012;486:400–4. doi: 10.1038/nature11017. [DOI] [PMC free article] [PubMed] [Google Scholar]
- 58.Cancer Genome Atlas Research N Comprehensive molecular characterization of urothelial bladder carcinoma. Nature. 2014;507:315–22. doi: 10.1038/nature12965. [DOI] [PMC free article] [PubMed] [Google Scholar]
- 59.Network CGA. Comprehensive molecular portraits of human breast tumours. Nature. 2012;490:61–70. doi: 10.1038/nature11453. [DOI] [PMC free article] [PubMed] [Google Scholar]
- 60.Network CGA. Comprehensive molecular characterization of human colon and rectal cancer. Nature. 2012;487:330–7. doi: 10.1038/nature11252. [DOI] [PMC free article] [PubMed] [Google Scholar]
- 61.Cancer Genome Atlas Research N Comprehensive molecular characterization of clear cell renal cell carcinoma. Nature. 2013;499:43–9. doi: 10.1038/nature12222. [DOI] [PMC free article] [PubMed] [Google Scholar]
- 62.Davis CF, Ricketts CJ, Wang M, Yang L, Cherniack AD, Shen H, et al. The somatic genomic landscape of chromophobe renal cell carcinoma. Cancer Cell. 2014;26:319–30. doi: 10.1016/j.ccr.2014.07.014. [DOI] [PMC free article] [PubMed] [Google Scholar]
- 63.Cancer Genome Atlas Research N Comprehensive molecular profiling of lung adenocarcinoma. Nature. 2014;511:543–50. doi: 10.1038/nature13385. [DOI] [PMC free article] [PubMed] [Google Scholar]
- 64.Cancer Genome Atlas Research N Comprehensive genomic characterization of squamous cell lung cancers. Nature. 2012;489:519–25. doi: 10.1038/nature11404. [DOI] [PMC free article] [PubMed] [Google Scholar]
- 65.Cancer Genome Atlas Research N Integrated genomic analyses of ovarian carcinoma. Nature. 2011;474:609–15. doi: 10.1038/nature10166. [DOI] [PMC free article] [PubMed] [Google Scholar]
- 66.Cancer Genome Atlas Research N Comprehensive molecular characterization of gastric adenocarcinoma. Nature. 2014;513:202–9. doi: 10.1038/nature13480. [DOI] [PMC free article] [PubMed] [Google Scholar]
- 67.Agrawal N, Akbani R, Aksoy BA, Ally A, Arachchi H, Asa Sylvia L, et al. Integrated genomic characterization of papillary thyroid carcinoma. Cell. 2014;159:676–90. doi: 10.1016/j.cell.2014.09.050. [DOI] [PMC free article] [PubMed] [Google Scholar]
- 68.Cancer Genome Atlas Research N. Kandoth C, Schultz N, Cherniack AD, Akbani R, Liu Y, et al. Integrated genomic characterization of endometrial carcinoma. Nature. 2013;497:67–73. doi: 10.1038/nature12113. [DOI] [PMC free article] [PubMed] [Google Scholar]
- 69.Ding L, Getz G, Wheeler DA, Mardis ER, McLellan MD, Cibulskis K, et al. Somatic mutations affect key pathways in lung adenocarcinoma. Nature. 2008;455:1069–75. doi: 10.1038/nature07423. [DOI] [PMC free article] [PubMed] [Google Scholar]
- 70.Grasso CS, Wu YM, Robinson DR, Cao X, Dhanasekaran SM, Khan AP, et al. The mutational landscape of lethal castration-resistant prostate cancer. Nature. 2012;487:239–43. doi: 10.1038/nature11125. [DOI] [PMC free article] [PubMed] [Google Scholar]
- 71.Krauthammer M, Kong Y, Ha BH, Evans P, Bacchiocchi A, McCusker JP, et al. Exome sequencing identifies recurrent somatic RAC1 mutations in melanoma. Nat Genet. 2012;44:1006–14. doi: 10.1038/ng.2359. [DOI] [PMC free article] [PubMed] [Google Scholar]
- 72.R Core Team . R: A language and environment for statistical computing. Vienna, Austria: R Foundation for Statistical Computing; 2013. [Google Scholar]
Associated Data
This section collects any data citations, data availability statements, or supplementary materials included in this article.
Data Availability Statement
All datasets used to assess tumor mutation frequency are publically available at cBioPortal. Cancer subtype-specific accession codes are as follows: bladder (blca_mskcc_solit_2012, blca_bgi, blca_tcga_pub, blca_tcga); breast (brca_bccrc, brca_broad, brca_sanger, brca_tcga_pub, brca_tcga); cervical (cesc_tcga); colon (coadread_genetech, coadread_tcga_pub, coadread_tcga); endometrial (ucec_tcga, ucec_tcga_pub); esophageal (esca_broad); glioma (glioblastoma: gbm_tcga_pub2013, gbm_tcga_pub, gbm_tcga; glioma: lgg_tcga); kidney (chromophobe: kich_tcga; clear: kirc_bgi, kirc_tcga_pub, kirc_tcga; papillary: kirp_tcga); liver (lihc_amc_prv, lihc_riken); lung (adeno: luad_broad, luad_tcga_pub, luad_tcga, luad_tsp; small: sclc_clcgp, sclc_jhu; squamous: lusc_tcga_pub, lusc_tcga); multiple myeloma (mm_broad); ovarian (serous: ov_tcga_pub, ov_tcga; small: scco_mskcc); pancreatic (paad_icgc, paad_tcga); prostate (prad_broad_2013, prad_broad, prad_mskcc, prad_tcga, prad_mich); skin (skcm_broad, skcm_tcga, skcm_yale); stomach (stad_tcga); and thyroid (thca_tcga).