

Abstract
Colloidal-probe spherical indentation load-relaxation experiments with a probe radius of 3 μm are conducted on poly(ethylene glycol) (PEG) hydrogel materials to quantify their steady-state mechanical properties and time-dependent transport properties via a single experiment. PEG-based hydrogels are shown to be heterogeneous in both morphology and mechanical stiffness at this scale; a linear-harmonic interpolation of hyperelastic Mooney-Rivlin and Boussinesq flat-punch indentation models was used to describe the steady-state response of the hydrogels and determine upper and lower bounds for indentation moduli. Analysis of the transient load-relaxation response during displacement-controlled hold periods provides a means of extracting two time constants τ1 and τ2, where τ1 and τ2 are assigned to the viscoelastic and poroelastic properties, respectively. Large τ2 values at small indentation depths provide evidence of a non-equilibrium state characterized by a phenomenon that restricts poroelastic fluid flow through the material; for larger indentations, the variability in τ2 values decreases and pore sizes estimated from τ2 via indentation approach those measured via macroscopic swelling experiments. The contact probe methodology developed here provides a means of assessing hydrogel heterogeneity, including time-dependent mechanical and transport properties, and has potential implications in hydrogel biomedical and engineering applications.
1. Introduction
Hydrogels constructed from poly(ethylene glycol) (PEG) are attractive materials for a wide variety of bioengineering applications due to their ability to absorb quantities of water or biological fluids on the same order as that of soft tissues and to act as scaffolds and substrates for cell cultures1, 2. When fully hydrated, PEG hydrogels are biocompatible, mimic the mechanical and transport properties of natural tissues, and are ideal candidate materials for tissue engineering,2–4 antigen-specific drug delivery,5 microfluidic seals and actuators,6 wound dressings,7 and other biomedical and engineering uses. PEG-based hydrogels are characterized by three-dimensional cross-linked polymer networks that exhibit time-dependent mechanical properties when subjected to an applied load; conformational changes along the polymer backbone are viscoelastic in nature while migration of the incorporated fluid throughout the porous network is considered to be poroelastic deformation8. As potential bioengineering applications involving PEG hydrogels continue to expand, accurate and reliable measurement of these concurrent dynamic mechanical responses at micrometer and nanometer length scales becomes increasingly important.
Instrumented indentation testing (IIT) has long been used to probe the mechanical behavior of materials at small scales9, 10. IIT provides many benefits over traditional mechanical testing for soft materials, such as tensile or bending experiments, as indentation does not require extensive handling of the sample and provides both mechanical equilibrium and transport properties through a single experiment11. To date, indentation utilizing spherical probes has been used successfully to characterize various soft and elastomeric materials including polydimethylsiloxane, animal cartilage, and other biological tissues12–15.
Often, very large indenters with probe radii on the order of several hundred micrometers to tens of millimeters are used to investigate the visco- and poro-elastic behaviors of hydrogel materials. However, such experiments require very long times to reach poroelastic equilibrium and probe regions of the sample that are large relative to the underlying gel microstructure.12, 16–19. Analyses of the steady-state and transient (i.e., visco- and poro-elastic) mechanical responses are straightforward because indentations are confined to shallow depths and small strains. That is, the ratio of indentation depth, h, to the probe radius, R, is much less than 0.1 and linear-elastic Hertzian theory can be applied20. Conversely, choosing a probe radius in the nanometer range provides rapid fluid migration and improved spatial and force resolution,21 but necessitates the use of complex nonlinear elastic contact models and probes the sample on a scale that is several orders of magnitude smaller than a typical human cell22.
Colloidal-probe atomic force microscopy (AFM) offers a compelling compromise between the two indentation regimes and was consequently chosen for this work. The technique utilizes a spherical colloidal particle with a radius on the order of several micrometers attached to an AFM cantilever, provides good force resolution, and contact areas that are of relevance to whole cell-hydrogel interactions. In addition, the probe can be subjected to a hold period during an imposed indentation experiment to elucidate transient viscoelastic and poroelastic responses occurring simultaneously within the hydrogel network. As the probe radius is small, poroelastic relaxation is relatively fast (frequently occurring in one minute or less) with respect to larger scale experiments.
Unfortunately, spherical probes of this size are still likely to surpass the small strain limit (h/R < 0.1) necessary for Hertzian linear elasticity to apply, therefore a load-displacement model that accurately describes departures from Hertzian mechanics at finite strain is required. In this work, such a model will be developed and used to analyze the steady-state, equilibrium (or non-equilibrium) mechanical response of PEG-based hydrogels at various polymer weight fractions. Furthermore, load-relaxation data taken during a displacement-controlled hold period is fit to a two-exponential relaxation model to identify concurrent viscoelastic and poroelastic properties and their related time constants; from this information, approximate pore size and permeability parameters can be determined. In all, a complete understanding of both the steady-state and transient mechanical properties of PEG-based hydrogels at the micrometer and nanometer length scale will aid in the design and use of these materials in biomedical and engineering applications.
2. Materials and methods†
2.1 Preparation of PEG hydrogels and material characterization
PEG hydrogel materials were synthesized from poly(ethylene glycol) dimethacrylate (PEGDMA) monomer, molecular mass, MN = 400 g/mol, purchased from Polysciences, Inc., (Warrington, PA). Ammonium persulfate (APS), N,N,N′,N′-tetramethylethylene-diamine (TEMED), and 3-aminopropyltriethoxysilane (APTES) were purchased from Sigma-Aldrich (St. Louis, MO). PEGDMA cross-links through free-radical polymerization of the methacrylate groups with APS acting as the initiator and TEMED as the accelerator.
PEGDMA was dissolved in deionized water (dH2O) in weight concentrations of (10, 15, and 20) wt %. 15 μL of APS (10 wt % in dH2O) and 7.5 μL of TEMED were added simultaneously to 500 μL of the precursor solution, vortexed for 10 s to ensure thorough mixing, poured directly into 15 mm cylindrical molds on functionalized glass coverslips, and left overnight. Glass coverslips were functionalized by APTES using a protocol modified from elsewhere23 with isopropanol as the solvent; APTES functionalization (silanization) aids in gel adhesion to the coverslip. The gels were placed in dH2O at room temperature for at least 24 hr prior to testing in order to reach swelling equilibrium and to allow for the removal of unreacted monomer. It should be noted that the PEGDMA weight concentrations used were substantial and that on mixing the precursor solutions became cloudy. The cloudiness increased as cross-linking proceeded such that the resultant gels were opaque. This loss in clarity was interpreted as evidence that the hydrogels had undergone both solution induced phase separation24, 25 on initial mixing and polymerization induced phase separation during crosslinking19, 26, 27; the gels were thus expected to exhibit heterogeneous mechanical and transport properties.
Three gels of each weight fraction (nine total gels) were prepared as described for spherical indentation testing. In addition, gels were prepared for various material characterization methods described below including attenuated total reflection-Fourier transform infrared spectroscopy (ATR-FTIR) to determine cross-link conversion, gel fraction measurements to determine the extent of cross-linking, and swelling ratio measurements to determine approximate pore size within the gel.
Cross-link conversion of the PEGDMA was analyzed using a Perkin Elmer Spectrum 100FTIR infra-red spectrometer (Waltham, MA). ATR-FTIR spectra of pure PEGDMA polymer, fully hydrated gels, and dehydrated gels were taken and averaged over a minimum of 16 readings from (4000 to 525) cm−1 with a resolution of 4 cm−1. The prepared hydrogels exhibited absorption bands characteristic of DMA, along with bands characteristic of PEG, prior to exposure to water and the addition of cross-linking agents. On cross-linking, the DMA C=C bands were extinguished and the C=O band was shifted to greater wavenumbers, and the PEG bands were unaltered as observed in similar hydrogel materials27–30. Subsequent hydration of the cross-linked gel to reach equilibrium swelling in water, followed by dehydration, and then rehydration, did not alter the absorption bands associated with either PEG or DMA.
Gel fraction measurements were used to determine the extent of cross-linking with a method modified from elsewhere31. Briefly, gels of nearly identical mass, (0.125 ± 0.003) g, were selected from hydrogel sheets prior to hydration (unless stated otherwise, all uncertainties are one standard deviation from the mean of the measured value). One set was dried in a vacuum desiccator, while the other set was rinsed in dH2O to remove any unreacted monomer before being dried in the vacuum desiccator. The dried mass ratio of the rinsed versus non-rinsed hydrogel provides a measure of the extent of cross-linking within the gel system; experimentally determined gel fractions for the three polymer weight concentrations used here are included in Table 1 and show a large degree of cross-linking and monomer conversion, with all gel fractions greater than 93 %.
Table 1.
PEG hydrogel material properties for gels of varying weight concentration including the gel fraction, mass swelling ratio (QM), pore size (ξ) calculated from QM, lower and upper bounds of the indentation modulus (Mlower and Mupper), pore size (ξ) calculated from the median time constant (τ2) at large indentation depths, pore size (ξ) calculated from the maximum time constant (τ2) at large indentation depths.
| Weight conc. | 10 wt% | 15 wt% | 20 wt% |
|---|---|---|---|
| Gel fraction | 93 ± 0.3 % | 94.3 ± 0.8 % | 94.4 ± 5.1 % |
| QM | 10.33 ± 0.83 | 6.56 ± 0.02 | 5.09 ± 0.07 |
| ξ (nm); from QM | 1.96 ± 0.11 | 1.65 ± 0.01 | 1.48 ± 0.02 |
| Mlower (kPa) | 0.11 | 0.33 | 1.11 |
| Mupper (kPa) | 3.33 | 11.1 | 22.2 |
| ξ (nm); from τ2 large depth median | 0.73 | 0.23 | 0.01 |
| ξ (nm); from τ2 large depth maximum | 0.94 | 0.65 | 0.50 |
Lastly, to determine the gel swelling ratio, 2 g batches of the PEGDMA precursor solutions described above were prepared, poured into 50 mm petri dishes, and allowed to cross-link for 24 hr. Three gel segments were cut from the bulk using a 10 mm diameter cork borer and weighed at various time intervals after incubation in dH2O with the initial mass of the gel after cross-linking, prior to swelling, taken as the initial state; excess water was removed from the surface prior to weighing with a laboratory wipe. After the swelling period, gels were dehydrated in a vacuum desiccator and the mass recorded after stabilization. The mass swelling ratio, QM, is defined as
| (1) |
where MD is the dry (unswollen) polymer mass and MS is the hydrogel mass at equilibrium swelling (determined by making multiple measurements over hours to days until no further changes were observed). The measured values for QM are given in Table 1.
The mass swelling ratio was converted to volume swelling ratio, QV, via
| (2) |
where ρP = 1.12 g/cm3 for PEG and the solvent density ρS = 1 g/cm3 for water. The molecular weight between crosslinks, MC, was computed via32
| (3) |
where MN = 400 g/mol is the number average molecular weight of the uncrosslinked polymer, V1 = 18 cm3/mol is the molar volume of the solvent, ν2 = 1/QV, and χ1 = 0.426 is the polymer-solvent interaction parameter (similar parameters were used elsewhere32).
Pore (mesh) size, ξ, was estimated from the swelling ratio QV using a modified Flory-Rehner analytical model assuming isotropic swelling18, 33
| (4) |
where l is the length of the carbon-carbon bond (0.146 nm), Cn is the Flory characteristic ratio, typically around 3.8 to 4.0 for PEG18, 32 and here taken as 4.0. Nb is the number of C-C bonds between closest crosslinking points as given by 2MC/MR, where MR is the molecular weight of the repeat unit (44 g/mol for PEG).18 The calculated values for ξ are included in Table 1 and are consistent with those reported previously for similarly prepared hydrogels18, 32.
2.2 Colloidal-probe AFM experimental protocol
Spherical indentation load-relaxation experiments were conducted using an Asylum Research MFP-3D (Santa Barbara, CA) AFM in a fluid cell environment to maintain equilibrium swelling of the gels. Gold colloid tipped cantilever probes (SQube, Bickenbach, Germany) with a nominal spherical radius of (3.0 ± 0.3) μm were used for indentation. Cantilever spring constants were calibrated using the thermal fluctuation method34 and confirmed via laser Doppler vibrometry35, 36; spring constants were measured to be (1.97 ± 0.27) N/m.
The experimental protocol (shown in Fig. 1) was as follows. First, the colloidal probe was brought into contact with the gel and indented to a maximum applied load ranging from 20 nN to 500 nN. Indentation displacement rates varied from approximately 500 nm/s to 12.5 μm/s depending on maximum load and were chosen such that the loading segments had comparable rise times. On reaching maximum load, P0, the probe was subjected to a 20 s displacement-controlled hold period, while load relaxation to a reduced, long-time load, P∞, occurred. After the hold period, the probe was retracted from the surface at a rate equal to the loading velocity. A minimum of 10 load-relaxation experimental cycles in the same location were conducted for each applied load with a minimum of 20 s between cycles. Sets of cycles were repeated at multiple locations on all of the hydrogels tested; a total of 1,336 indentation curves were analyzed.
Fig. 1.

Representative (a) load vs. time (P-t) data and (b) indentation depth vs. time (h-t) data for a 100 nN indentation load. Initially, P and h are increased to P0 and hmax, respectively (region 1). On reaching the maximum load, P0, indentation depth is maintained for a 20 s hold period while P relaxes to P∞ (region 2). After the hold period, the AFM probe is retracted from the surface (region 3).
2.3 Steady-state mechanical model
The primary goal of the analysis presented here is to generate a load-displacement relation for the near-equilibrium state of AFM-indented hydrogels at the end of the displacement controlled hold period. The overall load response is initially increasing from zero to a maximum load, followed by intermediate load relaxation at fixed displacement to a reduced, long-time load, and finally by load decrease to zero. The load-displacement relation for the near-equilibrium state is described by two overlapping asymptotic responses.
Two asymptotic load responses in the overall load-displacement response are evident: Initially, the indentation depth, h, and contact radius, a, are small relative to the probe radius, R, and, if time-dependent effects are absent, the load-displacement relation is that for Hertzian contact37:
| (5) |
where PH is the load supported by the Hertzian contact. M is the indentation modulus, which for elastically isotropic materials is given by37
| (6) |
where G and ν are the (equilibrium) shear modulus and Poisson’s ratio of the material, respectively; the term in parentheses is a conventional expression for M when the Young’s modulus E is the elastic property of relevance (for engineering materials, in which extensional deformation is important). This response is not relevant to the long-time near-equilibrium state here, but is a good description (or starting point) for indentation experiments on similar gels for which the indentation displacements were small (and time-dependence was taken into account16).
At the other extreme of very large indentation depths, the indentation depth is large relative to the probe radius, but both are small relative to the size of the sample, and, again in the absence of time-dependent effects, the load-displacement relation is that for Boussinesq contact37:
| (7) |
where PB is the load supported by the Boussinesq contact and the displacement in the Boussinesq field is specified at the indenter radius.
At intermediate indentation depths, two departures from the Hertzian response occur. The first is that the infinitesimal (small strain) elastic response of the material is exceeded and a large deformation (“finite” strain) constitutive equation for the elastic response is required. Such constitutive equations are usually expressed not in terms of single elastic constants such as G, ν, and E, but in terms of invariants of the strain tensor, I1 and I2: when the constitutive equation is linear in only the first of these, the material is referred to as neo-Hookean, when linear in both, as Mooney-Rivlin. The second is that infinitesimal contact by the indenter is exceeded and the parabolic approximation relating indentation depth and contact radius no longer pertains and a displacement-radius relation describing the spherical nature of the probe is required.
To address the first of these issues, a finite deformation, Mooney-Rivlin, indentation response is used38:
| (8) |
where PMR is the load supported by the Mooney-Rivlin contact, and b1 and b2 are constants such that b1 + b2 = 1. b2 = 0 gives the neo-Hookean response. Other choices of constitutive equations differ in detail, but the indentation response is much the same as that given by the above – convex in logarithmic coordinates20, 39–41. The parameter e is an indentation-strain-like quantity:
| (9) |
and the above equation for PMR approaches the Hertzian response to first order in e (as do all choices of constitutive laws). To address the second issue, the contact penetration is written as20
| (10) |
for values of e≤1 and where the first term is the Hertzian response and the second term allows for finite (as opposed to infinitesimal) contact radii. The equations for PMR and h/R have been simplified from the original works by the introduction of e, and these equations form a parametric set for PMR(h/R) using e.
The large and intermediate indentation depth responses are relevant to the near-equilibrium load-relaxation state and the full response – Mooney-Rivlin for intermediate h/R and e and Boussinesq for large h/R – can be estimated by interpolating between the two responses. A linear harmonic interpolation favors the smaller load at a given displacement:
| (11) |
and the full response is thus given by P(h/R). Figure 2 shows the responses for R = 3 μm, M = 10 kPa, and b1 = 0.7; the hatched region is the approximate bounds of the long-time indentation response utilized in the experiments. Note that all expressions for indentation load are proportional to the characteristic load R2M, taking into account indenter and material properties, and this serves as a convenient scaling load.
Fig. 2.

A linear harmonic interpolation of the Mooney-Rivlin and Boussinesq load-indentation depth response for intermediate to large h/R values. The hatched region is the approximate bounds of the long- time indentation response utilized in the experiments.
2.4 Transient mechanical model
Load-time (P-t) data were captured throughout the approach, hold, and retraction portions of the colloidal-probe AFM indentation cycle and analyzed using a custom-built Matlab script. For displacement controlled indentation, a material relaxation function for the shear modulus, G, of the form14
| (12) |
is assumed, while the load-relaxation solution has the form
| (13) |
Experimental P(t) data were fit to this function throughout the hold segment of the indentation cycle with an incorporated “ramp correction factor” (to account for non-instantaneous loading) to extract the fitting parameters, Bk, and relevant time constants, τk. Material parameters, Ck, can in principle be expressed in terms of the fit parameters via the ramp correction factor and other experimental conditions such as the rise time, tR, the maximum displacement during the hold portion, hmax, and the indenter radius, R14. The time constants, τ1 and τ2, provide information on the concurrent dynamics of the load-relaxation process; τ1 is attributed to short-time viscoelastic relaxation within the polymer network while τ2 relates to slower, poroelastic transport of water molecules out of the contact region18.
3. Results and discussion
3.1 Steady-state mechanical response
Figure 3 shows representative load-relaxation data at all applied loads for a 15 wt % PEG hydrogel along with the best-fit curves from eqn (13). Corresponding normalized indentation depths, h/R, are included for each curve with values ranging from 1.65 to 5.45. As the indentation depths were large relative to the probe radius, with h/R values much greater than 0.1, it was expected that departures from Hertzian equilibrium mechanics occurred and that the interpolation of the hyperelastic Mooney-Rivlin and Boussinesq response as described above was applicable.
Fig. 3.
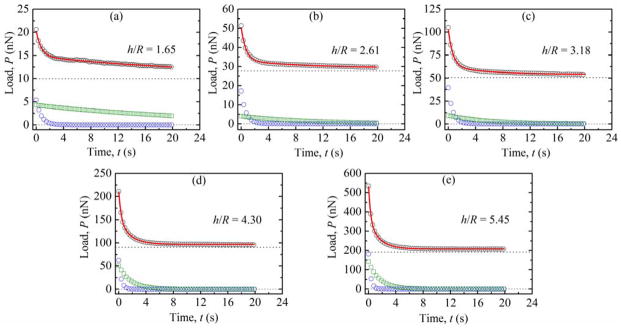
Representative load-relaxation (P-t) data for (a) 20 nN, (b) 50 nN, (c) 100nN, (d) 200 nN, and (e) 500 nN maximum applied loads, along with the h/R values, during the 20 s hold portion. The horizontal dotted line represents the fitted equilibrium load, B0, while the blue circles and green squares represent viscoelastic (B1) and poroelastic (B2) contributions to the load-relaxation, respectively. The full fitted transient mechanical response is shown as a solid red line.
In order to verify this interpretation, logarithmic plots of the long-time equilibrium load versus indentation depth were constructed and the slope analyzed to identify relevant power law scaling of the form P∞ ~ hm 9. The long-time equilibrium load is equivalent to the B0 fitting parameter in eqn (13). For a Hertzian response, power-law scaling of m = 1.5 would be observed. Experimental load-relaxation data taken here exhibited scaling of m = 1.89 ± 0.33 for all three hydrogel weight fractions; the long-time equilibrium response at these h/R values was decidedly non-Hertzian and eqn (11) was expected to hold. Over the complete range of observed m values, 1.44 to 2.41, there was no correlation with hydrogel weight fraction, suggesting that sample-to-sample and inter-sample heterogeneity is prevalent within the gels.
The existence of such heterogeneity within the gels made it difficult to define a single indentation modulus, M, for gels of each weight fraction. The fitting parameters, Bk, identified by eqn (13) can be converted to material parameters, Ck, as described elsewhere,14 however this requires the assumption that the load-relaxation is primarily viscoelastic in nature. For gels with concurrent viscoelastic and poroelastic dynamics, convenient conversion to material properties is not well defined as the overall load-relaxation behavior is the product of the viscoelastic and poroelastic responses17. Because of this, logarithmic contour plots for varying characteristic loads, R2M, were generated using eqn (11) and b1 = 0.7, and the experimental data overlaid in order to provide bounds on the indention modulus (Fig. 4). The experimental load-relaxation responses fall within a wide range of characteristic loads, confirming the gels are heterogeneous, but follow the expected trend of greater indentation moduli for gels of increasing weight fraction. Division by the square of the average tip radius (3 μm) used for the indentation experiments results in indentation moduli from (0.11 to 22.2) kPa for gels of (10 to 20) wt%; the moduli values are indicated in Table 1. The range of moduli values are in good agreement with results identified by others for similarly fabricated PEG hydrogels18, 32.
Fig. 4.

Equilibrium (long-time) load-indentation depth data for 10 wt %, 15 wt %, and 20 wt % PEG hydrogels with contours at characteristic R2M loads. Note: (3 μm)2 × 10 kPa = 90 nN.
3.2 Transient mechanical response
In addition to providing a measure of the equilibrium mechanical properties, spherical indentation is a valuable tool in probing the viscoelastic and poroelastic dynamics of PEG hydrogels. Viscoelastic relaxation is independent of indentation depth and occurs rapidly within the polymer network whereas poroelastic relaxation has been shown to occur much more slowly18. The choice of a load-relaxation function of the form given in eqn (13) provides the two time constants associated with each mode of relaxation. Figure 5 consists of histograms of the τ1 and τ2 values obtained by fitting eqn (13) to P-t data during the hold portion of the indentation cycle. The distribution of τ1 values is unimodal, with a center at 0.20 s that is on the order of expected time constants for purely viscoelastic relaxation18. The value of τ1 is also found to be independent of the applied load, 20 nN to 500 nN, as would be expected for the viscoelastic response.
Fig. 5.

Histograms for (a) τ1 and (b) τ2 time constants obtained by fitting load-relaxation data to eqn (13). τ1 is unimodal and indicative of viscoelastic relaxation whereas τ2 is bimodal and indicative of a poroelastic response; the inset shows large fitted values of τ2.
The distribution of τ2 time constants associated with poroelastic relaxation is far more interesting; the distribution is predominantly bimodal with peaks around 1.4 s and 7.0 s, and a large number of instances for which τ2 was greater than the 20 s hold period. Approximately 25% of the fitted load-relaxation responses exhibited such τ2 values with many being greater than 100 s (Fig. 5(b), inset). When P-t indentation data are fit to eqn (13), the existence of a non-equilibrium state corresponds directly with large τ2 values and a B0 term approaching 0 nN. That is, at small loads the poroelastic response was slow and did not always reach equilibrium within the 20 s hold period. The large τ2 values were not randomly distributed throughout the data, but varied systematically with indentation depth (mechanically strained volume). This is most clearly illustrated in the 10 wt % PEG data for which 34% of data points at the smallest load (20 nN) had a τ2 greater than 100 s and none of the largest load (500 nN) data points did. For all three gel systems there was substantially more variability in τ2 at small loads than at large loads.
It was hypothesized that the non-equilibrium state is a result of fluid flow encountering very small pores within the deformation field and becoming restricted or unable to flow within the timeframe of the experimental measurement. This hypothesis is supported by the fact that at very large loads (e.g., 500 nN) the non-equilibrium state is less frequently encountered as the load is sufficient to either force fluid flow through the very small pores due to a larger pressure gradient (i.e., Darcy’s law), or results in the fluid finding an alternative pathway through the material. At small loads however, the fluid remains constricted and poroelastic flow to an equilibrium state does not occur. Had the displacement controlled hold period been allowed to continue beyond 20 s, it is likely that even at small loads an equilibrium state may have been achieved.
In order to support the idea that the non-equilibrium state is a result of a restriction phenomenon, it was necessary to determine the approximate pore size of the gels. Pore size within the gel has already been determined through other means, namely by measuring the volume swelling ratio, QV, and using the Flory-Rehner analytical model as in eqn (4) and given in Table 1; however the experimentally determined time constant, τ2, provides a separate means by which to calculate average pore size for the purpose of comparison. The poroelastic time constant, τ2, is given by L2/M(k/η)42 where L is the characteristic length scale, M is the indentation modulus, k is the intrinsic permeability, and η is the viscosity of water, taken here as 1 mPa s. The characteristic length scale chosen for these experiments was the indentation depth, h, corresponding to the Boussinesq contact limit and the constant effective contact radius at indentation depths greater than the contact size. The pore size can then be independently estimated as the square root of the intrinsic permeability (ξ = k1/2). Rearranging and combining gives:
| (14) |
similar to the expression found in Lin et al43. The calculation was performed using both the mean values of M from the bounds given in Table 1.
Figure 6 is a plot of pore size inferred from the long relaxation time measurements as a function of indentation depth for the 10 wt % material. At small indentation loads, giving rise to small indentation depths, the pore sizes are small and variable. As the indentation load and depth increases the pore sizes increase and become less variable, until, at the very largest indentation loads and depths (h > 10 μm), the pore size values converge to large values with a narrow range. The dashed lines provide a visual guide bounding this convergence. The solid horizontal band in Fig. 6 indicates the range of pore sizes inferred from the bulk swelling ratio measurements. Calculated pore sizes falling below the lower bound, with values substantially less than 1 nm, tend to be at small loads and correspondingly small indentation depths. Pores of this scale are not physically realistic and correspond with the emergence of the non-equilibrium state and large τ2 values, suggesting that the fluid is constricted and poroelastic flow cannot occur within the time frame of the experiment.
Fig. 6.

Average pore size, ξ, calculated from τ2 values as a function of indentation depth, h, for a 10 wt% PEG hydrogel; the dashed lines are a visual guide and indicate that variability in pore sizes converge to a narrow range at large contacts (h > 10 μm) and approach the pore sizes inferred from the bulk swelling ratio measurements (shown as the red horizontal band).
It is clear from Figures 4, 5, and 6 that the colloidal probe indentation tests probed heterogeneity in the mechanical response of the materials. Heterogeneity in the structure of hydrogels has been observed using light scattering, small-angle X-ray scattering, and small-angle neutron scattering. These scattering measurements indicate that there are regions of greater and lesser cross-linking density within the gels. The characteristic length-scales associated with the observed structural heterogeneity are between 4 nm and 250 nm44–50, although most commonly in the 20-nm range47–50. It is unlikely that such cross-linking heterogeneity was observed in the experiments here as the contact radii and indentation depths were on the order of several micrometers. Phase separation in hydrogels gives rise to heterogeneity at length scales much greater than those observed in the scattering experiments. The cloudy appearance of the gel solutions and cross-linked gels indicates light scattering by interfaces between polymer-rich and polymer-poor regions much greater in size than the wavelength of visible light19, 25–27. It seems likely then that the mechanical heterogeneity observed here is linked to the structural heterogeneity associated with the phase-separated structure.
Given the cloudy nature of the resultant materials, the microstructure probably consists of isolated polymer-rich regions, micrometers in scale, separated by a near-continuous hydrogel phase. The polymer rich regions are dense, with pore sizes nanometer in scale or smaller. The hydrogel phase is less dense and heterogeneous, with density varying over several tens of nanometers with pore sizes several nanometers in scale. At very small indentation loads, especially for the large polymer weight-fraction materials, the indentation depths are small. Under these conditions, the probability is large that the indentation deformation field contains a majority of dense, polymer-rich phase, with significantly restricted poroelastic flow. As a consequence, the time constants for relaxation are large and variable and the inferred pore sizes small and variable.
At larger indentation loads, the indentation depths are larger and the probability is large that the indentation deformation field contains sufficient hydrogel phase to allow poroelastic flow through the less dense hydrogel pore network. At the largest indentation loads in the smallest polymer weight fraction materials, the indentation deformation field nearly always contains a region representative of the largest pore-size, least dense hydrogel phase within the material and the relaxation time constants are short and relatively invariant. In this latter case, the pore sizes inferred from the time constants will approach those inferred from bulk behavior, such as those from swelling ratio measurements. The 10 wt % material studied here demonstrated this complete range of behavior, Fig. 6. The 15 wt % material exhibited less convergence to an invariant large pore size value at large indentation depth. The 20 wt % material, which was the stiffest material, Fig. 4, exhibited the smallest indentation depths and did not yet converge to a large pore size value at the largest indentation depths. This is illustrated by comparison of the median and maximum calculated pore size, ξ, for indentations with 80 % to 100 % of the maximum indentation depth for each polymer concentration. Consistent with the swelling experiments, this value decreases with increasing polymer weight concentration (Table 1). However, the values of pore size from τ2 are smaller than the pore sizes computed from the swelling experiments and the divergence between maximum and median is greater with increasing polymer concentration.
This length-scale effect can be examined further by considering the volume of strained material in indentation experiments compared with bulk swelling. For bulk swelling, the strains are uniform and the strained volume is the sample volume, of order mm3. For indentation experiments at peak displacement of order 10 μm, the strained volume is of the order of (10 μm)3 or 1 × 10⁻⁶ mm3. The trend in larger effective pore sizes with indentation depth (Figure 6) is thus consistent with larger pore sizes in a larger volume of material “sampled” in the bulk swelling measurements; for poroelastic flow, fluid will travel most easily in the largest available pores within the strained volume.
4. Conclusions
This study has shown that spherical indentation testing with micrometer sized colloidal probes provides a viable means for determining the mechanical properties of phase-separated PEG-based hydrogels. Steady-state mechanical analysis confirms that the gels behave as hyperelastic materials at large strains with load-displacement power law scaling well beyond that of Hertzian mechanics (m = 1.89 ± 0.33). The response can be adequately described by a linear harmonic interpolation of the Mooney-Rivlin and Boussinesq flat-punch response models. Heterogeneity within the gel framework on the order of the colloidal probe radius, due to both solution and polymerization induced phase-separation, makes quantifying a single indentation modulus difficult. It is therefore more appropriate to discuss the mechanical properties of PEG hydrogel materials in terms of characteristic loads, R2M, or as upper and lower bounds on stiffness. For the hydrogels studied here, which were shown to be of large gel fraction (> 90 %) and have a large degree of cross-linking and monomer conversion, measured modulus values fall within the expected kilopascal range.
Colloidal-probe spherical indentation testing also provides a convenient means to study simultaneous visco- and poro-elastic transient mechanical properties The load-relaxation response during a displacement-controlled hold period can be fit to a double exponential model as given in eqn (13); the two time constants, τ1 and τ2, were assigned to the viscoelastic and poroelastic properties, respectively. Analysis of the time constant distributions shows that τ1 is unimodal and invariant with load, as would be expected for purely viscoelastic relaxation. Pore size calculations from the τ2 time constants approach those of more well established polymer characterization techniques, namely mass or volume swelling ratio determination, only at large indentation depths in small polymer weight fraction materials. At small depths, the τ2 time constants are variable and can be extremely large, suggesting a constriction phenomenon that impedes poroelastic flow within the experimental hold period. Likely phase separation of the materials suggests that the behavior at large indentation depths is associated with poroelastic flow through a porous hydrogel phase and the behavior at small indentation depths can be associated with constricted flow through a locally dense, polymer-rich phase.
Finally, it is important to note that the contact probe methodology developed here is a complementary method to scattering techniques for assessing hydrogel heterogeneity. When performed in sufficient numbers, indentation measurements provide a direct measure of the spread in mechanical properties of a gel, whereas scattering measurements provide a measure of structure. Significantly, measurements of time-dependent mechanical properties can be made, including the time constants for viscoelastic and poroelastic deformation. Such time constants may be more important than static mechanical properties, such as elastic modulus, in determining the performance of hydrogel components. In particular, spatial heterogeneity of the time constant associated with poroelastic deformation is an indication of heterogeneity of molecular flow, with potential implications in hydrogel biomedical and engineering applications.
Supplementary Material
Acknowledgments
The authors would like to acknowledge funding from the National Institutes of Health – University of Cambridge Scholars Programme and the laboratory of Dr. Constantine Stratakis at the National Institute of Child Health and Human Development at NIH. In addition, the authors thank Dr. Daniel Strange for help with Matlab analysis, and Dr. Richard Gates for performing the laser Doppler vibrometry measurements.
Footnotes
Specific equipment, instruments, and materials identified in the paper are listed in order to adequately describe the experimental procedure. Such identification does not imply recommendation by NIST, nor does it imply the equipment and materials are the best available for the purpose.
Notes and references
- 1.Drury J, Mooney D. Biomaterials. 2003;24:4337–4351. doi: 10.1016/s0142-9612(03)00340-5. [DOI] [PubMed] [Google Scholar]
- 2.Shapiro J, Oyen M. JOM: Journal of The Minerals, Metals, & Materials Society (TMS) 2013;65:505–516. [Google Scholar]
- 3.Khademhosseini A, Langer R. Biomaterials. 2007;28:5087–5092. doi: 10.1016/j.biomaterials.2007.07.021. [DOI] [PubMed] [Google Scholar]
- 4.Rowley JA, Madlambayan G, Mooney D. Biomaterials. 1999;20:45–53. doi: 10.1016/s0142-9612(98)00107-0. [DOI] [PubMed] [Google Scholar]
- 5.Miyata T, Asami N, Uragami T. Letters to Nature. 1999;399:766–768. doi: 10.1038/21619. [DOI] [PubMed] [Google Scholar]
- 6.Calvert P. Advanced Materials. 2009;21:743–756. [Google Scholar]
- 7.Kopecek J, Yang J. Polymer International. 2007;56:1078–1098. [Google Scholar]
- 8.Hu Y, Suo Z. Acta Mechanica Solida Sinica. 2012;25:441–458. [Google Scholar]
- 9.Oliver WC, Pharr GM. Journal of Materials Research. 1992;7:1564–1583. [Google Scholar]
- 10.Oliver WC, Pharr GM. Journal of Materials Research. 2004;19:3–20. [Google Scholar]
- 11.Hu Y, You JO, Auguste DT, Suo Z, Vlassak J. Journal of Materials Research. 2012;27:152–160. [Google Scholar]
- 12.Hu Y, Chen X, Whitesides GM, Vlassak J, Suo Z. Journal of Materials Research. 2011;26:785–795. [Google Scholar]
- 13.Li C, Pruitt LA, King KB. Journal of Biomedical Materials Research Part A. 2006;78A:729–738. doi: 10.1002/jbm.a.30751. [DOI] [PubMed] [Google Scholar]
- 14.Mattice J, Lau A, Oyen M, Kent R. Journal of Materials Research. 2006;21:2003–2010. [Google Scholar]
- 15.Oyen M. Handbook of Nanoindentation with Biological Applications. Pan Stanford Publishing; Singapore: 2010. [Google Scholar]
- 16.Kalcioglu ZI, Mahmoodian R, Hu Y, Suo Z, Van Vliet KJ. Soft Matter. 2012;8:3393–3398. [Google Scholar]
- 17.Strange D, Fletcher T, Tonsomboon K, Brawn H, Zhao X, Oyen M. Applied Physics Letters. 2013;102:031913. [Google Scholar]
- 18.Chan E, Hu Y, Johnson P, Suo Z, Stafford C. Soft Matter. 2012;8:1492. [Google Scholar]
- 19.Kang G, Cao Y, Zhao H, Yuan Q. Journal of Membrane Science. 2008;318:227–232. [Google Scholar]
- 20.Liu DX, Zhang ZD, Sun LZ. Journal of Materials Research. 2010;25:2197–2202. [Google Scholar]
- 21.Drira Z, Yadavalli V. Journal of the Mechanical Behavior of Biomedical Materials. 2013;18:20–28. doi: 10.1016/j.jmbbm.2012.09.015. [DOI] [PubMed] [Google Scholar]
- 22.Goodsell DS. The Machinery of Life. Springer-Verlag New York, Inc; New York: 1998. [Google Scholar]
- 23.Thermo Scientific. 3-Aminopropyltriethoxysilane Instructions. https://tools.lifetechnologies.com/content/sfs/manuals/MAN0011406_3Aminopropyltriethoxysilane_UG.pdf.
- 24.van de Witte P, Dijkstra PJ, van den Berg JWA, Feijen J. Journal of Membrane Science. 1996;117:1–31. [Google Scholar]
- 25.Bailey BM, Hui V, Fei R, Grunlan MA. Journal of Materials Chemistry. 2011;21:18776. doi: 10.1039/C1JM13943F. [DOI] [PMC free article] [PubMed] [Google Scholar]
- 26.Ju H, McCloskey BD, Sagle AC, Kusuma VA, Freeman BD. Journal of Membrane Science. 2009;330:180–188. [Google Scholar]
- 27.Killion JA, Geever LM, Devine DM, Kennedy JE, Higginbotham CL. Journal of the Mechanical Behavior of Biomedical Materials. 2011;4:1219–1227. doi: 10.1016/j.jmbbm.2011.04.004. [DOI] [PubMed] [Google Scholar]
- 28.Suh KY, Seong J, Khademhosseini A, Laibinis PE, Langer R. Biomaterials. 2004;25:557–563. doi: 10.1016/s0142-9612(03)00543-x. [DOI] [PubMed] [Google Scholar]
- 29.Wu YH, Park HB, Kai T, Freeman BD, Kalika DS. Journal of Membrane Science. 2010;347:197–208. [Google Scholar]
- 30.Backstrom S, Benavente J, Berg RW, Stibius K, Larsen MS, Bohr H, Helix-Nielsen C. Materials Sciences and Applications. 2012;3:425–431. [Google Scholar]
- 31.Kokabi M, Sirousazar M, Hassan ZM. European Polymer Journal. 2007;43:773–781. [Google Scholar]
- 32.Zustiak SP, Leach JB. Biomacromolecules. 2010;11:1348–1357. doi: 10.1021/bm100137q. [DOI] [PMC free article] [PubMed] [Google Scholar]
- 33.Oyen M. International Material Reviews. 2014;59:44–59. [Google Scholar]
- 34.Butt HJ, Jaschke M. Nanotechnology. 1995;6:1–7. [Google Scholar]
- 35.Gates R, Pratt J. Nanotechnology. 2012;23:12. doi: 10.1088/0957-4484/23/37/375702. [DOI] [PubMed] [Google Scholar]
- 36.Gates R, Osborn W, Pratt J. Nanotechnology. 2013;24:9. doi: 10.1088/0957-4484/24/25/255706. [DOI] [PubMed] [Google Scholar]
- 37.Johnson KL. Contact Mechanics. Cambridge University Press; Cambridge, UK: 1987. p. 55.p. 93. [Google Scholar]
- 38.Lin D, Dimitriadis E, Horkay F. eXPRESS Polymer Letters. 2007;1:576–584. [Google Scholar]
- 39.Lin D, Schreiber D, Dimitriadis E, Horkay F. Biomechanics and Modeling in Mechanobiology. 2009;8:345–358. doi: 10.1007/s10237-008-0139-9. [DOI] [PMC free article] [PubMed] [Google Scholar]
- 40.Hyun HC, Lee JH, Kim M, Lee H. Journal of Materials Research. 2012;27:2677–2690. [Google Scholar]
- 41.Sabin G, Kaloni P. Journal of Applied Mathematics and Physics. 1983;34:370–386. [Google Scholar]
- 42.McCutchen CW. Journal of Biomechanics. 1982;15:325–327. doi: 10.1016/0021-9290(82)90178-6. [DOI] [PubMed] [Google Scholar]
- 43.Lin WC, Shull KR, Hui CY, Lin YY. Journal of Chemical Physics. 2007;127:094906. doi: 10.1063/1.2771167. [DOI] [PubMed] [Google Scholar]
- 44.Hecht AM, Duplessix R, Geissler E. Macromolecules. 1985;18:2167–2173. [Google Scholar]
- 45.Mallam S, Horkay F, Hecht AM, Geissler E. Macromolecules. 1989;22:3356–3361. [Google Scholar]
- 46.Shibayama M. Macromolecular Chemisty and Physics. 1998;199:1–30. [Google Scholar]
- 47.Kizilay MY, Okay O. Macromolecules. 2003;36:6856–6862. [Google Scholar]
- 48.Gundogan N, Okay O, Oppermann W. Macromolecular Chemisty and Physics. 2004;205:814–823. [Google Scholar]
- 49.Lin-Gibson S, Jones RL, Washburn NR, Horkay F. Macromolecules. 2005;38:2897–2902. [Google Scholar]
- 50.Liu R, Oppermann W. Macromolecules. 2006;39:4159–4167. [Google Scholar]
Associated Data
This section collects any data citations, data availability statements, or supplementary materials included in this article.