Abstract
Acoustic attenuation represents the energy loss of the propagating wave through biological tissues and plays a significant role in both therapeutic and diagnostic ultrasound applications. Estimation of acoustic attenuation remains challenging but critical for tissue characterization. In this study, an attenuation estimation approach was developed using the radiation-force-based method of Harmonic Motion Imaging (HMI). 2D tissue displacement maps were acquired by moving the transducer in a raster-scan format. A linear regression model was applied on the logarithm of the HMI displacements at different depths in order to estimate the acoustic attenuation. Commercially available phantoms with known attenuations (n=5) and in vitro canine livers (n=3) were tested, as well as HIFU lesions in in vitro canine livers (n=5). Results demonstrated that attenuations obtained from the phantoms showed a good correlation (R2=0.976) with the independently obtained values reported by the manufacturer with an estimation error (compared to the values independently measured) varying within the range of 15-35%. The estimated attenuation in the in vitro canine livers was equal to 0.32±0.03 dB/cm/MHz, which is in good agreement with the existing literature. The attenuation in HIFU lesions was found to be higher (0.58±0.06 dB/cm/MHz) than that in normal tissues, also in agreement with the results from previous publications. Future potential applications of the proposed method include estimation of attenuation in pathological tissues before and after thermal ablation.
Keywords: acoustic radiation force imaging, acoustic attenuation, linear regression, cross correlation, phantom, Harmonic Motion Imaging (HMI), HIFU lesions, in vitro canine liver
1. Introduction
Acoustic attenuation of biology tissues refers to physical and pathological properties of the tissue, thereby being evaluated by a number of researchers for various purposes (Parmar and Kolios 2006, Treece et al 2005, Lizzi et al 2003, Bigelow et al 2008, Damianou et al 1997). The ability to accurately estimate attenuation can be advantageous in therapeutic ultrasound (Parmar and Kolios 2006), ultrasound imaging (Treece et al 2005), ultrasonic tissue characterization (Bigelow et al 2008), and temperature monitoring (Damianou et al 1997). One of the most robust techniques for estimating acoustic attenuation is the broadband substitution method (Parker 1983). Other techniques include the centroid method and the multi-narrowband method by analyzing the backscattered ultrasound signals in B-mode images (Ophir et al 1984). However, the clinical translation of the attenuation estimation techniques have not fared well.
On the other hand, acoustic radiation force techniques have been proposed for attenuation measurements (Palmeri et al 2006) which may provide an alternative to conventional techniques. Kremkau et al. (1981) measured the reduction in radiation force resulting from the insertion of a tissue sample between a transducer and a reflector for attenuation estimation. Palmeri et al. (2006) developed an attenuation estimation approach using linear array transducers to generate a radiation force. The induced displacement is monitored after the application of the radiation force. By electronically shifting the ultrasound focus away from the transducer surface and in the meanwhile keeping the f-number of the transducer constant, the attenuation was calculated at the focal depth where the radiation force reaches a maximum. The method can be conveniently applied due to the use of conventional diagnostic scanners without any additional hardware.
Harmonic Motion Imaging (HMI) is a radiation-force-based technique, capable of monitoring the displacement in seamless synchronization with the application of radiation force, with applications to monitoring thermal ablation and tissue viscoelasticity evaluation (Maleke et al 2010, Maleke and Konofagou 2010, Hou et al 2010, Vappou et al 2009, Hou et al 2011). However, HMI is currently unable to quantify the Young's modulus of soft tissues, because the radiation force exerted within the excitation region remains unknown which relies on the attenuation and speed of sound.
Considering that the advantage of HMI over other radiation force techniques lies in the oscillatory nature of the displacement induced that can separate the harmonics from quasi-static effects, and HMI displacements are much localized as measured at the transducer's focal zone , we hereby present a work on investigating the attenuation estimation using HMI in order to further facilitate clinical translation for both elasticity imaging of soft tissues and assessment of tissue elasticity after thermal ablation such as HIFU.
2. Methods
2.1. Harmonic motion imaging setup
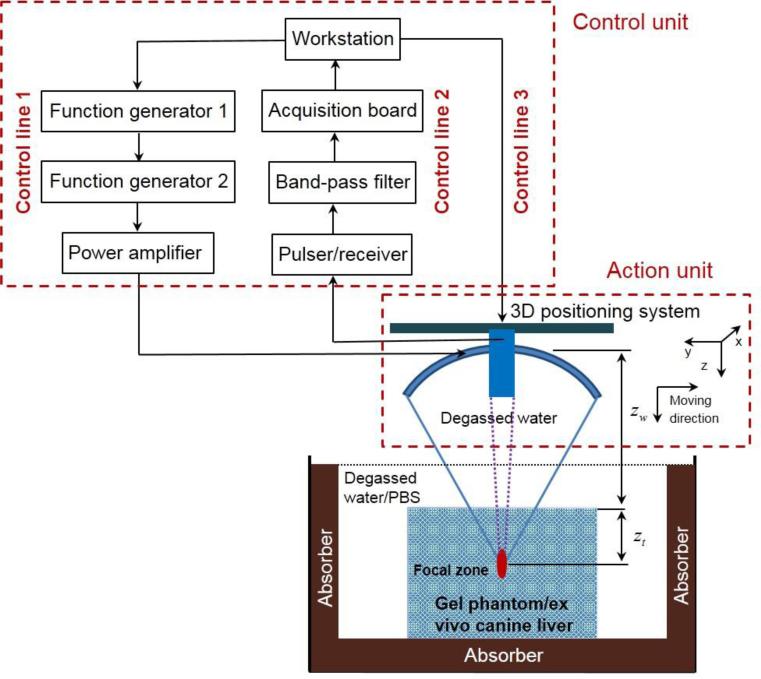
As illustrated in figure 1, the HMI system consisted of two units, i.e., an action unit and a control unit. The focused ultrasound (FUS) transducer was fed with an amplitude-modulated (AM) signal with duration being 400 ms and interval being 1 s to avoid accumulated thermal effects. The AM signal was amplified through a RF power amplifier (Model: 3000L, ENI®, NY, USA), resulting in an acoustic intensity of 0.1 W/cm2 on the transducer surface. Such an AM ultrasonic wave induced a time-varying radiation force in the focal region of the FUS transducer at twice the modulation frequency (25 Hz) (Houet al 2011). The resulting oscillatory motion at the focal zone was detected by the imaging transducer during force application.
Figure 1.
Experimental set-up. The action unit was comprised of a focused ultrasound transducer in conjunction with a concentric and confocal single-element, pulse-echo imaging transducer, both attached to a 3D positioning system. The control unit comprised of three control lines. Control line 1 outputted an amplitude-modulated signal with the carrier frequency at 4.75 MHz and the modulation frequency at 25 Hz. Control line 2 captured the echo signals with denoising. Control line 3 manipulated the 3D positioning system.
2.2. Theoretical development for acoustic attenuation estimation
The acoustic pressure field at the focus of a FUS transducer in an attenuating homogeneous medium can be derived as (Madsen et al 1981, Goodsitt et al 1982)
| (1) |
where R, p0, λ, a and α are the focal radius, acoustic pressure at the transducer surface, wavelength, transduce radius and acoustic attenuation, respectively.
It should be noted that equation (1) does not apply in the case shown in figure 1, where the wave propagation path covers biphasic media: water and tissue (i.e., an inhomogeneous medium). Nevertheless, this issue can be solved through the definition of a single medium using an effective attenuation coefficient in ignorance of any nonlinearity (Goodsitt et al 1982), i.e.,
| (2) |
where zw and zt are the propagation depths of the beam within the water and tissue, respectively. The reader should also note that the attenuation in water is assumed negligible, since the attenuation of water is more than two orders lower than soft tissue (Duck 1990).
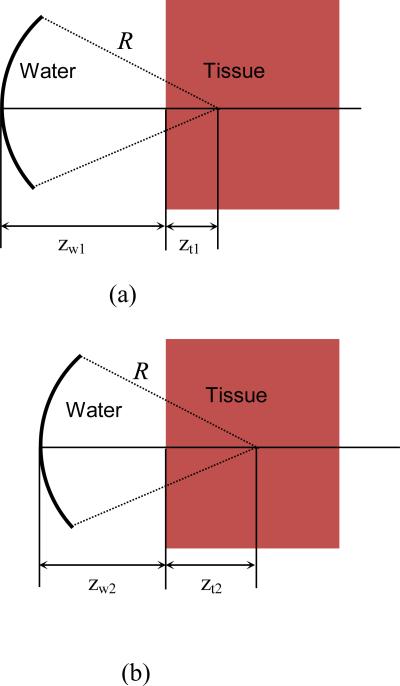
Considering two different focal positions in the tissue with depth being respectively zt1 (figure 2(a)) and zt2 (figure 2(b)), and taking into account the reflection at the water-tissue interface, we can then obtain the ratio between the acoustic pressures at the foci in the two cases as illustrated in figures 2(a) and 2(b), i.e.,
| (3) |
where t1, t2 are the transmission coefficients between water and tissue in cases a and b, respectively. αeff1 (f) and αeff1 (f) are the effective attenuations in cases a and b, respectively. Note that the transmission coefficient here is equal to the ratio between the transmitted pressure and the incident pressure in a non-flat boundary (depends on the liver shape at the incident point) with a focused wave, which is assumed to be a constant in the experiment.
Figure 2.
Illustration of attenuation measurement at two different focal locations within the tissue
If zt1 and zt2 are at the focus of the FUS transducer, i.e., zw1 + zt1 = R (figure 2(a)) and zw2 + zt2 = R (figure 2(b)), equation (3) becomes
| (4) |
Since α is frequency-dependent, i.e., α = α(f), and by assuming that the attenuation of soft tissues is linearly correlated with frequency as a first-order approximation, we let αt(f) = αtf in equation (4). The transmission coefficients t1 and t2 are assumed to be identical, as the two media (i.e., water and tissue) remain the same in both cases and the wave incident angle does not change significantly when zt1 and zt2 are at a short distance apart (the maximum distance between zt1 and zt2 is 5 mm in this study and focal length is 90 mm). In addition, the radiation force (F) depends linearly on the square of the acoustic pressure (Nyborg 1965, Kinsler et al 1999). Thus, the ratio between the radiation forces at depths at depths zt1 and zt2 can be expressed by
| (5) |
where F1(R) and F2(R) are radiation forces at zt1 and zt2 as shown in figures 2(a) and2(b)
From equation (5), the attenuation coefficient can then be obtained via
| (6) |
Based on equation (6), it is clear that the acoustic attenuation can be estimated only if the ratio between F1(R) and F2(R), frequency (f), and distance between and zt1 and zt2 are known. However, it is difficult to estimate the radiation force at the focus of the FUS transducer (i.e., F1(R) and F2(R)) because the tissue attenuation and speed of sound are unknown. On the other hand, considering the tissue as an infinite isotropic elastic solid, the displacement is related to the radiation force at the focus through a constant that depends on the elastic properties of the medium and the physical characteristic of the beam (Walker, 1999). Both are supposed to be identical within the localized region in our experiment. As a result, the radiation force ratio is equal to that of the displacements, i.e.,
| (7) |
where D1 and D2 are displacements induced by F1 and F2 at depths zt1 and zt2, respectively. Hence, HMI-related acoustic attenuation can be estimated via:
| (8) |
The aforementioned approach was then applied to the HMI displacements estimated at different depths for attenuation estimation but unlike in equation (8), i.e., the displacement at every depth (Dz) was compared against that at the initial depth (D0), i.e.,
| (9) |
where z0, z, D0 and Dz are the initial depth, the arbitrary depth, the HMI displacements at the initial depth and arbitrary depth, respectively. Following this sequence, the attenuation can thus be estimated using a linear regression model, i.e., linearly correlating
2.3. Phantoms
The attenuation of five commercial phantoms (50 mm in diameter and 50 mm in height; Computerized Imaging Reference Systems (CIRS), Inc., VA, USA) with known attenuations (table 1) was measured using the basic log spectral difference measurement (Kuc and Schwartz 1979) by the manufacturer, with the parameters listed in Table 1. The phantom was tested using the HMI technique, in which the transducer was operated in a raster-scan format at a scanning step of 0.5 mm with the total scanned area of 5×5 mm2 in the y-z plane as shown in figure 1. Note that the scanned region was chosen at least 3 mm deep from the surface of the phantom to avoid boundary effects.
Table 1.
Independently measured (provided by the manufacturer) and estimated attenuations of five CIRS phantoms (unit: dB/cm/MHz)
| Phantom No. | Independently measured | Test-1 | Test-2 | Test-3 | Test-4 | Test-5 | Mean | SD |
|---|---|---|---|---|---|---|---|---|
| 1 | 0.28 | 0.176 | 0.193 | 0.224 | 0.255 | 0.221 | 0.214 | 0.031 |
| 2 | 0.57 | 0.573 | 0.503 | 0.495 | 0.424 | 0.435 | 0.486 | 0.06 |
| 3 | 0.90 | 0.78 | 0.787 | 0.618 | 0.58 | 0.659 | 0.685 | 0.944 |
| 4 | 1.17 | 0.857 | 0.776 | 0.834 | 0.869 | 0.67 | 0.801 | 0.082 |
| 5 | 1.45 | 1.092 | 0.974 | 0.95 | 0.852 | 0.836 | 0.941 | 0.104 |
In addition, to test the dependence of the proposed method on the output acoustic intensity of the FUS transducer, two supplementary tests on phantom 2 were conducted with (i) the acoustic intensity being 0.1 W/cm2 (same as the intensity used for attenuation estimation in this study) and the raster scanning depth of 10 mm at a scanning step of 1 mm; and (ii) the configuration same as in (i) but with the acoustic intensity increased to 0.2 W/cm2. Here, phantom 2 was selected for the high intensity test because the attenuation of phantom 2 (0.57 dB/cm/MHz) is close to normal biological tissues (Duck 1990).
2.4. In vitro canine livers
The proposed method was additionally applied to estimate the attenuations in three in vitro canine livers (protocol number: Columbia University AC-AAAD5650). Prior to the measurement, each specimen was immersed in phosphate buffered saline (PBS) solution and placed in a vacuum chamber for one and a half hours for degassing. After they were degassed, the liver tissues were moved from the vacuum chamber to the water bath filled with degassed PBS solution, during which the samples were kept submerged in degassed saline to avoid air exposure.
2.5. HIFU treated in vitro canine livers
Five in vitro canine livers were ablated using the FUS transducer excited (i) at 600 mVpp (about 0.1 W/cm2 at the surface of the FUS transducer) with the activation duration being 120 s, and (ii) at 900 mVpp (around 0.21 W/cm2 at the surface of the FUS transducer) during 30 s. Both are performed on the same sample but at different locations for comparison to investigate the effect of different acoustic intensities during HIFU ablation on the attenuation of the induced lesions. In each case, the FUS transducer was operated in a raster-scan format, i.e., 11 consecutive positions with the moving step of 3 mm in the lateral direction and 2 positions with the step being 3 mm in the axial direction, resulting in a lesion with the dimension of roughly 2×3 cm2.
3. Results
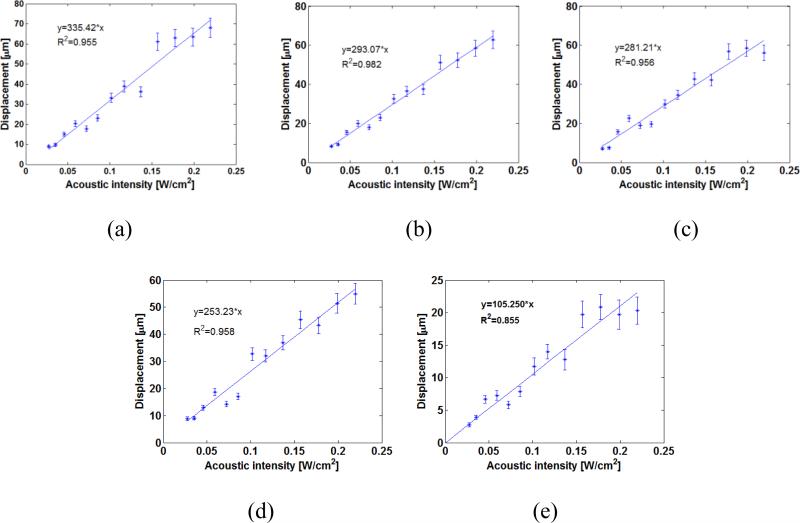
The relationship between the acoustic intensity and induced displacement in the samples are representatively shown in figures 3(a)-3(c) for CIRS phantoms 1, 3, and 5; and in figure 3(d)-3(e) for in vitro normal livers before and after ablation, respectively. The results demonstrated that there was a strong linear correlation (r > 0.925, p < 0.001), calculated by Pearson's correlation coefficient) between the acoustic intensity and induced displacement in the sample.
Figure 3.
HMI displacement vs. acoustic intensity in phantom 1 (a), 3 (b), 5 (c), one in vitro canine liver before (d) and after HIFU ablation (e) (The error bars equal one standard deviation across different measurement in the same sample.)
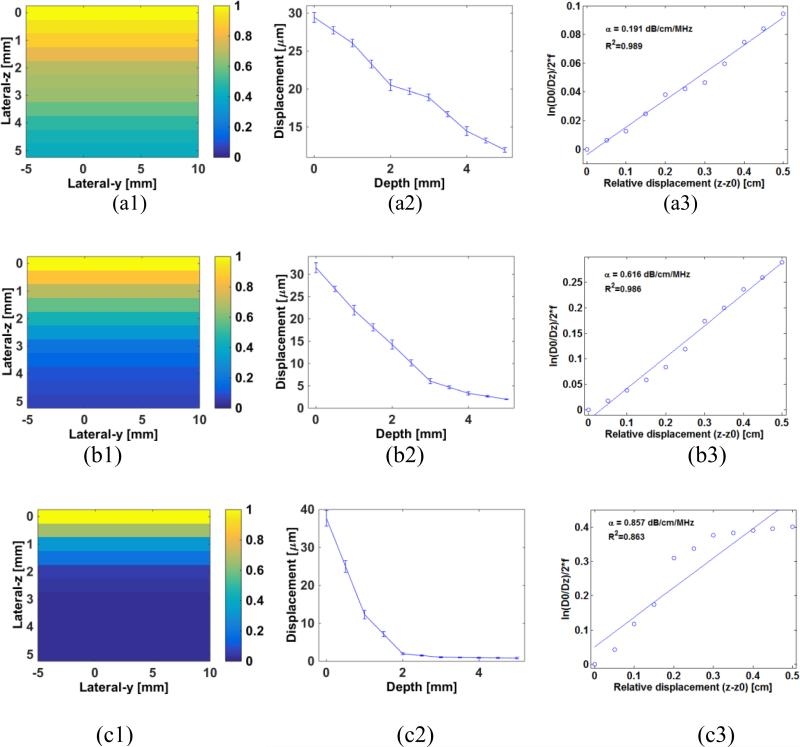
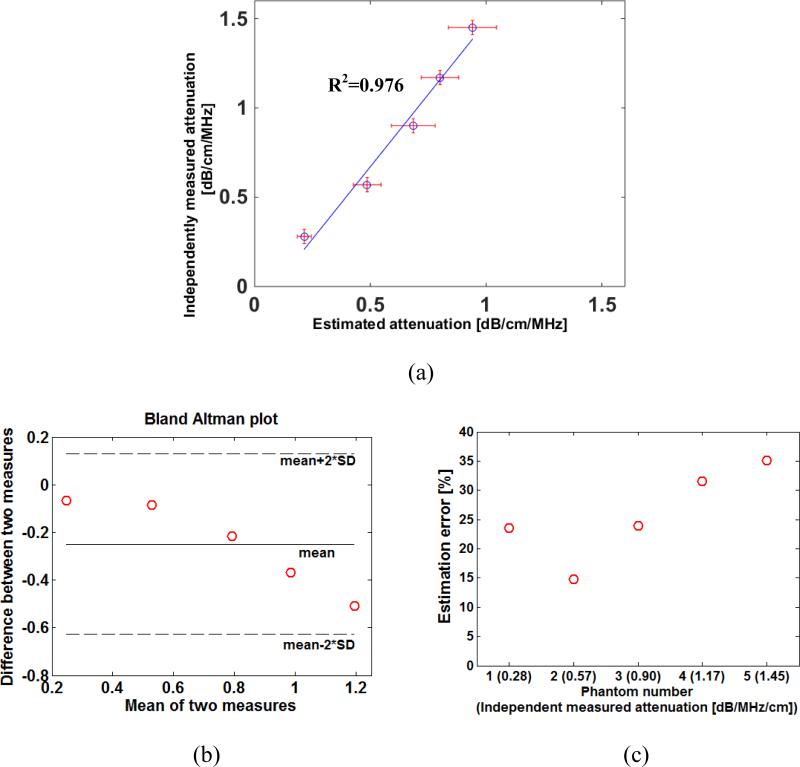
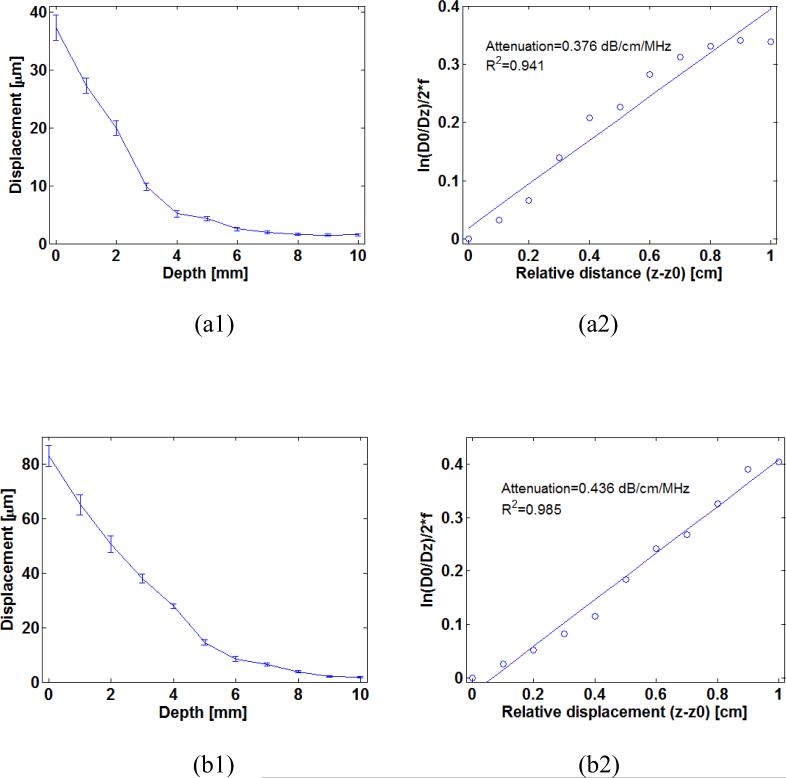
Figure 4 representatively shows the 2D HMI displacement maps, displacement curves and the estimated attenuations of phantoms 1, 3 and 5. The estimated attenuations are compared with those independently measured (table 1), with the correlation coefficient equal to 0.976 (p = 0.02) (figure 5(a)). The Bland-Altman analysis and estimation errors are shown in figure 5(b) and 6(c), respectively, with the errors varied within 15%-35%. The HMI displacements and estimated attenuations using different acoustic intensities (i.e., 0.1 and 0.2 W/cm2) are shown in figure 6.
Figure 4.
2D HMI displacement map, normalized HMI displacement versus depth and linear regression of the and z – z0 in phantoms 1 (a), 3 (b) and 5 (c).
Figure 5.
(a) Correlation between estimated attenuations and those independently measured from five CIRS (Computerized Imaging Reference Systems) phantoms; (b) bland-Altman analyses of the attenuation data shown in (a); (c) estimation errors of estimated attenuations with respect to those independently measured (The error bars equal one standard deviation across different measurements in the same sample.)
Figure 6.
(a1) HMI displacement with depth and (a2) linear regression of the and z – z0 under acoustic intensity of 0.1 W/cm2 for an in vitro canine liver (b1) HMI displacement with depth and (b2) linear regression of the and z – z0 under acoustic of 0.2 W/cm2 for an in vitro canine liver (The error bars equal one standard deviation across different measurements in the same sample.)
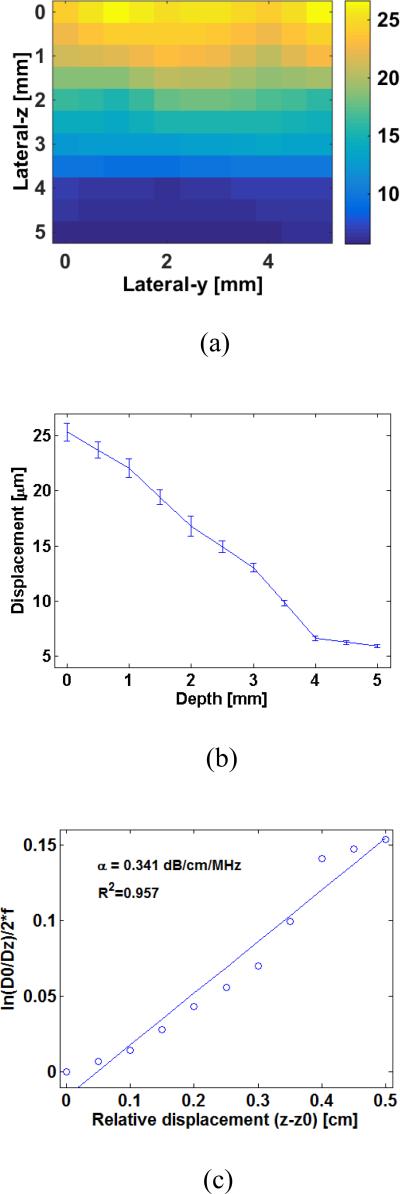
The estimated attenuation values of the three in vitro canine livers varied from 0.293 to 0.353 dB/cm/MHz (table 2). Figure 7 representatively presents the displacement map (figure 7(a)) and curve (figure 7(b)) captured from an in vitro canine liver, based on which the acoustic attenuation is estimated (figure 7(c)).
Table 2.
Estimated attenuations of three in vitro canine livers (unit: dB/cm/MHz)
| Phantom No. | Test-1 | Test-2 | Test-3 | Test-4 | Test-5 | Mean | SD |
|---|---|---|---|---|---|---|---|
| 1 | 0.282 | 0.292 | 0.323 | 0.367 | 0.352 | 0.323 | 0.037 |
| 2 | 0.412 | 0.364 | 0.341 | 0.31 | 0.338 | 0.353 | 0.038 |
| 3 | 0.341 | 0.318 | 0.273 | 0.263 | 0.276 | 0.294 | 0.034 |
Figure 7.
(a) HMI displacement map and (b) curves obtained from one in vitro canine liver; (c) Linear regression of the and z – z0 for estimating attenuation of the canine liver
The estimated attenuations in in vitro canine livers before and after HIFU ablation are compared and listed in table 3. Paired-sample t-test evaluation showed significant difference in estimated attenuation between the normal tissue (NT) and HIFU lesions using lower (LL) and higher (LH) acoustic intensities with p-value of NT-LL, NT-LH and LL-LH being 0.0018, 1.06×10⁻⁴ and 0.0383, respectively.
Table 3.
Estimated attenuations of in vitro canine livers before and after ablations with different acoustic intensities and thermal durations (unit: dB/cm/MHz)
| Case | Test-1 | Test-2 | Test-3 | Test-4 | Test-5 | Mean | Standard Deviation |
|---|---|---|---|---|---|---|---|
| Normal tissue | 0.354 | 0.342 | 0.243 | 0.296 | 0.387 | 0.325 | 0.056 |
| After ablation (0.1 W/cm2-120s) | 0.614 | 0.424 | 0.527 | 0.467 | 0.566 | 0.520 | 0.076 |
| After ablation (0.21 W/cm2-30s) | 0.618 | 0.562 | 0.762 | 0.58 | 0.717 | 0.648 | 0.088 |
4. Discussion
In this study, an attenuation estimation method was developed based on the radiation-force-based technique of HMI. It takes advantage of the capability of HMI to simultaneously generate the radiation force and monitor the induced local displacement at the focus of the FUS transducer. The HMI displacements estimated at different depths within the raster-scan were analyzed using a linear regression model for estimating the attenuation. As it is based on the variation in the local displacement (i.e., HMI displacement) with depth, this method is capable of estimating variations in tissue attenuation properties within a localized region. It could thus be potentially applied to evaluate tissues with local inhomogeneities such as tumors and HIFU-induced thermal lesions. In addition, the proposed method was theoretically demonstrated to be independent of the speed of sound (equations (5)), indicating its unique strength for evaluating tissues under thermal treatment.
In all CIRS phantoms, in vitro livers and HIFU lesions tested in this study, a linear relationship between the acoustic intensity and HMI displacement was found (figure 3) in the study. Such a relationship held for all sample points which were selected throughout the raster-scan plane. The samples were thereby considered as linearly elastic at the force amplitude and frequency used.
As indicated in figure 6, the HMI displacement decreased with depth due to the effect of attenuation. Based on this, the attenuation of those phantoms were differentiated using the proposed linear regression model (equation (9)) and shown in figure 3 with high correlation coefficients. However, the correlation coefficient for phantom 5 (0.863) with the higher attenuation is lower than those for phantoms 1-4 (around 0.98). This may be explained by the fact that in the phantom with extremely high attenuation, the signal-to-noise ratio (SNR) of the HMI displacement also decreased significantly over a depth with strong attenuation.
As indicated in figure 5, the phantom with the highest attenuation (e.g., phantom 5) exhibited the greatest estimation error. This may be due to the fact that the both the SNR and the amplitude of the displacements in the highly attenuated phantom have decreased rapidly with depth. As our system can only detect the displacement on the order of a few microns, the attenuated displacements beyond certain depths may approximate the resolution limit, i.e., the linear assumption may not hold when attenuation exceeds a certain value. Nevertheless, the estimation errors are still relatively smaller for low attenuation phantoms (e.g., phantoms 1 and 2), indicating that the proposed method may be more applicable to superficial tissue regions, or simply tissues with lower attenuations. On the other hand, the SNR may still be increased by raising the acoustic intensity which may result in higher HMI displacement in more highly attenuating materials. As shown in figure 6, the estimation using the more severely acoustic intensity has a higher regression coefficient (0.985), and the attenuation value (0.436 dB/cm/MHz) is closer to what is independently measured (0.57 dB/cm/MHz in table 1) than using the lower acoustic intensity. It is indicated that by increasing the acoustic intensity, the estimation accuracy and sensitivities in highly attenuating materials can be improved. Note that the higher intensity (i.e., 0.2 W/cm2) remained within the range in which the phantoms were tested and deemed to be linearly elastic (figure 3) (i.e., the proposed theoretical model (equation (9)) can still be applicable to the attenuation estimation in this case). However, higher acoustic intensities may also induce biased estimation, due to higher tissue nonlinearities, which goes beyond the scope of this work and requires future investigations. More importantly, the accuracy of the estimated attenuation may also be impaired due to unexpected thermal effect under higher acoustic intensities, because (i) the tissue stiffness may be changed, leading to altered HMI displacements; and (ii) the tissue attenuation is temperature-dependent (Damianou 2003, Damianou et al 1997, Clarke et al 2003). Ongoing efforts are being implemented in order to optimize the HMI sequence to produce displacement measurement with good SNR while minimizing any thermal/nonlinear effect, which requires future investigations.
Using the proposed method, the estimated acoustic attenuation of the canine livers was 0.32±0.03 dB/cm/MHz (table 2), which falls well within the range reported in the literature for in vitro normal livers (0.28-0.399 dB/cm/MHz) (Pohlhammer et al 1981, Lin et al 1987, Lyons and Parker 1988, Duck 1990). Table 3 indicates that the HIFU lesions exhibited higher attenuation than the normal tissues, which is in line with previous literature (Damianou et al 1997, Damianou 2003, Techavipoo et al 2004, Clarke et al 2003, Tyreus and Diederich 2004). In addition, the lesion produced under the acoustic intensity of 0.2 W/cm2 was shown to have higher attenuation compared to 0.1 W/cm2, most likely due to the fact that the higher intensity used in this study may change the property of the tissue more severely, resulting in higher attenuation. The results here also demonstrated initial feasibility of this technique on inhomogeneous tissues (e.g., HIFU lesions).
Ongoing investigations include (i) developing a nonlinear model for tissue attenuation measurement, e.g., during HIFU application; (ii) testing the capability of the proposed method to measure attenuation in other types of inhomogeneous materials; and (iii) application to pathological tissues.
5. Conclusion
Acoustic attenuation is an important ultrasonic tissue characterization parameter in both ultrasound imaging and therapeutic ultrasound. In this study, an attenuation estimation approach was developed using the radiation-force-based method of HMI. The variation in HMI displacements across various depths within phantoms or tissues was used for attenuation estimation based on a linear regression model using commercial phantoms with known attenuations and in vitro canine livers. Results demonstrated that (i) the attenuations of the phantoms estimated using the proposed method showed a good correlation with the independently obtained values (estimation error: 15%-35%); (ii) the estimated attenuations in in vitro livers lied within the range reported in the previous literature; and (iii) the HIFU lesions had a higher attenuation than that of the normal tissues, while the attenuation of HIFU lesions produced using higher acoustic intensity was higher than that using lower acoustic intensity. Ongoing studies are focusing on applying the proposed method to estimate attenuations of pathological tissues such as breast or pancreatic tumors.
Acknowledgements
This project was supported by the National Institutes of Health (R01EB014496).
REFERENCE
- Bigelow TA, McFarlin BL, O'Brien WD, Oelze ML. In vivo ultrasonic attenuation slope estimates for detecting cervical ripening in rats: Preliminary results. J Acoust Soc Am. 2008;123:1794–800. doi: 10.1121/1.2832317. [DOI] [PMC free article] [PubMed] [Google Scholar]
- Clarke RL, Bush NL, Ter Haar GR. The changes in acoustic attenuation due to in vitro heating. Ultrasound Med Biol. 2003;29:127–35. doi: 10.1016/s0301-5629(02)00693-2. [DOI] [PubMed] [Google Scholar]
- Damianou C. In vitro and in vivo ablation of porcine renal tissues using high-intensity focused ultrasound. Ultrasound Med Biol. 2003;29:1321–30. doi: 10.1016/s0301-5629(03)00981-5. [DOI] [PubMed] [Google Scholar]
- Damianou CA, Sanghvi NT, Fry FJ, MaassMoreno R. Dependence of ultrasonic attenuation and absorption in dog soft tissues on temperature and thermal dose. J Acoust Soc Am. 1997;102:628–34. doi: 10.1121/1.419737. [DOI] [PubMed] [Google Scholar]
- Duck FA. Physical properties of tissue: A comprehensive reference book. Academic Press; London: 1990. [Google Scholar]
- Goodsitt MM, Madsen EL, Zagzebski JA. Ultrasonic radiators in attenuating and non-attenuating media. J Acoust Soc Am. 1982;71:318–29. [Google Scholar]
- Hou GY, Luo J, Marquet F, Maleke C, Vappou J, Konofagou EE. Performance assessment of HIFU lesion detection by Harmonic Motion Imaging for focused ultrasound (HMIFU): A 3-D finite-element-based framework with experimental validation. Ultrasound Med Biol. 2011;37:2013–27. doi: 10.1016/j.ultrasmedbio.2011.09.005. [DOI] [PMC free article] [PubMed] [Google Scholar]
- Hou GY, Luo JW, Maleke C, Konofagou EE. Simulation of HMIFU (Harmonic Motion Imaging for Focused Ultrasound) with in-vitro validation.. IEEE 36th Annual Northeast Bioengineering Conference.2010. [Google Scholar]
- Kinsler LE, Frey AR, Coppens AB, Sanders JV. Fundamentals of acoustics. Vol. 1. Wiley-VCH; 1999. [Google Scholar]
- Kremkau FW, Barnes RW, Mcgraw CP. Ultrasonic-attenuation and propagation speed in normal human-brain. J Acoust Soc Am. 1981;70:29–38. [Google Scholar]
- Kuc R, Schwartz M. Estimating the acoustic attenuation coefficient slope for liver from reflected ultrasound signals. IEEE T Son Ultrason. 1979;26:353–62. [Google Scholar]
- Lin T, Ophir J, Potter G. Frequency-dependent ultrasonic differentiation of normal and diffusely diseased liver. J Acoust Soc Am. 1987;82:1131–8. doi: 10.1121/1.395303. [DOI] [PubMed] [Google Scholar]
- Lizzi FL, Mikaelian S, Muratore R, Alam S, Ramachandran S, Deng C. Radiation force monitoring of HIFU lesions: Effects of system and tissue factors. In: Chapelon JY, Lafon C, editors. 3rd International Symposium on Therapeutic Ultrasound. Lyon, France: 2003. pp. 186–91. [Google Scholar]
- Lyons ME, Parker KJ. Absorption and Attenuation in Soft-Tissues. 2. Experimental Results. Ieee Transactions on Ultrasonics Ferroelectrics and Frequency Control. 1988;35:511–21. doi: 10.1109/58.4189. [DOI] [PubMed] [Google Scholar]
- Madsen EL, Goodsitt MM, Zagzebski JA. Continuous waves generated by focused radiators. J Acoust Soc Am. 1981;70:1508–17. [Google Scholar]
- Maleke C, Konofagou EE. In vivo feasibility of real-time monitoring of focused ultrasound surgery (FUS) using Harmonic Motion Imaging (HMI) IEEE Trans Biomed Eng. 2010;57:7–11. doi: 10.1109/TBME.2009.2027423. [DOI] [PubMed] [Google Scholar]
- Maleke C, Luo J, Gamarnik V, Lu XL, Konofagou EE. Simulation study of amplitude-modulated (AM) Harmonic Motion Imaging (HMI) for stiffness contrast quantification with experimental validation. Ultrasonic Imaging. 2010;32:154–76. doi: 10.1177/016173461003200304. [DOI] [PubMed] [Google Scholar]
- Nyborg WLM. In: Physical Acoustics. Mason WP, editor. Academic Press; New York: 1965. pp. 265–331. [Google Scholar]
- Ophir J, Shawker TH, Maklad NF, Miller JG, Flax SW, Narayana PA, Jones JP. Attenuation estimation in reflection - progress and prospects. Ultrasonic Imaging. 1984;6:349–95. doi: 10.1177/016173468400600401. [DOI] [PubMed] [Google Scholar]
- Palmeri ML, Frinkley KD, Oldenburg KG, Nightingale KR. Characterizing acoustic attenuation of homogeneous media using focused impulsive acoustic radiation force. Ultrasonic Imaging. 2006;28:114–28. doi: 10.1177/016173460602800204. [DOI] [PMC free article] [PubMed] [Google Scholar]
- Parker KJ. Ultrasonic-attenuation and absorption in liver-tissue. Ultrasound Med Biol. 1983;9:363–9. doi: 10.1016/0301-5629(83)90089-3. [DOI] [PubMed] [Google Scholar]
- Parmar N, Kolios MC. An investigation of the use of transmission ultrasound to measure acoustic attenuation changes in thermal therapy. Med Biol Eng Comput. 2006;44:583–91. doi: 10.1007/s11517-006-0067-8. [DOI] [PubMed] [Google Scholar]
- Pohlhammer JD, Edwards CA, W. D. O'Brien J. Phase insensitive ultrasonic attenuation coefficient determination of fresh bovine liver over an extended frequency range. Med Phys. 1981;8:692–4. [Google Scholar]
- Techavipoo U, Varghese T, Chen Q, Stiles TA, Zagzebski JA, Frank GR. Temperature dependence of ultrasonic propagation speed and attenuation in excised canine liver tissue measured using transmitted and reflected pulses. J Acoust Soc Am. 2004;115:2859–65. doi: 10.1121/1.1738453. [DOI] [PubMed] [Google Scholar]
- Treece G, Prager R, Gee A. Ultrasound attenuation measurement in the presence of scatterer variation for reduction of shadowing and enhancement. IEEE T Ultrason Ferr. 2005;52:2346–60. doi: 10.1109/tuffc.2005.1563279. [DOI] [PubMed] [Google Scholar]
- Tyreus PD, Diederich C. Two-dimensional acoustic attenuation mapping of high-temperature interstitial ultrasound lesions. Phys Med Biol. 2004;49:533–46. doi: 10.1088/0031-9155/49/4/005. [DOI] [PubMed] [Google Scholar]
- Vappou J, Maleke C, Konofagou EE. Quantitative viscoelastic parameters measured by harmonic motion imaging. Phys Med Biol. 2009;54:3579–94. doi: 10.1088/0031-9155/54/11/020. [DOI] [PubMed] [Google Scholar]


