Abstract
Gold nanorods (AuNRs) have shown great potential as bio-compatible imaging probes in various biological applications. Probing nanomaterials in live cells is essential to reveal the interaction between them. In this study, we used a transient absorption microscope to selectively image AuNRs in live cells. The transient absorption signals were monitored through lock-in amplification. This provides a new way of observing AuNRs with no interference from background autofluorescence.

Metal nanoparticles have shown many promising optical properties, as well as other intrinsic characteristics, which make them great candidates for biomedical research. They have been demonstrated as molecular carriers, diagnostic probes, and therapeutic agents [1–4]. Among the variety of metal nanoparticles, gold nanorods (AuNRs) display particularly unique characteristics. They present a diverse range of optical processes, as their electron energy states can be finely regulated by the size and aspect ratio of the rods [5]. Furthermore, AuNRs can generate surface plasmon and result in a high intensity local electro-magnetic field, through which the spontaneous Raman signal can be greatly enhanced [6]. AuNRs are strong light scatterers, which ensure their visualization by dark field microscopy [7–11]. AuNRs can also produce both single-photon and two-photon excitation luminescence (TPL) [12–14]. The TPL has shown higher intensity than two-photon excited cellular autofluorescence under the same irradiation power [15]. However, the TPL intensity of AuNRs is not as high as that of the common fluorescent dyes [15]. Moreover, when conjugating AuNRs with intrinsically fluorescent molecules, it can become difficult to distinguish TPL of AuNRs from exgenous fluorescence.
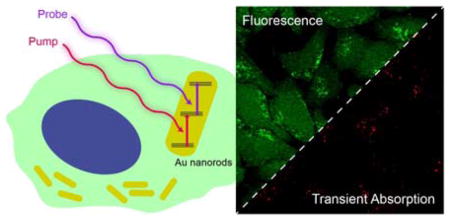
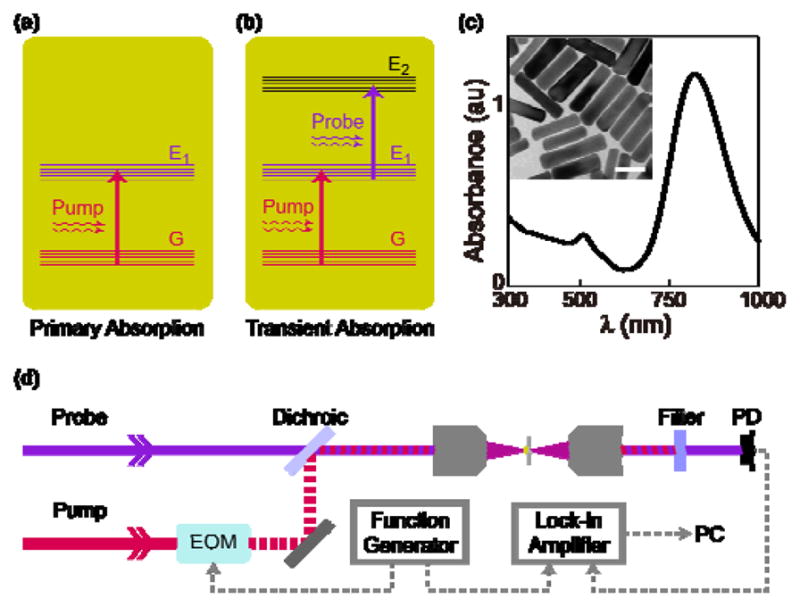
Herein, we report a new imaging modality, transient absorption (TA), to selectively image AuNRs in live cells. TA is a mature method in spectroscopic measurement [16–19], and it has recently been coupled with scanning microscopy as a contrast source to image single-walled carbon nanotubes and nanodiamonds [20, 21]. TA, a multi-photon processs, is the secondary absorption happening at the excitation state after the system’s primary absorption, which can be characterized by an absorption spectrum (Figure 1). This nonlinear optical response provides TA with intrinsic three-dimensional sectioning capability. With transient absorption microscopy (TAM), we can selectively highlight AuNRs from any fluorescent environment, providing a superior selectivity and background-free images.
Fig. 1.

Transient absorption of gold nanorods. (a) Primary absorption (pump) happened between the ground state (G) and the first excited state (E1). (b) Transient absorption (probe) is the transition between excited states after the primary absorption. (c) UV-Vis absorption spectrum of gold nanorods. The inset is a TEM image of the same sample. The scale bar is 40 nm. (d) Schematic diagram of the transient absorption microscopy system. PD: Photodiode.
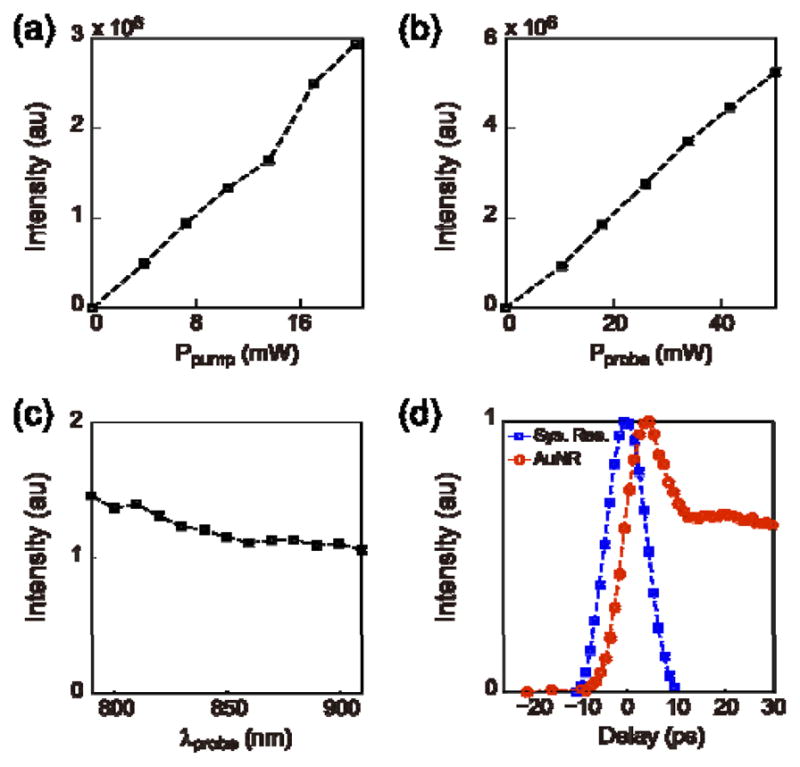
We first studied the optical properties of AuNRs with TAM. The experimental setup has been reported previously [21]. Briefly, two spatially and temporally overlapped picosecond pulse lasers were introduced into a scanning microscope, serving as pump beam (1064 nm) and probe beam (tunable between 780–990 nm) in TAM. The TA signal strength is dependent on the incident power of laser beams. The power dependences on both pump and probe beams were verified by fixing the power of one beam, and the altering power of the other beam. TA signal intensity was recorded against both increasing and decreasing laser power (Figure 2 (a) and (b)). The probe wavelength was then scanned from 790 nm to 910 nm (Figure 2 (c)), and the signal intensity was almost maintained constant, indicating a board-band secondary absorption of AuNRs around the near-infrared region. We also measured the dependence of signal intensity against the delay time between two pulses (Figure 2 d)). There was no signal when the probe pulse was ahead of the pump pulse. As the probe pulse was delayed with reference to the pump pulse, the TA signal first increased and then decreased. The asymmetric temporal behavior is a result of the transient nature in this process. The TA signal of AuNRs has a much longer life-time than the pulse width.
Fig. 2.

Characterization of the transient absorption property of AuNRs. (a) The dependence of the TA intensity on the excitation power of the pump beam (1064 nm). (b) The dependence of the TA intensity on the excitation power of the probe beam (850 nm). (c) The dependence of the TA intensity on the probe wavelength. (d) The time-resolved TA intensity (red), with the stimulated Raman scattering signal of dodecane to present the system response (blue).
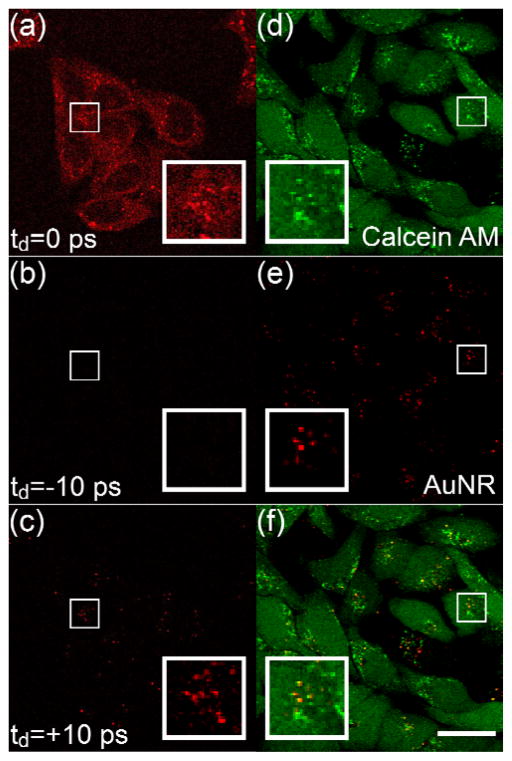
We then applied TAM to image the cell uptake of AuNRs. HeLa cells were incubated in the culture medium with AuNRs for 8 h, and then imaged with TAM using the wavelength combination of 1064 nm (pump) and 816.7 nm (probe). The imaging system is also capable of performing stimulated Raman scattering (SRS) microscopy [22]. SRS can directly probe Raman-active vibrations, without labeling, from specific chemical bonds or structures, such as CH2, which is abundant in cellular lipids. However, SRS can only be carried out when the two laser pulse trains are perfectly overlapped in time-domain. Through these wavelengths we used the SRS signal of CH2 stretching (2845 cm−1), when the time delay was adjusted to 0, to provide the lipid distribution inside live cells for comparison. When the SRS reveals the lipid components of live cells, we also observed bright dots scattered in cells, mostly in the cytoplasm (Figure 3 (a)). The SRS signal of lipid was relatively weak and evenly distributed cross the whole cell body except the nuclei, and it clearly sketched the outline of cells.
Fig. 3.
Imaging AuNRs in live cells. (a)–(c) Imaging AuNRs in live HeLa cells at different delay time between the pulse trains of pump and probe beams. Inset in (c) shows a magnified region with AuNRs. (d) Two-photo luminescence (TPL) image of AuNRs-containing live HeLa cells stained with calcein AM. (e) TA image of AuNRs demodulated by a lock-in amplifier. (f) Merged image of (d) and (e), showing the distribution of AuNRs in a highly fluorescent background. Inset in (f) shows a zoomed region, yellow indicates colocalized TPL and TA signal from AuNRs. Scale bar: 25 μm.
The unusually bright dots were actually the TA signal from AuNRs inside the cells. We adjusted the delay time between pump and probe pulse trains to differentiate the TA signal from SRS. When we tuned the probe pulses ahead of the pump pulses with the separation of 10 ps (we defined this as −10 ps), we found that both weak and strong signals have disappeared (Figure 3(b)). However, when we tuned the delay to be +10 ps, the weak signal disappeared while the strong dots were still visible (Figure 3(c)). With this experimental configuration, we can clearly monitor the AuNRs through TA and completely eliminate the influence from SRS background signal generated by any other compounds. Furthermore, by adjusting the proper delay between pulse trains, we can achieve the multi-modal imaging with the TAM setup, combining the chemical specificities from both SRS and TA. Both SRS and TA are multiphoton processes, which provide comparable 3D sectioning capabilities [21].
TA, like SRS, can probe the AuNRs in high spatial resolution at the diffraction limit. To verify whether the AuNRs form aggregates in aqueous solutions, we measured the hydrodynamic radius, Rh, of AuNRs that dispersed in the cell culture medium by dynamic light scattering. The apparent Rh,app value determined at 30° was 18 nm. The diameter was thus comparable to the length of AuNRs (40 nm) measured by TEM, suggeting that AuNRs stayed mainly as single particles in the culture medium.
TA signal was acquired by a large-area photodiode that collected all the signals generated by laser excitation within the focal volume, including the fluorescence. However, the TA signal was encoded with the same modulation frequency as the pump beam while the fluorescence signal would not carry this frequency if it could not be excited by the pump laser. With a lock-in amplifier, which only demodulated the signal with the encoded pumping frequency, we should be able to easily decouple the weak TA signal from strong fluorescence background. We then tested the imaging capability of AuNRs using TAM with the existence of calcein AM, a fluorescent dye to indicate the cell viability [23, 24]. After the HeLa cells were cultured with AuNRs-containing culture medium for 8 h, calcein AM was introduced to stain the live cells. Subsequently, all the live cells exhibited strong two-photon fluorescence under the excitation of probe laser (816.7 nm). This high-intensity green fluorescence spectrally well overlapped with the AuNR’s two-photon luminescence emission and makes the differentiation of them impossible through the wavelength selection under the two-photon imaging channel (Figure 3(d)). This disadvantage has created various difficulties of applying AuNRs as labels in biological research. However, the TA image (Figure 3(e) and (f)) shows only AuNRs with extremely clean background. This spectral orthogonal imaging modality of AuNRs allows us to use them as a new category of labeling nanomaterials for bioimaging.
In summary, transient absorption can serve as a novel modality to image gold nanorods. The selective imaging capability can distinguish AuNRs from high backgrounds of Raman scattering or wavelength-overlapped fluorescence, avoiding the difficult identification of AuNRs with other optically active species. TAM, excited with near-infrared lasers, also provides the intrinsic 3D imaging capability with high spatial resolution, making it a suitable for live cell imaging using AuNRs as spectrally orthogonal labels. With the long-wavelength excitation provided by near-infrared lasers, TAM is a promising modality in tissue imaging, which would be hard for TPL or dark-field microscopy. By tuning the pump/probe wavelengthes, hopefully, multiplex imaging can also be achieved. In addition, the absorption nature in TA process creates the possibility to quantitatively analyze single nanoparticles.
Supplementary Material
Acknowledgments
The authors thank Dr. Brian Saar and Prof. X. Sunney Xie for providing the lock-in amplifier. This work was financially supported by the Ministry of Science and Technology of China (Grant no. 2011CB809106), the National Natural Science Foundation of China (Grant no. 21222501 and 91313302), and the intramural research program of the National Institute of Biomedical Imaging and Bioengineering, National Institutes of Health.
Footnotes
Electronic Supplementary Information (ESI) available: Experimental details and supplementary results. See DOI: 10.1039/b000000x/
Contributor Information
Shouhui Chen, Email: shawn.chen@nih.gov.
Yanyi Huang, Email: yanyi@pku.edu.cn.
Notes and references
- 1.Ghosh P, Han G, De M, Kim CK, Rotello VM. Adv Drug Deliv Rev. 2008;60:1307. doi: 10.1016/j.addr.2008.03.016. [DOI] [PubMed] [Google Scholar]
- 2.El-Sayed IH, Huang XH, El-Sayed MA. Nano Lett. 2005;5:829. doi: 10.1021/nl050074e. [DOI] [PubMed] [Google Scholar]
- 3.Visaria RK, Griffin RJ, Williams BW, Ebbini ES, Paciotti GF, Song CW, Bischof JC. Mol Cancer Ther. 2006;5:1014. doi: 10.1158/1535-7163.MCT-05-0381. [DOI] [PubMed] [Google Scholar]
- 4.Khlebtsov B, Zharov V, Melnikov A, Tuchin V, Khlebtsov N. Nanotechnology. 2006;17:5167. [Google Scholar]
- 5.Link S, El-Sayed MA. J Phys Chem B. 1999;103:8410. [Google Scholar]
- 6.Orendorff CJ, Gearheart L, Jana NR, Murphy CJ. Phys Chem Chem Phys. 2006;8:165. doi: 10.1039/b512573a. [DOI] [PubMed] [Google Scholar]
- 7.Huang XH, El-Sayed IH, Ian W, El-Sayed MA. J Am Chem Soc. 2006;128:2115. doi: 10.1021/ja057254a. [DOI] [PubMed] [Google Scholar]
- 8.Sonnichsen C, Franzl T, Wilk T, von Plessen G, Feldmann J. Phys Rev Lett. 2002;88:077402. doi: 10.1103/PhysRevLett.88.077402. [DOI] [PubMed] [Google Scholar]
- 9.Sonnichsen C, Alivisatos AP. Nano Lett. 2005;5:301. doi: 10.1021/nl048089k. [DOI] [PubMed] [Google Scholar]
- 10.Xu D, He Y, Yeung ES. Anal Chem. 2014;86:3397. doi: 10.1021/ac403700u. [DOI] [PubMed] [Google Scholar]
- 11.Xiong B, Zhou R, Hao J, Jia Y, He Y, Yeung ES. Nat Commun. 4:1708. doi: 10.1038/ncomms2722. [DOI] [PubMed] [Google Scholar]
- 12.Mohamed MB, Volkov V, Link S, El-Sayed MA. Chem Phys Lett. 2000;317:517. [Google Scholar]
- 13.Wang H, Huff TB, Zweifel DA, He W, Low PS, Wei A, Cheng JX. Proc Natl Acad Sci USA. 2005;102:15752. doi: 10.1073/pnas.0504892102. [DOI] [PMC free article] [PubMed] [Google Scholar]
- 14.Zijlstra P, Chon JWM, Gu M. Nature. 2009;459:410. doi: 10.1038/nature08053. [DOI] [PubMed] [Google Scholar]
- 15.Durr NJ, Larson T, Smith DK, Korgel BA, Sokolov K, Ben-Yakar A. Nano Lett. 2007;7:941. doi: 10.1021/nl062962v. [DOI] [PMC free article] [PubMed] [Google Scholar]
- 16.Logunov SL, Ahmadi TS, El-Sayed MA, Khoury JT, Whetten RL. J Phys Chem B. 1997;101:3713. [Google Scholar]
- 17.Ohikta H, Cook S, Astuti Y, Duffy W, Tierney S, Zhang WM, Heeney M, McCulloch I, Nelson J, Bradley DDC, Durrant JR. J Am Chem Soc. 2008;130:3030. doi: 10.1021/ja076568q. [DOI] [PubMed] [Google Scholar]
- 18.Kimura Y, Alfano JC, Walhout PK, Barbara PF. J Phys Chem. 1994;98:3450. [Google Scholar]
- 19.Yoshihara T, Katoh R, Furube A, Tamaki Y, Murai M, Hara K, Murata S, Arakawa H, Tachiya M. J Phys Chem B. 2004;108:3817. [Google Scholar]
- 20.Tong L, Liu YX, Dolash BD, Jung Y, Slipchenko MN, Bergstrom DE, Cheng JX. Nat Nanotechnol. 2012;7:56. doi: 10.1038/nnano.2011.210. [DOI] [PubMed] [Google Scholar]
- 21.Chen T, Lu F, Streets AM, Fei P, Quan JM, Huang YY. Nanoscale. 2013;5:4701. doi: 10.1039/c3nr00308f. [DOI] [PubMed] [Google Scholar]
- 22.Freudiger CW, Min W, Saar BG, Lu SJ, Holtom GR, He CW, Tsai JC, Kang JX, Xie XS. Science. 2008;322:1857. doi: 10.1126/science.1165758. [DOI] [PMC free article] [PubMed] [Google Scholar]
- 23.Sayes CM, Fortner JD, Guo W, Lyon D, Boyd AM, Ausman KD, Tao YJ, Sitharaman B, Wilson LJ, Hughes JB, West JL, Colvin VL. Nano Lett. 2004;4:1881. [Google Scholar]
- 24.Debarre D, Supatto W, Pena AM, Fabre A, Tordjmann T, Combettes L, Schanne-Klein MC, Beaurepaire E. Nat Methods. 2006;3:47. doi: 10.1038/nmeth813. [DOI] [PubMed] [Google Scholar]
Associated Data
This section collects any data citations, data availability statements, or supplementary materials included in this article.


