Abstract
The present study aims to maximize the extraction of polyphenols from ginger (Zingiber officinale) through the statistical optimization of three influential process parameters ethanol (EtOH) proportion (%), temperature (°C) and extraction time (min). Response Surface Methodology (RSM) was employed to design experiments and study the interaction effects of these parameters on the extraction process. Analysis of Variance (ANOVA) was used for the analysis of regression coefficient, prediction of equation and case statistics. The optimum conditions for the maximum yield of polyphenols from each gram of ginger were found to be 75 % aqueous EtOH, 40 °C temperature and extraction time of 60 min respectively. The order of relative importance of these three parameters was: EtOH > time > temperature. Antioxidant activity of the extracted polyphenols using optimized parameters was also determined by DPPH assay. DPPH radical scavenging activity of ginger extract was compared with Vitamin C and butyl hydroxy toluene (BHT). Finally, this study revealed a cost effective analytical model to maximize the extraction of polyphenols from ginger with higher antioxidant activity. It was also concluded that at lower concentration ethanolic extract of ginger possess high antioxidant activity in comparison with synthetic antioxidants like vitamin C or BHT and thus it can be applicable as potent natural antioxidant in food and pharmaceutical industries for the preparation of functional food.
Keywords: Response surface methodology, Polyphenol, Antioxidant activity, Analysis of variance
Spices are known not only for their taste, aroma and flavour, but also for their medicinal value. Ginger (Zingiber officinale L.) is a very common and widely used spice in India for over 2,000 years (Bartley and Jacobs 2000). Apart from cooking, it is also used for some other purposes like ayurveda, candy, digestive juices and it is also used as relevant antiemetic to prevent vomiting, nausea etc. (Betz et al. 2005). Ginger is placed in the family Zingiberaceae (Schwertner and Rios 2007). Polyphenolic compounds, such as 6-gingerol and its derivatives obtained from the root of ginger possess high antioxidant activity (Stoilova et al. 2007). These polyphenolic compounds also posses several important properties like digestion promoting effect by exerting stimulating effect on peptic juices, such as gastric juice, bile, pancreatic and intestinal juices (Platel and Srinivasan 1996). Kim et al. (2005) reported that 6-gingerol of ginger also possesses anti-bacterial, anti-inflammatory, anti-tumor-promoting and anti-angiogenic activities. As a consequence of high antioxidant activity and other medicinal properties of the polyphenols present in ginger, it has gained much more attention among researchers (Park and Pezzuto 2002). Keeping in view of the usefulness and wider range of applicability in the pharmaceutical industry, it is very important to focus on its polyphenols content. Therefore the extraction of polyphenols is very crucial as it is the first step in the isolation of such compounds from plant materials.
Till date, solvent extraction is a widely employed technique designed to separate soluble polyphenols from plant tissue using a solvent. Commonly used solvents for extraction of polyphenols from plant tissue are water, ethanol, methanol, acetone etc. (Jakopic et al. 2009). Research work regarding extraction of polyphenols from various plant materials have been reported previously by many researchers (Anokwuru et al. 2011; Guerrero et al. 2008; Nawaz et al. 2008).
Considering the diversity of the sources of polyphenols in nature, as well as the structure and physicochemical properties (such as antioxidant activity) of these compounds, a universal extraction protocol cannot be applicable. Therefore, specific processes must be designed and process parameters should be optimized for extraction of polyphenolic compounds from each source (Escribano-Bailon and Santos-Buelga 2003; Pinelo et al. 2005). It is obvious that extraction of polyphenolic compounds from plant materials using optimized extraction method may play a vital role to minimize the overall process economics which will also improve the yield of polyphenols.
Many factors contribute to the efficacy of solvent extraction, such as type and concentration of solvent, pH, temperature, extraction time, particle size and shape of the plant matrix etc. (Derkyi et al. 2011). Implementation of process parameter optimization helps to ensure the effective extraction process. Moreover, co-extraction of undesirable compounds like carbohydrates (sugar), fats, terpenes or pigments, can be avoided by optimizing the extraction process of desired compounds.
RSM possesses several documented advantages in designing and performing experiments that aims to optimize an extraction process (Bas and Boyaci 2007; Myers and Montgomery 2002). It provides both mathematical and statistical techniques which are useful in modeling and analysis of problems (Anderson and Whitcomb 2005). Usually a response of interest or dependent variable that is influenced by several independent variables is subjected to optimize this response by determining the optimum process conditions (Rodriguez-Nogales et al. 2007; Roldán et al. 2008; Yasser et al. 2010). It also provides information’s regarding all possible interaction between variables whereas in conventional methods optimal conditions in extraction processes are determined by varying one parameter while keeping others as constant. As a result, conventional optimization methods are time consuming and cost ineffective (Ranjan et al. 2009; Rodriguez-Nogales et al. 2007).
The present study illustrates optimization of process parameters for the maximum possible extraction of polyphenols from ginger and determination of antioxidant activity of extracted polyphenols. The main emphasis was given on the development of extraction method to maximize the total polyphenols (TP) content or actual TP in the extract through the optimization of three influential process parameters (solvent, extraction time and temperature) by Response Surface Methodology (RSM). Antioxidant activity of the extracted polyphenols was determined using DPPH method in order to test the correlation between the TP content and antioxidant activity.
Materials and methods
Plant material
Roots of ginger (Zingiber officinale L.) were used for the present study. Those were washed repeatedly and air dried at room temperature. Finally, the dried samples were grounded to prepare powder.
Chemicals and software
Ethanol and Folin-Ciocalteu reagents were purchased from Merck (Darmstadt, Germany). Gallic acid was obtained from Sisco research laboratory (India). 2, 2-diphenyl-1-picryl hydrazyl radical (DPPH) was purchased from Sigma Chemical Co. (St., Louis, USA). Vitamin C and butyl hydroxy toluene (BHT) from Sigma (Sigma-Aldrich GmbH, Sternheim, Germany). All the chemicals used were of analytical grade commercially available in India.
The statistical software package Design Expert 7.0 (Stat-Ease Inc., Minneapolis, USA) was used to design the experiment and the regression analysis of the experimental data.
Selection of relevant variables and design of experiment
The RSM used a three-factor and Central Composite Design (CCD) consisting of 20 experimental runs. The design variables i.e. process parameters were ethanol proportion (EtOH: H2O, 25–75 %, v:v; A), temperature (20–40 °C; B) and extraction time (20–60 min; C). The only dependent variable, total polyphenols (TP), was selected as response. Each variable had two levels as −1 and +1. A total of 20 assays of experiments were performed to determine significant factors for the extraction of polyphenols. All RSM generated experimental runs along with response were shown in Table 1. The effects of unexplained variability in the observed response due to extraneous factors were minimized by randomizing the order of experiments. Multiple linear regression analysis was performed. Experimental data were fitted to the second-order polynomial model.
Table 1.
CCD experimental design matrix and results for three parameters with actual Total Polyphenol (TP)
| Factor 1 | Factor 2 | Factor 3 | Response | |
|---|---|---|---|---|
| Run | A:EtOH (%) | B:Temp (°C) | C:Time (min) | Actual TP (mg GAE/g DM) |
| 1 | 25 | 20 | 20 | 3.5 |
| 2 | 75 | 20 | 60 | 14.99 |
| 3 | 7.9551792 | 30 | 40 | 0.942 |
| 4 | 50 | 46.8179283 | 40 | 8.013 |
| 5 | 50 | 13.1820717 | 40 | 5.526 |
| 6 | 25 | 20 | 60 | 4.544 |
| 7 | 50 | 30 | 73.6358566 | 8.849 |
| 8 | 25 | 40 | 60 | 6.123 |
| 9 | 75 | 40 | 60 | 16.957 |
| 10 | 50 | 30 | 40 | 7.228 |
| 11 | 92.044821 | 30 | 40 | 18.942 |
| 12 | 50 | 30 | 6.36414339 | 6.735 |
| 13 | 50 | 30 | 40 | 7.389 |
| 14 | 25 | 40 | 20 | 4.953 |
| 15 | 50 | 30 | 40 | 7.277 |
| 16 | 50 | 30 | 40 | 7.391 |
| 17 | 50 | 30 | 40 | 7.351 |
| 18 | 50 | 30 | 40 | 7.375 |
| 19 | 75 | 20 | 20 | 11.04 |
| 20 | 75 | 40 | 20 | 11.6 |
EtOH Ethanol; TP Total Polyphenol; mg GAE/g DM mg of Gallic Acid Equivalents/ g of Dry Matter
In which Y is the predicted response, Xi, Xj are independent variables, βo is the intercept term, βi is the linear coefficient, βii is the quadratic coefficient, and βij is the interaction coefficient. The independent process variables were coded as A (solvent: EtOH), B (extraction temperature) and C (extraction time). Thus, the second order polynomial equation can be represented as follows-
 |
1 |
Extraction procedure
Powdered of ginger roots air-dried in hot air oven at 40–45 deg C were blended separately with different percentage of aqueous EtOH and extracted in different time with continuous stirring as designed by RSM. After completion of each extraction, each mixture was centrifuged at 18,000 rpm for 30 min and supernatant was collected as crude extract of polyphenols.
Determination of actual total polyphenols (TP)
The actual TP of each extract was determined using Folin-Ciocalteu reagents with analytical grade gallic acid as standard using the method of Singleton and Rossi (1965). 1.0 ml of extract or standard solutions (0–500 mg/l) was added to 10 ml deionized water and 1.0 ml of Folin-Ciocalteu phenol reagents. After 5 min, 2.0 ml of 20 % Sodium Carbonate was added to the mixture. After 1 h incubation in darkroom, absorbance of each sample was recorded at 750 nm. The yield of total Polyphenols was expressed as mg of gallic acid equivalents (GAE) per gram of dry matter (DM). All the experiments were carried out in triplicates.
Evaluation of antioxidant activity
The radical scavenging activity of extracted polyphenolic compounds from ginger was determined by DPPH assay method previously described by Mensor et al. (2001). Briefly, 1.0 ml from 0.3 mM ethanolic solution of DPPH was added to 2.5 ml from the samples with different concentrations of ginger extract. The samples were kept at room temperature in the dark and after 30 min the optical density was measured at 518 nm. The antiradical activity (AA) was determined by the following formula:
 |
Where empty samples: 1.0 ml ethanol + 2.5 ml from various concentrations of ginger extract; control sample: 1.0 ml 0.3 mM DPPH + 2.5 ml ethanol.
The optical density of the samples, the control and the empty samples were measured in comparison with ethanol. Two synthetic antioxidants, butyl hydroxy toluene (BHT) and Vitamin C were used as positive control.
Results and discussion
Fitting the model
The experimental results of the RSM were fitted via a second-order polynomial regression equation. A quadratic model was selected for the analysis. The adequacy and significance of the regression model was tested using ANOVA method. Test for significance on individual model coefficients and test for lack-of-fit were also estimated. The insignificant model terms can be eliminated to improve the model without counting those required to support hierarchy. In this study, backward elimination procedure was employed to automatically reduced the terms that are not significant. The final reduced model is given in Table 2.
Table 2.
ANOVA table for response surface quadratic model
| Source | Sum of squares | df | Mean square | F value | P-value Prob > F | |
|---|---|---|---|---|---|---|
| Model | 363.992 | 5 | 72.7983241 | 95.27453 | < 0.0001 | significant |
| A-EtOH (%) | 316.446 | 1 | 316.4456225 | 414.14701 | < 0.0001 | |
| B-Temp (°C) | 6.94883 | 1 | 6.94882837 | 9.0942527 | 0.0093 | |
| C-Time (min) | 16.6433 | 1 | 16.64330016 | 21.781856 | 0.0004 | |
| AC | 6.28883 | 1 | 6.288831125 | 8.2304838 | 0.0124 | |
| A2 | 17.665 | 1 | 17.6650383 | 23.119052 | 0.0003 | |
| Residual | 10.6973 | 14 | 0.76409009 | |||
| Lack of Fit | 10.6745 | 9 | 1.186060047 | 261.00716 | < 0.0001 | Significant |
| Pure Error | 0.02272 | 5 | 0.004544167 | |||
| Cor Total | 374.689 | 19 | ||||
| Std. Dev. | 0.87412 | R-squared | 0.9714503 | |||
| Mean | 8.33625 | Adj R-squared | 0.961254 | |||
| C.V. % | 10.4858 | Pred R-squared | 0.9084996 | |||
| PRESS | 34.2842 | Adeq precision | 33.817678 |
Df Degrees of freedom, F Fisher variance ratio, p Probability, C.V. Coefficient of variation
The Model F-value of 95.27 implies the model is significant. There is only a 0.01 % chance that a “Model F-Value” this large could occur due to noise. Values of “Prob > F” less than 0.0500 indicate model terms are significant. In this case A, B, C, AC and A2 are significant model terms.
The model shows standard deviation (SD), mean, coefficient of variation % (C.V %) and predicted residual sum of squares (PRESS) value of 0.874122, 8.33625, 10.4858, and 34.28419 respectively. A correlation coefficient (R2) of 0.97145 was obtained indicating high degree of correlation between the variables and total yield of polyphenols. The “Pred R-Squared” of 0.9085 is in reasonable agreement with the “Adj R-Squared” of 0.96125. “Adeq Precision” ratio of the this model has been calculated as 33.817 which is a good signal (as it is greater than 4) and can be used to navigate the design space.
The following equations are the final empirical models in terms of coded and actual factors:
- Final Equation in Terms of Coded Factors:

2 - Final Equation in Terms of Actual Factors:

3
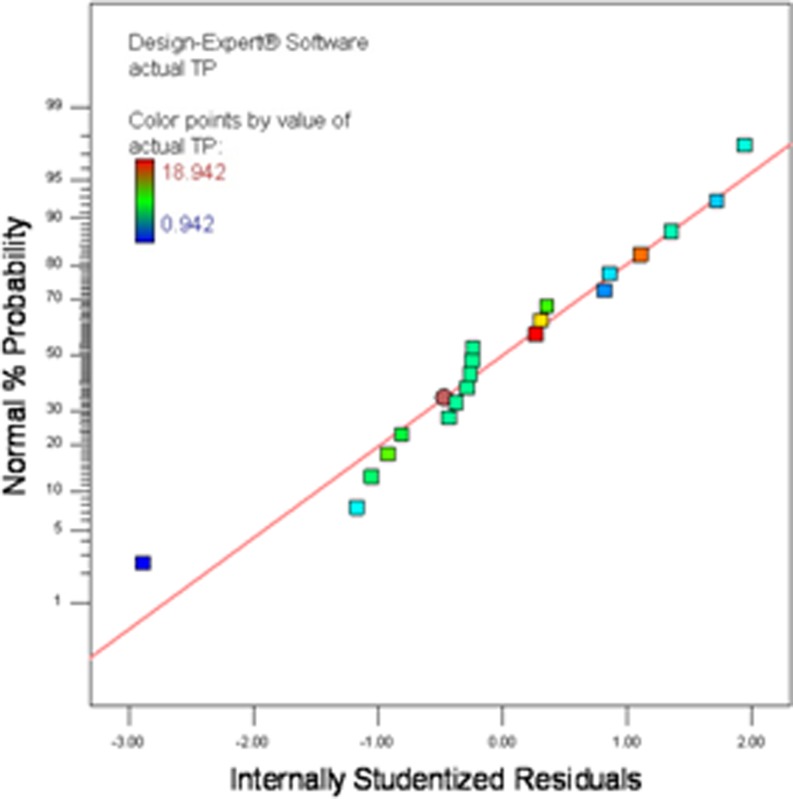
The normal probability plot as depicted in Fig. 1, showed some scatter along the line, indicating that the residuals follow a normal distribution which demonstrate that the model satifies the assumptions of the ANOVA which designated the accuracy and applicability of RSM in optimizing all three parameters for extraction of polyphenols from ginger.
Fig. 1.
Normal plot of residuals for actual TP (mg GAE/g DM) from ginger
Effect of independent variables on extraction of polyphenols
Diagnostics Plots and model graphs were obtained using the Design Expert software to analyze the effects of variables individually and its interaction to determine their optimum level. The point prediction method was used for optimization of the levels of each variable for maximum response.
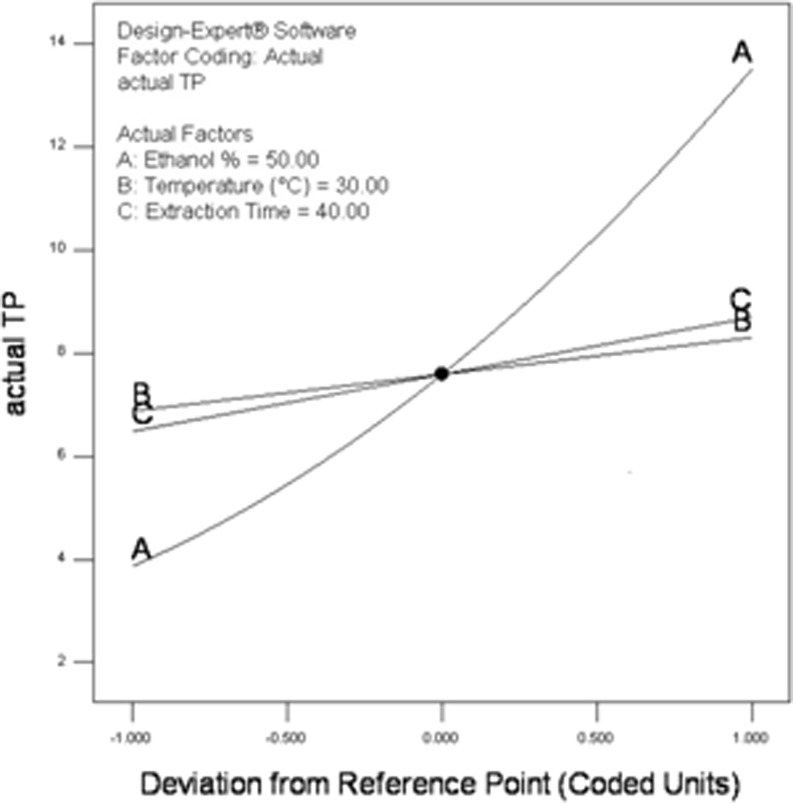
As shown in Fig. 2, perturbation plot described the comparative effect of all the experimental variables at the midpoint (coded 0.00) in the design space. A curvature with EtOH (%), temperature and time shows that all these factors exert different degree of effects on the response i.e. actual total polyphenols (TP). But, the curve with the most prominent change was the perturbation curve of variable A i.e. EtOH compared to those of the other two factors fixed at their maximum levels. Thus, it is evident that concentration of EtOH significantly contributed to the extraction of polyphenols and had the most pronounced quadratic effect.
Fig. 2.
Perturbation plot of actual total polyphenols (TP) of ginger as a function of a EtOH proportion, b temperature and c extraction time
Direct effects of variables
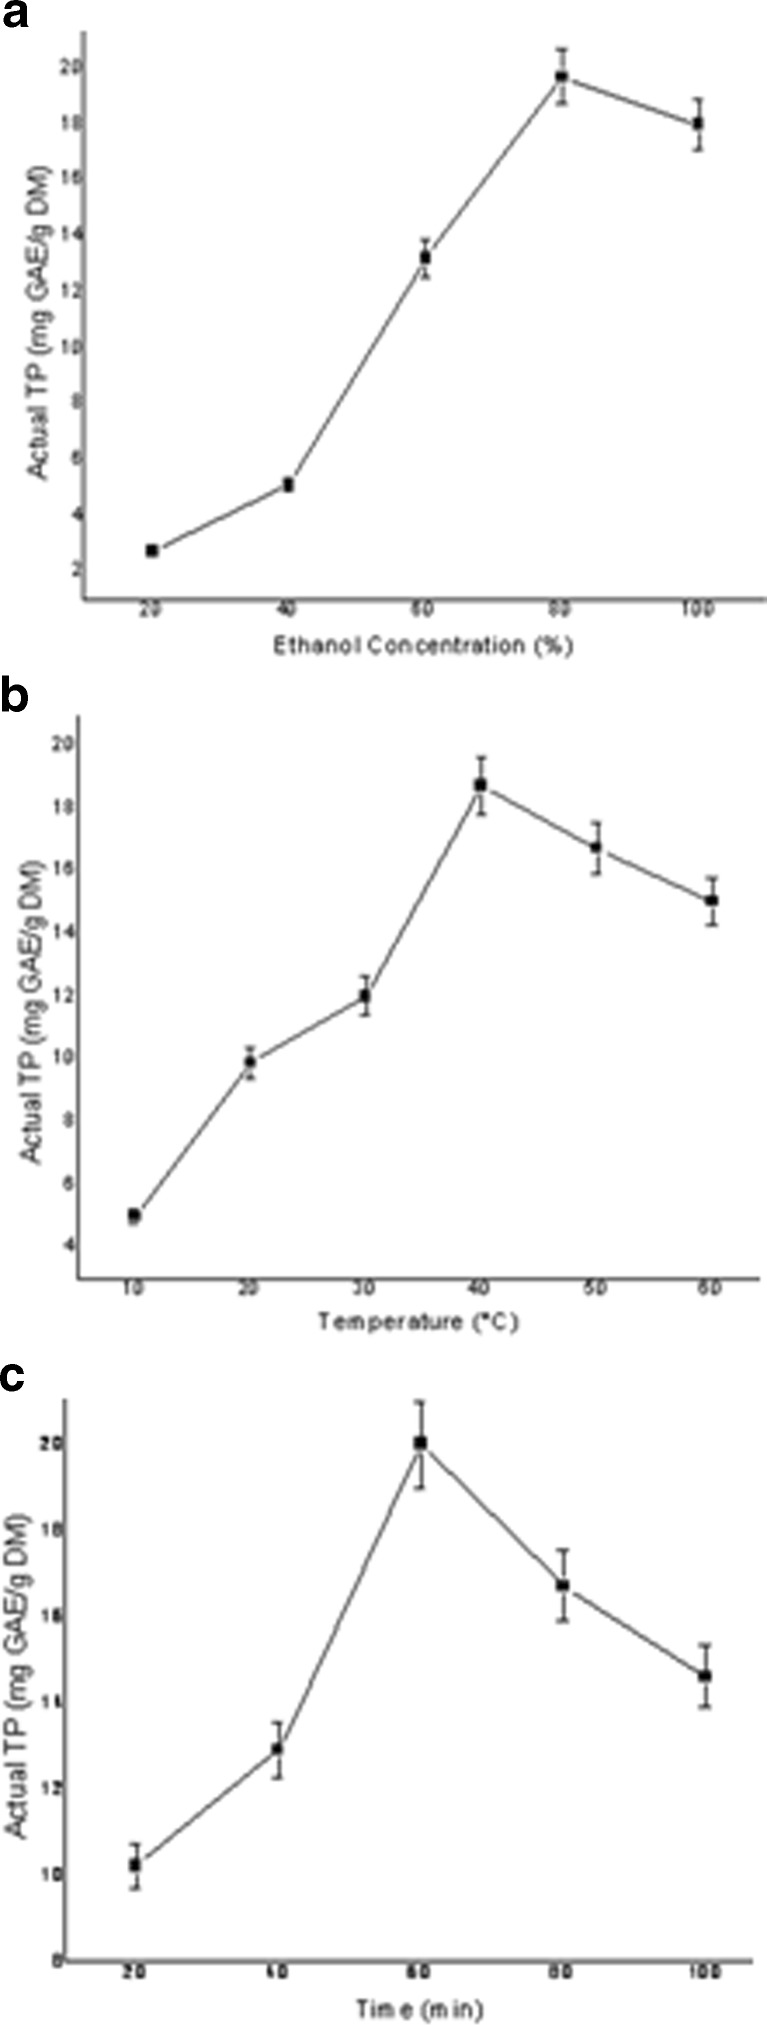
It can be derived from Fig. 3a that EtOH concentration (%) plays a predominant role for the extraction of polyphenols as TP value significantly increased with the increase in EtOH concentration. This is due to the fact that high concentration of ethanol can cause denaturation of proteins, preventing the dissolution of polyphenols and thus influencing the rate of polyphenol extraction (Yang et al. 2009).
Fig. 3.
Direct effects of a EtOH proportion, b temperature and c time on extraction of total polyphenols (TP) of ginger
Increase of extraction temperature increases the extraction rate of polyphenols as described in Fig. 3b. High-temperature solvent can promote polysaccharides on cell wall to distribute to solvent and to weaken the integrity of the cell wall (Yang et al. 2009). But, the polyphenol yield reduces if the extraction has been carried out above 50–55 °C because it causes loss of solvent and promotes oxidation of polyphenols.
It is obvious that longer extraction time prolongs the interaction between extraction medium (aqueous EtOH) and ginger. Although longer extraction time facilitates better extraction, it also increases the chance of oxidation of polyphenols. In this study the value of actual TP increases with extraction time up to 60 min (Fig. 3c).
Interaction effect of variables
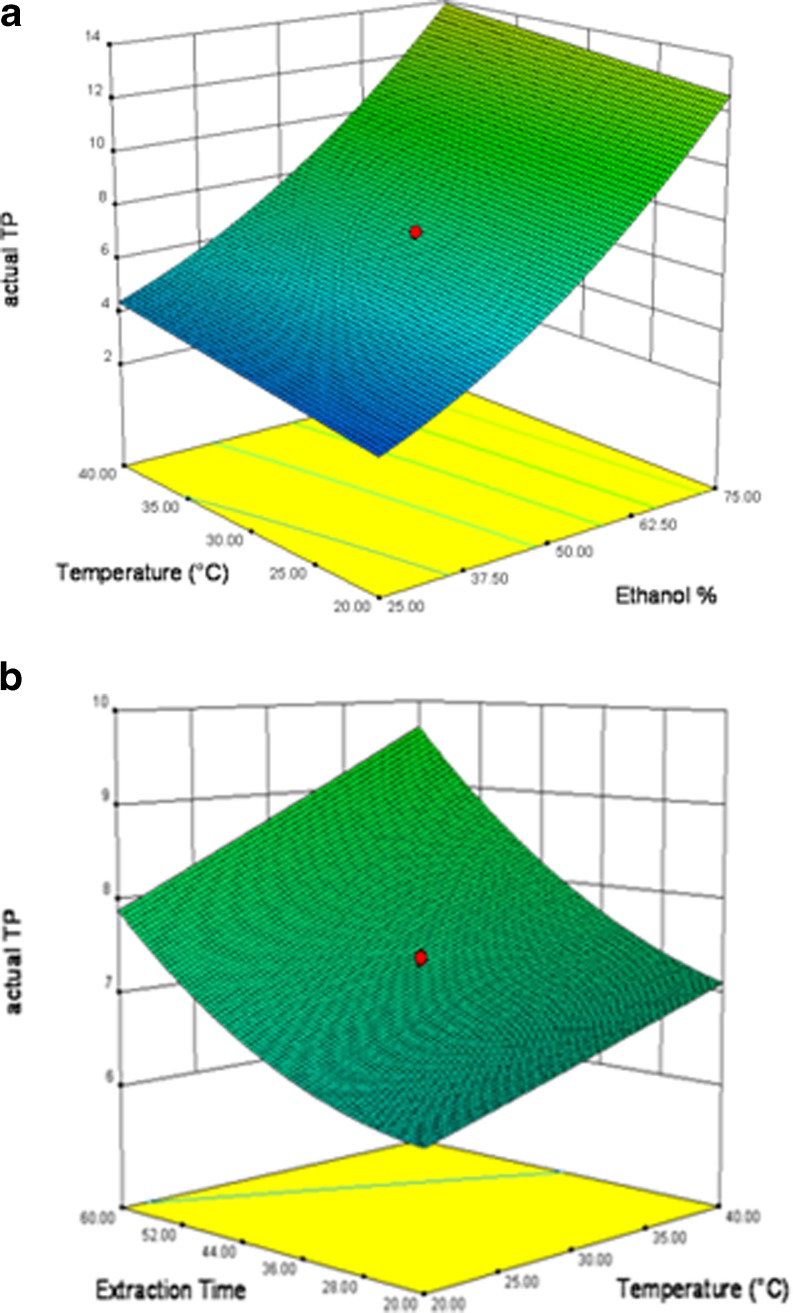
As given in Fig. 4a, the 3D response surface plot obtained from RSM study shows the combined effect of EtOH concentration and extraction temperature on the actual TP when extraction time was kept constant (40 min). Increase of both EtOH concentration and extraction temperature increases the value of actual TP and it is evident from the Fig. 4a that the effect of EtOH concentration is more significant than that of extraction temperature. When EtOH proportion was kept as constant (50 %), value of actual TP also increases with the increase of extraction time and temperature (Fig. 4b). These data were consistent with the conclusion of direct effect of these variables. The order of relative importance of these three parameters was found as: EtOH > time > temperature. Therefore ethanol concentration, extraction temperature and time would have independent optimum condition parameters.
Fig. 4.
Combined effect of a EtOH and temperature and b time and temperature on extraction of polyphenols of ginger
Optimization of extraction condition and validation of model
Optimum conditions for the extraction of polyphenols from ginger depend on solvent composition, extraction temperature and extraction time course were obtained using the predictive equations of RSM. The process conditions were set to search the optimum desirability of the response i.e., the maximum yield of actual TP.
In the present study, desirability function optimization of the RSM has been employed for the optimization of the extraction of polyphenols by means of dependent variable or response which is actual TP in mg of gallic acid equivalents (GAE) per gram of dry matter (DM). The optimization module searches a combination of factor levels that simultaneously satisfies the requirements placed on the response and factors in an attempt to establish the appropriate model. The aim of this study was to find the optimum values of extraction parameters in order to maximize the values of actual TP. For maximizing actual TP, all other parameters have been kept in range and the desirability based optimization has been employed. The optimum solutions are reported in Table 3. From RSM generated model, the optimum experimental conditions required for maximum yield of polyphenols (in terms of actual TP) from each gram of ginger were found to be 75 % ethanol, 40 °C temperature and extraction time of 60 min respectively. The desirability of this optimization model is 84.77 % which is acceptable.
Table 3.
Optimization result for maximization of actual TP (Total Polyphenol)
| Solutions | ||||||
|---|---|---|---|---|---|---|
| Number | EtOH (%) | Temp (°C) | Time (min) | Actual TP | Desirability | |
| 1 | 75.00 | 40.00 | 60.00 | 16.2017 | 0.847763837 | Selected |
| 2 | 75.00 | 39.59 | 60.00 | 16.1722 | 0.846124771 | |
| 3 | 75.00 | 40.00 | 59.70 | 16.1721 | 0.846116296 | |
| 4 | 75.00 | 39.14 | 60.00 | 16.1405 | 0.844360834 | |
| 5 | 74.78 | 40.00 | 60.00 | 16.1326 | 0.843920912 | |
| 6 | 75.00 | 38.81 | 60.00 | 16.1169 | 0.843051034 | |
| 7 | 75.00 | 38.54 | 60.00 | 16.0972 | 0.841958264 | |
| 8 | 75.00 | 40.00 | 58.73 | 16.0753 | 0.8407414 | |
| 9 | 75.00 | 37.45 | 60.00 | 16.0198 | 0.837655174 | |
| 10 | 74.40 | 40.00 | 60.00 | 16.0115 | 0.837195792 | |
| 11 | 75.00 | 40.00 | 57.47 | 15.9496 | 0.833755342 | |
| 12 | 75.00 | 34.56 | 60.00 | 15.8135 | 0.826195649 | |
| 13 | 75.00 | 31.44 | 60.00 | 15.5913 | 0.813851368 | |
| 14 | 75.00 | 30.16 | 60.00 | 15.4999 | 0.808771436 | |
| 15 | 75.00 | 39.95 | 51.75 | 15.3773 | 0.801959174 | |
The verification of the validity and adequacy of the predictive extraction model was realized in these optimum conditions of solvent composition, temperature and time of contact. Actual TP was determined after extraction of polyphenolic compounds under the aforesaid conditions. The experimental and predicted values were compared in order to determine the validity of the model. A total of six experiments were carried out to check the validity of the model. As summarized in Table 4, experimental values were reasonably close to the predicted values indicating the validity and adequacy of the predicted models. Moreover, the validation experiments also proved that the predicted values of actual TP could be satisfactorily achieved within 3.48 % of predicted error of experimental values.
Table 4.
Validation of the final reduced quadratic model
| Parameters | Run 1 | Run 2 | Run 3 | Run 4 | Run 5 | Run 6 |
|---|---|---|---|---|---|---|
| A: EtOH (%) | 15 | 20 | 30 | 40 | 95 | 97 |
| B:Temperature (°C) | 15 | 30 | 50 | 70 | 80 | 90 |
| C:Time (mins) | 15 | 30 | 60 | 90 | 120 | 180 |
| Predicted response | 2.106 | 4.438 | 6.274 | 10.59 | 34.2 | 44.25 |
| Actual response | 2.18 | 4.38 | 6.4 | 10.9 | 33.8 | 43.25 |
| Predicted error (%) | 3.48 | 1.31 | 1.99 | 2.95 | 1.22 | 2.25 |
Antioxidant activity of polyphenols
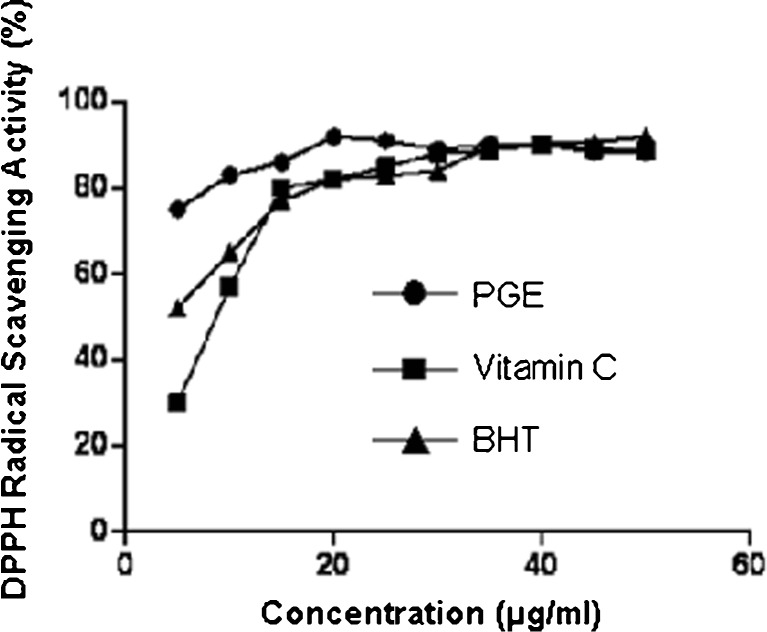
The polyphenolic compound obtained from ginger using optimized extraction parameters showed significant inhibitory effect on DPPH. DPPH is a stable free radical which can accept an electron or hydrogen to become a stable molecule. It is clearly seen from Fig. 5, that if the concentration increases, the scavenging effect of polyphenols from ginger extract (PGE) on DPPH is higher than commercially available antioxidants like Vitamin C and BHT. This indicated that aqueous-ethanolic extract of ginger containing significant amount of polyphenols with strong DPPH radical-scavenging activity and therefore ginger extract is enriched with antioxidants. So, the ginger extract with optimum polyphenols content may be considered as a better natural antioxidant in food industry.
Fig. 5.
Comparative scavenging effect of polyphenols in ginger extract (*PGE), vitamin C and BHT on DPPH radical
Conclusion
In conclusion, the root of Zingiber officinale is rich in polyphenols. The performance of the extraction of polyphenols from root of Zingiber officinale was studied using response surface methodology. The conclusions can be drawn that among the three parameters studied, ethanol concentration had the most significant effect on the extraction rate of polyphenols. According to the mathematical modeling for parameters optimization analysis, the optimal conditions were: ethanol concentration 75 %, extraction temperature 40 °C, and extraction time 60 min respectively. This extraction method requires low instrumental facility and provide higher yield of polyphenols. Therefore the research on extraction, purification and characterization of polyphenols from root of ginger will help to improve the ginger resource. The antioxidant activity of ginger is also very much dependent on its total polyphenols content. Therefore, ginger extract can efficiently substitute synthetic antioxidants like vitamin C or BHT and it can also be applicable as potent natural antioxidant in food and pharmaceutical industries for the preparation functional food.
Acknowledgement
The authors would like to express their gratitude to Prof. (Dr.) Gautam Biswas, Director, CSIR-Central Mechanical Engineering Research Institute for his kind permission to publish the paper. The authors are also grateful to Council of Scientific and Industrial Research, Govt. of India for the financial support. The help rendered by our scientific and technical staffs of CAMP, CSIR-CMERI, Durgapur is acknowledged. Sincere thanks to Mr. Dipanjan Sengupta and Mr. Sanjeeb Sutradhar for their support during the preparation of this manuscript.
References
- Anderson MJ, Whitcomb PJ. RSM simplified: Optimizing processes using response surface methods for design of experiments. New York: Productivity Press; 2005. pp. 123–133. [Google Scholar]
- Anokwuru CP, Esiaba I, Ajbaye O, Adesuyi AO. Polyphenolic content and antioxidant activity of Hibiscus sabdariffa. Calyx Res J Med Plant. 2011;5:557–566. doi: 10.3923/rjmp.2011.557.566. [DOI] [Google Scholar]
- Bartley J, Jacobs A. Effects of drying on flavor compounds in Australian-grown ginger (Zingiber officinale) J Sci Food Agric. 2000;80:209–215. doi: 10.1002/(SICI)1097-0010(20000115)80:2<209::AID-JSFA516>3.0.CO;2-8. [DOI] [Google Scholar]
- Bas D, Boyaci IH. Modeling and optimization I: usability of response surface methodology. J Food Eng. 2007;78:836–845. doi: 10.1016/j.jfoodeng.2005.11.024. [DOI] [Google Scholar]
- Betz O, Kranke P, Geldner G, Wulf H, Eberhart LH. Is ginger a clinically relevant antiemetic? A systematic review of randomized controlled trials. Forsch Komplementarmed Klass Naturheilkd. 2005;12:14–23. doi: 10.1159/000082536. [DOI] [PubMed] [Google Scholar]
- Derkyi SA, Adu-Amankwa B, Sekyere D, Darkwa A. Optimization of process parameters using response surface methodology for the extraction of formaldehyde-condensable phenolics from pine bark. J Emerg Trends Eng Appl Sci. 2011;2:64–69. [Google Scholar]
- Escribano-Bailon MT, Santos-Buelga C. Methods in polyphenol analysis. United Kingdom: The Royal Society of Chemistry; 2003. [Google Scholar]
- Guerrero MS, Torres JS, Nunez MJ. Extraction of polyphenols from white distilled grape pomace: optimization and modeling. Bioresour Technol. 2008;99:1311–1318. doi: 10.1016/j.biortech.2007.02.009. [DOI] [PubMed] [Google Scholar]
- Jakopic J, Veberic R, Stampar F. Extraction of phenolic compounds from green walnuts fruits in different solvents. Acta Agric Slov. 2009;93:11–15. [Google Scholar]
- Kim E, Min J, Kim T, Lee S, Yang H, Han S. Gingerol, a pungent ingredient of ginger, inhibits angiogenesis in vitro and in vivo. Biochem Biophys Res Commun. 2005;335:300–308. doi: 10.1016/j.bbrc.2005.07.076. [DOI] [PubMed] [Google Scholar]
- Mensor LL, Menezes FS, Leitao GG, Reis AS, Dos Santos TC, Coube CS, Kitao SG. Screening of Brazilian plant extracts for antioxidant activity by the use of DPPH free radical method. Phytother Res. 2001;15:127–130. doi: 10.1002/ptr.687. [DOI] [PubMed] [Google Scholar]
- Myers RH, Montgomery DC. Response surface methodology: Process and product optimization using designed experiments. 2. New York: Wiley; 2002. [Google Scholar]
- Nawaz H, Shi J, Mittal GS, Kakuda Y. Extraction of polyphenols from grape seeds and concentration by ultrafiltration. Sep Purif Technol. 2008;48:176–181. doi: 10.1016/j.seppur.2005.07.006. [DOI] [Google Scholar]
- Park EJ, Pezzuto JM. Botanicals in cancer chemoprevention. Cancer Metastasis Rev. 2002;21:231–255. doi: 10.1023/A:1021254725842. [DOI] [PubMed] [Google Scholar]
- Pinelo M, Rubilar M, Jerez M, Sineiro J, Núñez MJ. Effect of solvent, temperature, and solvent-to-solid ratio on the total phenolic content and antiradical activity of extracts from different components of grape pomace. J Agric Food Chem. 2005;53:2111–2117. doi: 10.1021/jf0488110. [DOI] [PubMed] [Google Scholar]
- Platel K, Srinivasan K. Influence of dietary spices or their active principles on digestive enzymes of small intestinal mucosa in rats. Int J Food Sci Nutr. 1996;47:55–59. doi: 10.3109/09637489609028561. [DOI] [PubMed] [Google Scholar]
- Ranjan D, Srivastava P, Talat M, Hasan SH. Biosorption of Arsenic from aqueous solution using agricultural residue “rice polish”. J Hazard Mater. 2009;166:1050–1059. doi: 10.1016/j.jhazmat.2008.12.013. [DOI] [PubMed] [Google Scholar]
- Rodriguez-Nogales JM, Ortega N, Perez-Mateos M, Busto MD. Experimental design and response surface modeling applied for the optimization of pectin hydrolysis by enzymes from A. niger CECT 2088. Food Chem. 2007;101:634–642. doi: 10.1016/j.foodchem.2006.01.055. [DOI] [Google Scholar]
- Roldán E, Sánchez-Moreno C, De Ancos B, Cano MP. Characterization of onion (Allium cepa L.) by-products as food ingredients with antioxidant and antibrowning properties. Food Chem. 2008;108:907–916. doi: 10.1016/j.foodchem.2007.11.058. [DOI] [PubMed] [Google Scholar]
- Schwertner HA, Rios DC. High-performance liquid chromatographic analysis of 6-gingerol, 8-gingerol, 10-gingerol and 6-shogaol in ginger-containing dietary supplements, spices, teas and bevarages. J Chromatogr B. 2007;856:41–47. doi: 10.1016/j.jchromb.2007.05.011. [DOI] [PubMed] [Google Scholar]
- Singleton VL, Rossi JAJR. Colorimetry of total phenolics with phosphomolybdic-phosphotungstic acid reagent. Am J Enol Vitic. 1965;16:144–158. [Google Scholar]
- Stoilova I, Krastanov A, Stoyanova A, Denev P, Gargova S. Antioxidant activities of a ginger extract (Zingiber officinale) Food Chem. 2007;102:764–770. doi: 10.1016/j.foodchem.2006.06.023. [DOI] [Google Scholar]
- Yang L, Jiang J, Li W, Chen J, Wang D, Zhu L. Optimum extraction process of polyphenols from the bark of Phyllanthus emblica L. based on the response surface methodology. J Sep Sci. 2009;32:1437–1444. doi: 10.1002/jssc.200800744. [DOI] [PubMed] [Google Scholar]
- Yasser FM, Kishk, Hemat E, Sheshetawy EI. Optimization of ginger (Zingiber offcinale) phenolics extraction conditions and its antioxidant and radical scavenging activities using response surface methodology. World J Dairy Food Sci. 2010;5(2):188–196. [Google Scholar]


