

Abstract
A portable infrared spectroscopy system has been designed and developed for assessment of quality of mango fruit. This paper describes the design and development of a fruit quality grading device using reflectance mode optical sensor. The experiment was conducted to obtain the best results from the system and the device was correlated according to the measured output. In the experiment, several samples of mango fruits have been monitored for six days to study the relation how fruit quality increases with time as fruit ripens. Between the unripe mango fruit and the ripest one, a range of 3.5 V to 4.2 V was measured by the developed system. The rate of quality increase was calculated as an average of 6.7 mV per day. These results were used to correlate the final hardware and software development of the device. The results demonstrate that, portable near infrared spectroscopy is feasible for evaluating mango quality non-destructively.
Keywords: Automatic sorting of fruits, NIR spectroscopy, Nondestructive technique, Mango quality, Post harvest assessment
Introduction
Fruits have abundant nutritional components that are necessary to human and significantly protect for health. Eating different species of fruits and vegetables gives a wide range of valuable nutrients to the human body, like fiber, potassium, and vitamins. High quality fruit also reduces the risk of several chronic diseases such as perhaps heart disease, high blood pressure and some types of cancer.
Mango is one of the most highly nutritious fruit containing carbohydrates, proteins, fats, minerals, and vitamins. As mango fruit ripens, the concentrations of glucose, fructose, and sucrose increase while vitamin C concentration decreases. Comparing to sour and greenish immature mango, mature mango turns to yellow with a very sweet taste as it ripens. The recent studies recorded over 1,000 known mango cultivars with different shapes and sizes (Bally 2006). In some countries, where fruits such as mango are part of their daily food and market, fruit industries tend to do more researches about the quality determination technology of fruits while consumers also begin to pay more attention on fruit quality. Consumers start looking for the trust marks and superiority seals with confirmation of selling only the healthful fruit (Lin and Ying 2009). Fruit market value, transportation, and storage requirements are all affected by its quality. The quality of fruit can be classified into two common groups named as external and internal components. Internal quality may include texture, flavor, nutrition value and defect factors. Other factors such as size, shape, and color are generally recognized as external quality factors (Choi et al. 2011). Several techniques and methods have been tried for assessing the internal quality of fruit; however, most of these implemented techniques are still invasive which requires much labor and time consumption. Recent researches have studied a faster and simpler method for quality assessment of fruit using optical spectroscopy technology. Near infrared [NIR, (750–2500 nm)] spectroscopy shows the best results among the other ranges of the magnetic spectrum. As the first application of NIRS in agricultural products was tried early at 1950s (Lin and Ying 2009). In 1990, first commercial application of NIRS to fruit sorting was initiated in Japan (Fan et al. 2009). Since that day, NIRS has been considered as a prominent technique for assessing of fruit quality non-invasively. Soluble solids content and firmness of several types of fruit including mango, apple, banana and other fruits and vegetables were studied and evaluated using near infrared spectroscopy (NIRS) (Fan et al. 2009; Antihus et al. 2006; Liew and Lau 2012; Tian et al. 2007; Moghimi et al. 2010; Carlini et al. 2000).
The advanced researches have investigated on choosing the optimum optical spectrum for fruit evaluation, their results have proposed the use of near infrared spectroscopy for the fruit and vegetables quality assessment because of its highly accurate measurements that provides a brief and rich summary of the overall biochemical components of the sample (Fairuz and Zubir 2009). The aim of this study is to design a technique based on infrared optical technology for fruit quality assessment, and to develop and fabricate a low coast, friendly use, portable instrument for assessment of quality of mango nondestructively.
Materials and methods
Process of fruit quality characterization
The process of fruit characterization starts by having an unripe fruit sample for testing, in which mango sample is used for this project. Preprocessing, such as hardware and software design and testing is necessary to ensure effective results. Once hardware and software is ready for use, voltage is applied across the system to lunch the infrared optical power generated by the light source NIR emitter diode. While fruit is placed in contact with the infrared optical transmitter, infrared optical power light is transmitted though the fruit texture to the receiver circuit which based on photo-detector to detect the infrared optical power light and to convert it into an electrical signal. The received infrared optical signal is detected by the photo detector and converted to voltage to be amplified to a high output signal using an amplifier. The received signal is then interfaced with a microcontroller to be measured and displayed on the LCD. The process of fruit characterization is shown in Fig. 1.
Fig. 1.

Frame of the experimental approaches
Hardware design
The fruit quality assessment schematic diagram includes four main stages is shown in Fig. 2. The four main stages are called, the power supply, optical sensor and amplification, microcontroller and output display stage. The main task of the power supply is to provide a power of five volts to the system. The optical sensor is the input of the system; it extracts the reflected signal using a transmitter and receiver sensors and feeds to the amplifier section to strengthen the signal. The microcontroller is the brain of the whole system. It receives the amplified signal from the sensor stage, measures the received voltage and correlates the data received with the quality percentage, and then sends the result to output. Display stage of the system forms the output and the interface for the user.
Fig. 2.
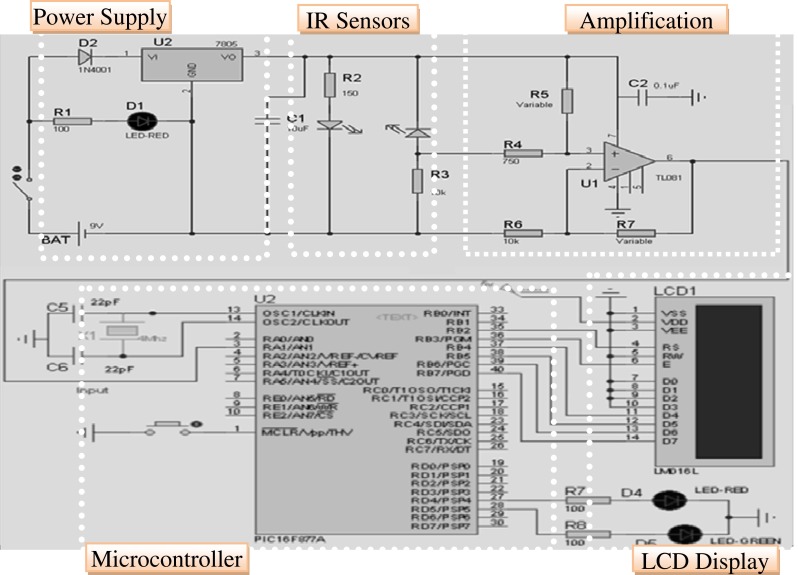
Circuit schematic diagram for fruit quality assessment
Voltage regulator
A voltage regulator, LM7805 is connected to a battery or an external power supply to get a regulated output voltage of 5 V. To convert the alternating current (AC) to direct current (DC), allowing current to flow in only one direction, and to prevent any reverse voltage, a rectifier diode, 1 N4001 is connected between the power supply and the input leg of the voltage regulator. The sharp current spike and other noise effect can be made smooth using the electrolytic capacitor added between the regulated output voltage and ground. In general, the device is designed to work using a direct connection to external power supply or by using an internal 9 V battery.
Optical sensor
In general, several types of optical instruments have been developed for nondestructive measurement of the internal composition of fruits. The need of effective optical sensor would require the designer to consider the type of fruit to assess and its size. The thickness of its skin and the specific attributes to be tested should be considered as well. Different types of fruit require specific design configuration including the choice of using reflectance or transmittance mode. For assessing small fruit such as grape or any other small translucent fruits, the system is better designed using whole fruit light transmission techniques for better non-destructive optical measurements. However, for other fruits, like mango, the size and the optical density of the fruit make whole fruit transmission measurements impractical and reflectance measurement method is recommended to be implemented. Because of these limitations in the transmittance mode, the reflectance mode is implemented for the circuit design in this study.
Using the reflectance sensor, when a transmitter emits IR beam, the photo-detector picks up the modulated IR beam reflected from the sample and produces a varying current. This current represents the quality of the sample and it varies between zero and 12 mA with respect to each sample. This signal is then converted to a voltage signal that ranges between 4.4 V, when no sample is placed in touch with the sensor and then it drops to 0.26 V once the sample is facing the sensors. Two resistors should be also connected in series with the bath of the sensors to limit the current going through the sensors. The values of the resistors and the configuration design are shown in Fig. 2 and it is made in such a way to get better output signal detection.
Amplifier design
The diagram in Fig. 3 illustrates the amplification stage design of the circuit. Positive feedback TL081 is implemented in this design. The output weak signal received from the sensor phase is to be enhanced before reaching the amplifier input. A combination of series and parallel resistors are to be connected as shown in the diagram. This design configuration enhances the sensitivity of the input signal that makes it possible to observe obvious output voltage change even with very small change in the input signal. The parallel resistor (R6) is to be made variable so it can be easily adjusted according to the output voltage desired.
Fig. 3.

Amplification stage design
The non-inverting amplification (positive feedback) is made with the aid for R3 and R4 resistors. The voltage gain of the amplifier is calculated using Eq. 1.
 |
1 |
While R3 is made variable, the voltage gain can be easily altered as desired. The decoupling capacitor (C1) is responsible for protecting one part of a circuit from the effect of another, such as suppressing noise or transients.
Microcontroller (PIC 16F877A)
A PIC16F877A microcontroller is used in this project. Microcontrollers are described as the brain of the whole system. In this project, it calculates the received amplified signal, correlates the data received with the quality percentage of the fruit, and then sends the result to output for display. In this project, mikroC software is used to develop the algorithm code for the microcontroller. The code has been developed with best instructions to produce accurate fruit quality measurements. The developed code has the ability to convert the input analog voltage into an accurate DC voltage value that can be displayed on the LCD. PIC16F877A microcontroller has 40 pins with different tasks. Pin3 (RA1) is chosen to be the input of the analog signal, and first six pins in port B are connected to the LCD ports for output display. To provide a stable clock signal for the microcontroller, Pin13 and Pin14 of the microcontroller are connected to a 4 MHz quartz crystal with two capacitances to the ground. Quartz crystal provides a very precise frequency to keep track of time. A push button is connected between pin1 and ground to reset the microcontroller when needed, while pin1 is also connected to a pull up resistor to settle the input at expected logic levels. The LEDs of the device are connected to pin27 and pin28, and the chip is powered up by connecting pin11 to the positive voltage and pin31 to the ground.
Alphanumeric LCD
1 Alphanumeric LCD (6 × 2) was used in this study. LCD has very wide range of applications in other electronic fields and services. The LCD is designed with 16 pins that allow the interfacing with the microcontroller. In general, the connection of 14 pins is enough to activate the LCD, while the other two pins 15 and 16 are just used to the VCC and ground respectively in order to lighten up the LCD screen. Another two pins are used for contrast adjustment and the other six pins are connected to the ground. The rest of the pins are connected to port B of the microcontroller. LCD has a main task of providing the interface between user and system. It displays the information desired by the user and processed by the microcontroller.
Software development
The software for the fruit quality characterization system has been developed using a mikroC language program. The software is capable of performing various functions such as data acquiring, calculation performing, and result displaying. Flowchart diagram of the code is presented in Fig. 4.
Fig. 4.

Flowchart diagram of the software
Final device construction
Figure 5 shows a final physical look of fruit quality assessment device built for this study. In general, the device consists of some external and internal components. External components, as shown in Fig. 5 consist of the sample (Mango), sample holder, LCD display, LEDs, infrared sensors, aluminum foil, and power plug. Components are presented in the picture with their corresponding names. Aluminum foil is used to eliminate the effect of surrounded environmental light and so that, only the light source generated by the IR emitter is detected at the photo detector sensor.
Fig. 5.

Final physical look of developed device
The internal components of the device consist of the BCB circuits, battery holder, and other wires and components.
Results and discussion
Experiment 1
In this experiment, two samples of mango fruit were monitored for five days, each 24 h, to calibrate the device characteristics. The two samples of mango fruit were harvested from a local orchard in Bukit Beruang Utama, Melaka, Malaysia. One of the samples was chosen to be un-ripe mango while the other one was seemed to be pre-ripe fruit. The two samples were stored in the refrigerator to keep them at cold temperature (4 ± 1 °C). They were also allowed to equilibrate to room temperature (20 °C) for 10 min before the NIRS measurement. The measurement was then observed and recorded for five following days. Each of the samples was labeled at two different points (x, y) and the NIRS measurement was taken at these two positions for each sample. The NIRS measurement of the un-ripe mango is presented at Table 1.
Table 1.
Effective NIRS measurement readings of un-ripe and pre-ripe mango at two points x, y
| Un-ripe Mango Fruit | Pre-ripe Mango Fruit | |||||
|---|---|---|---|---|---|---|
| Days | NIRS Point (x) | NIRS Point (y) | ±SD | NIRS Point (x) | NIRS Point (y) | ±SD |
| 1 | 2.8 | 2.76 | 0.028 | 3.44 | 3.3 | 0.098 |
| 2 | 2.91 | 2.82 | 0.063 | 3.55 | 3.44 | 0.077 |
| 3 | 2.97 | 2.92 | 0.035 | 3.63 | 3.5 | 0.091 |
| 4 | 3.05 | 2.98 | 0.049 | 3.66 | 3.59 | 0.049 |
| 5 | 3.16 | 3.07 | 0.063 | 3.76 | 3.67 | 0.063 |
The measurements are recorded for five following days, each 24 h, from the time where mango was still un-ripe until just a few days before the ripening time. For point x, the voltage received is recorded as 2.8 V in the first day and it keeps increasing until it reaches 3.16 V at the fifth day. The average rate of voltage increase per day is approximately 0.072 V per day. However, the received voltage recorded for point y of the same mango increased from 2.76 V up to 3.07 V with an average rate of 0.062 V per day. For the second mango, pre-ripe sample, the NIR measurements are presented in Table 1. Following the sample procedures used in the un-ripe sample measurements, the voltage received for sample two, at the two different points x, y, is evaluated. The range of the received voltage for the pre-ripe sample, point x, is recorded starting at 3.44 V and up to 3.76 V with an average rate of 0.064 V per day. For point y in the pre-ripe sample, the voltage received is measured as 3.3 V at the first day and it increased to 3.67 V at the fifth day with an average rate of 0.074 V per day.
The results presented in this experiment, where voltage keeps increasing each day, emphasize the ability of evaluating fruit quality non-destructively using reflection NIRS measurements. In fact, as the fruit ripens, it becomes softer; where the amount of soluble sugar content increases each day and thus increasing the reflected light from the sample those results in an obvious increase in the received voltage.
Experiment 2
In this experiment, another two samples of mango fruit were monitored for six days. In fact, for effective devices, the sensitivity of the circuit that results in an evident change for different types of samples must be evaluated well. Amplification level and other components values presented in experiment one were adjusted to result in better sensitivity for signal detection in this experiment. Following the same procedures as in experiment one; the two mangos were monitored for six days with a period of 12 h between the measurement and the next one. In other words, the NIRS measurements from each mango were taken and recorded twice a day, at 7:00 AM and 7:00 PM. Since the amplification gain of the circuit and other components values were changed recently, there is an obvious change in the received voltage measurements comparing to the results in experiment one. The change was made for better sensitivity measurements. The measurement period was also decreased from 24 h to 12 h each day, allowing for more details and accuracy in the result. The measurement of both samples is presented in Table 2.
Table 2.
Effective NIRS measurement for sample 1 and 2
| Days (Per 12 H) | Sample 1 | Sample 2 | |
|---|---|---|---|
| 1 | 7:00 AM | 3.709 | 3.675 |
| 7:00 PM | 3.729 | 3.695 | |
| 2 | 7:00 AM | 3.748 | 3.714 |
| 7:00 PM | 3.768 | 3.739 | |
| 3 | 7:00 AM | 3.817 | 3.773 |
| 7:00 PM | 3.851 | 3.807 | |
| 4 | 7:00 AM | 3.885 | 3.851 |
| 7:00 PM | 3.929 | 3.89 | |
| 5 | 7:00 AM | 3.973 | 3.939 |
| 7:00 PM | 4.012 | 3.998 | |
| 6 | 7:00 AM | 4.056 | 4.041 |
| 7:00 PM | 4.105 | 4.086 | |
The NIRS of the first sample is presented in Table 2, were NIRS was recorded as 3.675 V at the first day and has increased up to 4.086 V. The average rate of voltage increase is calculated as 0.034 V each 12 h that means also 0.068 V each day.
For the second sample, where its NIR measurements are recorded in Table 2, the voltage measurement recorded at the first day was 3.709 V and it increased up to 4.105 V with an average rate of voltage increase as 0.033 V each measurement time, which means also 0.066 V per day.. Since the voltage measured (NIRS) ranges between 3.7 V and 4.2 V, the ripeness quality percentage was calculated using Eq. 2.
 |
2 |
Where Vi is the measured voltage from any tested sample. From the equation of the quality level stated at Eq. 2, the NIRS measurement with the correlated quality level of the second sample is presented in Table 3.
Table 3.
Correlated effective NIRS measurement readings with the quality level for sample 2
| Days | (Per 12 H) | NIRS% |
|---|---|---|
| 1 | 7:00 AM | 3.709 2 |
| 7:00 PM | 3.729 7 | |
| 2 | 7:00 AM | 3.748 12 |
| 7:00 PM | 3.768 17 | |
| 3 | 7:00 AM | 3.817 29 |
| 7:00 PM | 3.851 37 | |
| 4 | 7:00 AM | 3.885 46 |
| 7:00 PM | 3.929 57 | |
| 5 | 7:00 AM | 3.973 68 |
| 7:00 PM | 4.012 78 | |
| 6 | 7:00 AM | 4.056 89 |
| 7:00 PM | 4.105 100 |
Experiment 3
The objective of this experiment is to examine the effectiveness and accuracy of the device measurements. As the system development was almost done, fifteen mango samples, were used in this experiment to examine the device affectivity. Samples were all harvested from a local orchard in Bukit Beruang Utama, Melaka, Malaysia. They were chosen to be at a different ripeness level observed by the normal human eye. All samples were stored in the refrigerator to keep them at cold temperature (4 ± 1 °C) and they were allowed to equilibrate to room temperature (20 °C) for 10 min before the NIRS measurement. The data of NIRS measurements for this experiment are presented in Table 4, where samples are sorted from the un-ripe sample to the ripest one.
Table 4.
Summary of effective NIRS measurement readings for the tested 15 samples
| Sample No | NIRS | % |
|---|---|---|
| 1 | 3.641 | 0 |
| 2 | 3.675 | 0 |
| 3 | 3.709 | 2 |
| 4 | 3.734 | 8 |
| 5 | 3.734 | 8 |
| 6 | 3.778 | 19 |
| 7 | 3.787 | 21 |
| 8 | 3.812 | 28 |
| 9 | 3.846 | 36 |
| 10 | 3.895 | 48 |
| 11 | 3.929 | 57 |
| 12 | 3.978 | 69 |
| 13 | 4.037 | 84 |
| 14 | 4.071 | 92 |
| 15 | 4.11 | 100 |
A summary of the data recorded of all the fifteen mango samples is presented in Table 4. In the table columns, the samples are sorted from one to fifteen, while the horizontal tables represent the voltage received and the approximate percentage of ripeness level as shown in Fig. 6.
Fig. 6.

Effective NIRS variation for a mango with time period
In Table 4, the voltage received at the system output ranges approximately between 3.5 V volt and 4.2 V according to the ripeness stage of each sample. These results emphasis the effective NIRS measurements readings of the device that has the ability to assess the repines of mango fruit non-destructively using reflectance NIRS technology.
Experiment 4
Study of variation in the NIRS effective reading values with respect to the contact area of the optc sensor and temperature. The effect of the random variations of optic sensor contact (because of random changes in optic sensor contact pressure on the fruit surface) and random variation of temperature, on the measured values of the effective NIRS measurement readings of the fruit, is ascertained by measuring the effective NIRS measurement readings of the fruit samples in a batch of eight readings where each reading is the average of two readings at two different points x, y, is evaluated for un-ripe and pre-ripe mango fruit sample as shown in Table 5.
Table 5.
Study of variation in the NIRS effective reading values with respect to the contact area of the optic sensor and temperature (20±3 oC)
| Repetition No | Un-ripe NIRS Point (x) | Un-ripe NIRS Point (y) | Pre-Ripe NIRS Point (x) | Pre-ripe NIRS Point (y) |
|---|---|---|---|---|
| 1 | 2.81 | 2.76 | 3.44 | 3.3 |
| 2 | 2.85 | 2.82 | 3.39 | 3.44 |
| 3 | 2.79 | 2.74 | 3.45 | 3.5 |
| 4 | 2.77 | 2.8 | 3.38 | 3.4 |
| 5 | 2.82 | 2.79 | 3.42 | 3.36 |
| 6 | 2.83 | 2.75 | 3.41 | 3.37 |
| 7 | 2.78 | 2.73 | 3.47 | 3.34 |
| 8 | 2.8 | 2.7 | 3.37 | 3.32 |
| Average value | 2.80625 | 2.76125 | 3.41625 | 3.37875 |
| Standard deviation σ | 0.026692696 | 0.0397986 | 0.03543102 | 0.06599513 |
These measurements were made at a controlled temperature of 20 ± 3 °C. The standard deviations for effective NIRS measurement readings of un-ripe at point x are ±0.026, and at point y ±0.039.
Correspondingly, the standard deviations for effective NIRS measurement readings of pre-ripe mango fruit at point x are 0.035, and at point y 0.065 Respectively, calculated from experimental data. Results are given in Table 5.
From the results of the four experiments conducted during this project, near infrared spectroscopy shows a very promising evaluation of the fruit quality. Demonstrates the results collected from the fifteen samples measurements in experiment three. Different NIR spectroscopy measurement was recorded for each sample. The vertical axis of the graph represents the voltage measured for the different samples listed in the horizontal axis.
Quality evaluation of mango fruit can be also described in the form of percentage level. Represents the quality level versus the number of samples measured. Based on the results recorded and, mango with high quality should results in voltage range between 3.98 V to 4.1 V of NIR measurements that means also a range of quality percentage between 70 % and 100 %. The higher measurements of NIR spectroscopy, the higher the quality of the fruit. In fact, NIR spectroscopy (940 nm) shows an excellent performance on determining the presence of sugars, starch, and protein with concentrations greater than 0.1 % in samples.
Conclusions
The portable NIR spectroscopy (940 nm) system was developed to determine the quality of mango fruit nondestructively. The system was designed based on NIR spectroscopy technology because of its highly accurate measurements that provides a brief and rich summary of the overall biochemical components of the sample.
The effective of random variation of temperature and pressure is determined and found negligible in comparison with change in effective NIRS measurement readings of the mango fruit because of ripening process. The ratio between effective NIRS measurement reading values of ripe and un-ripe (raw) mango, measured at x point, is 1.12. While ratio between effective NIRS measurement reading values of ripe and per-ripe (raw) mango, measured at y point, is 1.09. Hence, the effective NIRS measurement reading values of mango fruits may be used to differentiate between un-ripe and ripe mangoes.
These are the preliminary results; further experimentation may be done to detect Quality percentage how sugar content and acidity of mango fruit is increased with time in which it takes approximately 5 to 10 days for a mature mango fruit to ripen. The results presented in this study were very encouraging and indicate the ability of NIRS measurement in evaluating the quality of mango nondestructively. It also showed that such portable devices could help to obtain a complete follow-up of the mango in the orchards and during post-harvest. This device makes it possible to evaluate the mango quality nondestructively by a portable, low cost, friendly use, time consuming, and small near infrared spectroscopy reflectance system with 940 nm wavelength.
Acknowledgments
Authors are thankful to the Faculty of Health Science & Biomedical Engineering, UTM University for providing the necessary facilities and equipments for the fabrication and testing. This work is supported by the Ministry of Higher Education (MOHE), vote number 05J75. Research University Grant, Scheme Tier 2 (PY/2012/00264) sanctioned by Universiti Teknologi Malaysia.
Abbreviations
- AC
Alternating current
- A/D
Analogue to digital
- Av
Voltage gain
- °C
Degree Celsius
- DC
Direct current
- FAD
Fruit assessment device
- IR
Infrared
- JFET
Junction field-effect transistor
- LCD
Liquid crystal display
- LED
Light-emitting diode
- mV
Milli-volts
- μm
Micrometers
- NIR
Near infrared (750–2500 nm)
- NIRS
Near infrared spectroscopy
- nm
Nanometers
- Vo
Output voltage
Contributor Information
Basem Abu Izneid, Email: basem782001@yahoo.com.
M. I. Fadhel, Phone: +60-126-862115, FAX: +60-623-16552, Email: mus70@yahoo.com
References
- Antihus HG, He Y, Pereira AG. Non-destructive measurement of acidity, solublesolids and firmness of Satsuma mandarin using Vis/NIR-spectroscopy techniques. J Food Eng. 2006;77:313–319. doi: 10.1016/j.jfoodeng.2005.06.036. [DOI] [Google Scholar]
- Bally ISE (2006) Mangifera Indica (mango), Anacardiaceae (cashew family). Species Profiles for Pacific Island Agroforestry, April 2006. (1–25)
- Carlini P, Massantini R, Mencarelli F. Vis-NIR measurement of soluble solids in cherry and apricot by PLS regression and wavelength selection. J Agric Food Chem. 2000;48:5236–5242. doi: 10.1021/jf000408f. [DOI] [PubMed] [Google Scholar]
- Choi K-H, Lee K-J, Kim G (2011) Nondestructive quality evaluation technology for fruits and vegetables using near-infrared spectroscopy. National Institute of Agricultural Engineering, Rural Development Administration, 249 Seodun-don, Suwon, Republic of KOREA, pp 1–15
- Fairuz A, Zubir M. Optical sensor in the measurement of fruits quality: a review on an innovative approach. Int J Comp Elect Eng. 2009;1:557–561. [Google Scholar]
- Fan G, Zha J, Du R, Gao L. Determination of soluble solids and firmness of apples by Vis/NIRtransmittance. J Food Eng. 2009;93(4):416–420. doi: 10.1016/j.jfoodeng.2009.02.006. [DOI] [Google Scholar]
- Liew CY, Lau CY. Determination of quality parameters in Cavendish banana during ripening by NIR spectroscopy. Int Food Res J. 2012;19:751–758. [Google Scholar]
- Lin H, Ying Y. Theory and application of near-infrared spectroscopy in assessment of fruit quality: a review. Sens Instrum Food Qual Safety. 2009;3:130–141. doi: 10.1007/s11694-009-9079-z. [DOI] [Google Scholar]
- Moghimi A, Aghkhani MH, Sazgarnia A, Sarmad M. Vis/NIR spectroscopy and chemometrics for the prediction of solublesolids content and acidity (pH) of kiwifruit. Biosyst Eng. 2010;106:295–302. doi: 10.1016/j.biosystemseng.2010.04.002. [DOI] [Google Scholar]
- Tian H-q, Ying Y-b, Hui-shan L, Xia-ping F, Hai-yan Y. Measurement of soluble solids content in watermelon by Vis/NIR diffuse transmittance technique. J Zhejiang Univ Sci B. 2007;8:105–110. doi: 10.1631/jzus.2007.B0105. [DOI] [PMC free article] [PubMed] [Google Scholar]