

Abstract
Peripheral and CNS inflammation leads to aberrations in developmental and postnatal neurogenesis, yet little is known about the mechanism linking inflammation to neurogenic abnormalities. Specific miRs regulate peripheral and CNS inflammatory responses. miR-155 is the most significantly upregulated miR in primary murine microglia stimulated with lipopolysaccharide (LPS), a proinflammatory Toll-Like Receptor 4 ligand. Here, we demonstrate that miR-155 is essential for robust IL6 gene induction in microglia under LPS stimulation in vitro. LPS-stimulated microglia enhance astrogliogenesis of cocultured neural stem cells (NSCs), whereas blockade of IL6 or genetic ablation of microglial miR-155 restores neural differentiation. miR-155 knock-out mice show reversal of LPS-induced neurogenic deficits and microglial activation in vivo. Moreover, mice with transgenic elevated expression of miR-155 in nestin-positive neural and hematopoietic stem cells, including microglia, show increased cell proliferation and ectopically localized doublecortin-positive immature neurons and radial glia-like cells in the hippocampal dentate gyrus (DG) granular cell layer. Microglia have proliferative and neurogenic effects on NSCs, which are significantly altered by microglial miR-155 overexpression. In addition, miR-155 elevation leads to increased microglial numbers and amoeboid morphology in the DG. Our study demonstrates that miR-155 is essential for inflammation-induced neurogenic deficits via microglial activation and induction of IL6 and is sufficient for disrupting normal hippocampal development.
Keywords: hippocampus, microglia, microRNA, neurogenesis, neuroinflammation, transgenic mice
Introduction
A growing body of evidence demonstrates that microglia, the innate immune cells of the CNS, modulate prenatal and postnatal neurogenesis, a process considered important for neuroplasticity, development, and pediatric psychiatric disorders. Microglia support CNS development and maintenance through synaptic pruning (Paolicelli et al., 2011), efferocytosis (Sierra et al., 2010), and release of protective factors (Ueno et al., 2013). As highly active surveyors of the brain microenvironment, microglia detect pathogens or tissue damage and respond via Toll-Like Receptor (TLR)-mediated activation followed by cytokine and chemokine signaling.
Neurogenic deficits accompany pathological neuroinflammation during development and in adulthood (Guidi et al., 2008; Hutsler and Zhang, 2010). Animal models of immune activation support a causal relationship of microglial phenotype and neurogenic abnormalities: hippocampal neurogenesis is suppressed by neuroinflammation induced by the TLR4 ligand lipopolysaccharide (LPS) and is restored by anti-inflammatory drugs (Ekdahl et al., 2003; Monje et al., 2003). Central inflammation alters synapse formation, cognition, and neural plasticity in rodents (Belarbi et al., 2012; Chugh et al., 2013). Therefore, neurogenesis is responsive to inflammation, yet the molecular mechanisms linking neuroinflammation to neurogenesis remain elusive.
miRs, small noncoding RNAs regulating posttranscriptional gene expression, play critical roles in nearly every biological process, including peripheral immune cell development and function (Baltimore et al., 2008; Ponomarev et al., 2013). Through a genome-wide gene expression analysis of polarized primary murine microglia, we identified miR-155 and interleukin-6 (IL6) as the most upregulated miR and mRNA in microglia under proinflammatory activation (Freilich et al., 2013). Moreover, Signal Transducer and Activator of Transcription 3 (STAT3), an IL6 transcription factor activated by IL6, is upregulated in proinflammatory microglia, suggesting that induced IL6 amplifies proinflammatory polarization of microglia.
miR-155 is conserved across vertebrate species and is involved in the inflammatory response. Proinflammatory stimuli upregulate miR-155 and miR-155 represses anti-inflammatory molecules (Cardoso et al., 2012; Elton et al., 2013). miR-155 is increased in inflammatory CNS disorders, including human ex vivo specimens and animal models of amyotrophic lateral sclerosis (ALS) (Koval et al., 2013), multiple sclerosis (MS) (Junker, 2011; Murugaiyan et al., 2011; Moore et al., 2013), and Down syndrome (Keck-Wherley et al., 2011; Wang et al., 2013). Importantly, targeting miR-155 is beneficial in animal models of MS and ALS (Butovsky et al., 2015).
miR-155 and IL6 influence hippocampal plasticity and neurogenesis. IL6 is a proinflammatory cytokine and founding member of the neuropoietin cytokines that are known to alter neural stem cell (NSC) fate through Janus kinase (JAK)/STAT3 signaling. IL6 is implicated in neurogenic suppression, reduced hippocampal gray matter volume, and skewing NSCs toward gliogenesis (Nakanishi et al., 2007; Balasubramaniam et al., 2009; Peng et al., 2011). Several miR-155 targets are highly expressed in hippocampus and are involved in cognitive function and the innate immune response (Keck-Wherley et al., 2011; Li et al., 2012). In this study, we determined the role of miR-155 in inflammation-induced neurogenic deficits and regulation of neurogenesis in vivo using miR-155 knock-out and nestin+ cell-specific miR-155-overexpressing mice. Our results demonstrate that miR-155 is essential for neurogenic pathology induced by inflammation, including proliferation, differentiation, and migration of NSCs in the dentate gyrus (DG).
Materials and Methods
Animals and animal tissues.
Timed-pregnant female CD-1 mice from Charles River Laboratories were used for wild-type (WT) primary microglial and NSC cultures. B6.Cg-Mir155tm1.1Rsk/J mice, hereafter referred to as miR-155−/− mice, and control C57BL/6J mice (Jackson Laboratory) were used for intracranial surgeries and primary microglial cultures. NesCre8 mice, which homozygously express Cre-recombinase under control of the nestin promoter, and NesCre8;miR-155LSLtTA mice were created as described previously (Babar et al., 2012). NesCre8; miR-155LSLtTA mice are double heterozygotes created by crossing a loxP-STOP-loxP tetracycline-controlled miR-155 knock-in mouse model, miR-155LSLtTA (in which mir-155 is targeted to the ROSA26 locus and is under control of a TetO-mini-CMV promoter) with the NesCre8 mouse. The miR-155LSLtTA construct contains a loxP-floxed stop cassette that prevents transcription until being removed by Cre recombinase, allowing for specific expression of miR-155 in nestin+ brain cells. The construct also contains a tTA element that deactivates miR-155 induction upon doxycycline (DOX) exposure, allowing temporal control of miR-155 expression. Recombination was activated in the brain by crossing these mice with a NesCre8 driver to generate NesCre8;miR-155LSLtTA mice, in which Cre-mediated recombination occurs in any cell that expressed nestin over the entire lifetime of the cell, including microglia. Therefore, any cell that ever expressed nestin is susceptible to miR-155 induction when DOX is removed from the diet. In lymphoid tissues, these mice display 45-fold induction of miR-155 in adult spleen and 120-fold induction in bone marrow at 2 weeks of age, contributing to peripheral development of lymphoma and splenomegaly. In the brain, 70-fold miR-155 expression is seen in nestin+ cells, including NSCs, neurons, astrocytes, and microglia. Administration of DOX after Cre induction reduces miR-155 expression to <5-fold (Babar et al., 2012). Male NesCre8;miR-155LSLtTA mice were fed either regular chow to induce miR-155 expression or chow with DOX (2.3 g/kg pellet) to deactivate expression, as described previously (Babar et al., 2012). Male mice from 4 groups: (1) NesCre8 (control) mice with regular chow, (2) NesCre8;miR-155LSLtTA with regular chow (“miR155-hi” mice), (3) NesCre8;miR-155LSLtTA with DOX from gestation to kill (“miR155-lo”), and (4) NesCre8;miR-155LSLtTA with DOX from gestation to 6 weeks and then regular chow for 1 week to determine the effect of enhanced miR-155 expression only during the adult phase (“miR155-hi-adult”) (n = 4–5 animals/group) were killed at 7–8 weeks of age (see Fig. 4A). At the time of killing, brains were rapidly removed, fixed for 72–120 h in 10% neutral buffered formalin at 4°C, and transferred in PBS at ambient temperature to Boston University. All procedures were performed in accordance with the National Institutes of Health Guide for the Care and Use of Laboratory Animals and approved by the Boston University School of Medicine and Yale University Institutional Animal Care and Use Committees.
Figure 4.
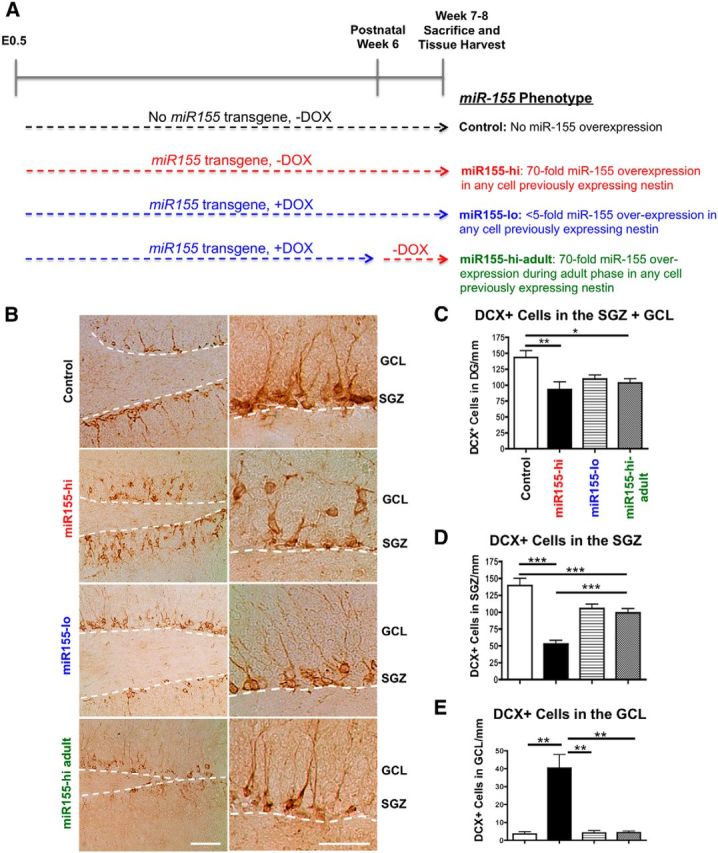
Elevated miR-155 reduces immature neuron survival and induces their ectopic localization in the GCL. A, miR-155 transgenic mouse experimental groups and study design. Comparison of control versus miR155-hi or miR155-hi versus miR155-lo determines whether embryonic and postnatal expression of miR-155 affects neural development and maturation. Comparison of miR155-lo versus miR155-hi-adult or control versus miR155-hi-adult determines whether expression of miR-155 only in the adult phase affects neurogenesis and microglial activation. In all groups in addition to control (e.g., mice expressing miR-155 transgene), a high level of miR-155 expression is induced by the removal of DOX in any cell previously expressing nestin. B, Representative images of DCX+ immature neurons in control, miR155-hi, miR155-lo, and miR155-hi-adult DG showing their miR-155-induced ectopic localization in the GCL. The SGZ is marked by dotted white line. Left images, 10× objective original magnification; right images, 40× original magnification. Scale bars, 100 μm. C, Quantification of total DCX+ cells in DG. D, Quantification of DCX+ cells in the SGZ per millimeter. E, Quantification of ectopically located DCX+ cells in the GCL per millimeter. n = at least 5 20× original magnification images per animal from 4 to 5 animals per group. ***p < 0.001, **p < 0.01, and *p < 0.05 as determined by 1-way ANOVA and Tukey post hoc. Data are shown as mean ± SEM.
Intracerebroventricular microinjections.
Seven-week-old miR-155−/− and C57BL/6J WT mice received intracerebroventricular microinjections of of 1 μl of purified 055:B5 Escherichia coli LPS (Sigma-Aldrich) (1 μg/μl) or 1 μl of saline. Twenty-eight mice were divided into four groups: (1) miR-155−/− + saline, (2) miR-155−/− + LPS, (3) WT + saline, and (4) WT + LPS. Briefly, the animals were allowed to adapt to the operation room for ∼1 h. Animals were weighed, anesthetized with isoflurane, and attached to a small animal stereotaxic instrument (Model 900; Kopf Instruments). Rimadyl (Carprofen, 4.5 mg/kg) analgesic was given subcutaneously before surgery. Microinjections were targeted to the right lateral ventricle at the following coordinates relative to bregma: AP = +0.1 mm, ML = −0.85 mm and DV of −2.5 mm with a programmable injector and 10 μl of Hamilton syringe with a 23-gauge needle at a rate of 0.5 μl/min. The wound was closed with 4-0 nylon sutures.
BrdU injections.
A series of 5 intraperitoneal injections of bromodeoxyuridine (BrdU, 50 mg/kg; Sigma-Aldrich) were performed on days +1, +2, and +3 relative to the day of intracerebroventricular microinjection (day 0). Two BrdU injections per day were administered IP on the first 2 d, with a minimum of 12 h between each injection, and 1 injection was given on day 3. On day +5 after injection, animals were euthanized and brains were extracted for immunohistochemistry (IHC).
Perfusion and tissue processing.
NesCre8 and NesCre8;mir-155LSLtTA tissues were excised and processed at Yale University as described above, dehydrated in 15% and 30% sucrose overnight, frozen in OCT compound (Thermo-Fisher Scientific), sectioned coronally at 10 μm (left hemisphere) and sagitally at 20 μm (right hemisphere) directly onto glass slides, and stored at −20°C until further applications. All other animals were anesthetized with isoflurane and transcardially perfused with ice-cold 4% PFA. Brains were excised and fixed in 4% PFA overnight, followed by 15% and 30% sucrose for 24 h each, then frozen in OCT compound and coronally sectioned with a cryostat at 30 μm thickness. Free-floating sections were stored in PBS at 4°C for further applications.
IHC and immunofluorescence.
IHC and immunofluorescence were performed as described previously, with minor modifications (Asai et al., 2014). Serially prepared slides were dehydrated, followed by antigen retrieval using 10 mm sodium citrate buffer or Tris-EDTA (Sigma-Aldrich). Samples were permeabilized with 0.2% Triton X-100 and incubated in 2% bovine serum albumin/6% normal goat or donkey serum blocking buffer (Sigma-Aldrich), followed by incubation with specific primary antibodies: ionized calcium-binding adapter molecule 1 (IBA1; 1:1000; Wako), rabbit polyclonal anti-glial fibrillary acidic protein (GFAP, 1:1000; Dako), goat anti-Ki67 (1:80; Santa Cruz Biotechnology), goat anti-doublecortin (DCX) (1:250; Santa Cruz Biotechnology). Twenty-four hours later, endogenous peroxidase activity was inhibited with 0.3% hydrogen peroxide and sections were incubated in secondary antibody for 30 min (ImmPRESS HRP anti-rabbit or anti-goat peroxidase polymer detection kit; Vector Laboratories). 3,30-Diaminobenzidine (DAB; Vector Laboratories) was used as a chromogen. Immunofluorescence was performed on both free-floating 30 μm tissue sections or fixed primary NSCs and NPCs on coverslips. Briefly, cells were permeabilized in 0.1–1% Triton X-100 in PBS (PBS-T), incubated in blocking buffer (2–10% normal goat or donkey serum), and incubated overnight at 4°C in the following primary antibodies: mouse anti-BrdU (G3G4, 1:100; University of Iowa Hybridoma Core), rat anti-BrdU (1:250; Abcam), goat anti-DCX (1:500 on tissue sections and 1:200 on cells; Santa Cruz Biotechnology), rabbit anti-IBA1 (1:500; Wako), rabbit polyclonal anti-GFAP (1:500; Dako), mouse monoclonal anti-GFAP (1:500; Sigma-Aldrich), mouse anti-βIII tubulin (Promega), and rabbit anti-cleaved caspase-3 antibodies (1:250; Cell Signaling Technology). Species-specific Alexa Fluor secondary antibodies (1:1000; Invitrogen) and DAPI (1:5000; Ana Spec) were used. Tissue sections and cell culture coverslips were mounted on glass slides with Vectashield fluorescent mounting medium (Vector Laboratories).
BrdU immunofluorescence.
BrdU immunostaining was performed on free-floating tissue sections and primary cultured NSCs on coverslips. All steps described were performed at room temperature and on a shaker unless noted otherwise. For antigen retrieval, sections were incubated in 50% formamide/50% 2× saline-sodium citrate buffer at 65°C. Sections were rinsed in 2× saline sodium citrate buffer (10 min), 2 m hydrochloric acid at 37°C (30 min for sections, 15 min for cells), 0.1 m borate buffer (10 min), and permeabilized with 0.1% PBS-T. The remainder of the BrdU protocol is as described above for immunofluorescence.
Image capture, analysis, and quantification.
DAB-immunostained images were captured with a Nikon Eclipse E600 microscope and a color charge-coupled device camera (Nikon). Immunofluorescence images were captured using an inverted Eclipse TE 2000-S fluorescence microscope with a monochromatic charge-coupled device camera (Nikon) coupled with the X-cite-120 Fluorescence Illumination System (Lumen Dynamics Group) and NIS-Elements Microscope Imaging SW (Nikon, BR ver. 3.22.11). All image analysis was performed blinded with respect to treatment groups. Cell number or fluorescence intensity was quantified with ImageJ software version 1.43. Subgranular zone (SGZ) length was quantified using the NeuronJ plug-in version 1.4.2 (http://www.imagescience.org/meijering/software/neuronj).
For BrdU immunofluorescence image quantification, the number of BrdU-positive cells along the SGZ and GCL was counted and normalized to SGZ length (in millimeters) and in the GCL to GCL area (in square millimeters). DCX fluorescence intensity was obtained using the ImageJ “measure” tool that measures average intensity of all pixels in a selected area. For each image analyzed, a small rectangle approximately the width of the SGZ was created using the “area” tool and pixel intensity in this rectangle was recorded. A minimum of 10 rectangles along the SGZ was taken to calculate average DCX pixel intensity. An additional 10 sample points were randomly chosen with the same rectangle size from areas outside the SGZ that were negative for DCX immunoreactivity and averaged for image background intensity measurement. The final DCX intensity for each image was determined from the difference between the average DCX intensity and the average background intensity.
For diaminobenzidine IHC, DCX+ cells were manually counted using ImageJ. DCX+ cells in the SGZ and in the granular cell layer (GCL) were counted and normalized to length of the SGZ using at least 5 20× original magnification images per animal from 4–5 animals per group.
For the in vivo miR155-induction study, Ki67+ cells were counted as proliferating cells. The total number of Ki67+ cells in the DG (hilus, SGZ, GCL) was counted with 20× objective original magnification images from at least 10 brain sections per group. Astrocytes in the molecular layer and hilus were quantified using GFAP. GFAP+ cells were counted as astrocytes by identification of a cell body with at least three processes counted from seven to nine sections taken from three to five animals per group. Area of the hilus and outer molecular layer was measured using the ImageJ “measure” tool and astrocyte counts were normalized to area. Radial-glia-like cells were quantified using GFAP. GFAP+ cells were counted as radial glia by identification of a cell body and radial-glia-like processes within the SGZ and GCL counted from at least 10 brain sections per group.
Microglia density was determined by counting the number of IBA1+ cells in the DG (hilus, SGZ, and GCL) from at least 20 20× objective original magnification images per group. Microglia morphology was analyzed according to a method described previously (Lawson et al., 1990) to identify compact (amoeboid) and radially branched (ramified) cells and modified as described previously (Asai et al., 2014). Specifically, round or slightly elongated cells with up to three short, thick processes were counted as amoeboid cells and cells with three or more major processes radiating from a central cell body or sometimes with a unipolar tuft of elaborate processes were counted as ramified cells. For the intracerebroventricular LPS challenge study, at least 20 20× objective original magnification images of the DG (hilus, SGZ, and GCL separately) were counted from each group. For the miR155-overexpressing mice, at least 20 40× objective original magnification images were counted from each group.
For pre-miR mimic experiments, Ki67+ cells were counted as proliferating cells. Ki67+ cells, whole DAPI cells, and fragmented DAPI cells were quantified from at least 10 20× original magnification images per group as described previously (Kiyota et al., 2012). BrdU+ cells were counted as any cell in the cell cycle synthesis phase during the 24 h BrdU incubation. In some cases, cells were counted automatically using the 3D objects counter tool in ImageJ Fiji and counts were checked manually for accuracy. For differentiation experiments using pre-miR mimics, the numbers of whole and fragmented DAPI cells were counted and, of these, GFAP+ cells and DCX+ cells were quantified from at least 10 20× images per group. Cleaved-caspase-3 fluorescence intensity was measured in ImageJ using the “measure” tool from at least 10 20× images per group and was considered to be directly proportional to apoptosis.
Primary microglia isolation.
Primary microglia were isolated from postnatal day 0 (P0) or P1 pups from CD-1 WT, miR-155−/−, or C57BL/6J WT mice under sterile conditions and cultured as described previously using either Percoll gradient separation or CD11b MicroBeads (Miltenyi Biotec) (Freilich et al., 2013). Isolated microglia were cultured in Dulbecco's minimum essential medium (DMEM) supplemented with 10 ng/ml recombinant murine granulocyte macrophage-colony stimulating factor and 10 ng/ml murine colony stimulating factor (all from Abzyme) and incubated for 5–7 d before PBS or LPS stimulation. We obtained >85% (Percoll method) and >93% (CD11b MicroBeads) enrichment of microglia in our cultures.
Stimulation of primary microglia and RNA isolation.
Five to seven days after isolation, primary cultured microglia were placed in serum-free medium overnight, then stimulated with purified 055:B5 E. coli LPS (100 ng/ml; Sigma-Aldrich) or equal volume PBS for 4 h at 37°C with 5% CO2. To extract combined mRNA and miR, cells were lysed using QIAzol Lysis Reagent extracted using the miRNeasy Mini Kit and the QIAcube (all from QIAGEN) according to the manufacturer's protocol. Selected RNA samples were checked for quality by RNA agarose gel electrophoresis, having a minimum 260/280 ratio of 1.80 or greater, and quantified using NanoDrop 1000 (Thermo-Fisher Scientific).
Real-time RT-PCR.
RT-PCR was used to validate mRNA gene expression alterations in primary microglia under different stimulation conditions and in NSCs transfected with different miR mimics as described above. mRNA RT-PCR was performed using QuantiTect Reverse transcription kit for cDNA synthesis and QuantiFast SYBR Green RT-PCR Kit (all from QIAGEN). Custom designed primers (Invitrogen) were used for IL6 (F: 5′-CCAGTTCCTTCTTGGGACTG-3′ and R: 5′-CAGGTCTGTTGGGAGTGGTATCC-3′), SHIP1(INPP5D) (F: 5′-TGAGGCTGAGGAGGACACTGTAGA-3′ and R: 5′-GGGGCTCGGGGGTTCTCTGT-3′), TNF-α (F: 5′-GCCCAGACCCTCACACTCAGATCA-3′ and R: 5′-CCCATCGGCTGGCACCACTAGT-3′), NOS2 (F: 5′-CCCTTCCGAAGTTTCTGGCAGCG-3′ and R: 5′-GGCTGTCAGAGCCTCGTGGCTTTGG-3′), and RHOA (F1: 5′-CGTCGGTTCTCTCCATAGCC-3′ and R1: 5′-TCAGATGCAAGGCTCAAGGC-3′; F2: 5′-CCGTCGGTTCTCTCCATAGC-3′ and R2:5′-TCTCAGATGCAAGGCTCAAGG-3′). miR RT-PCR was performed using the miRCURY Locked Nucleic Acid (LNA) Universal cDNA Synthesis Kit and miRCURY LNA SYBR Green master mix RT-PCR Kit with specific primers to mmu-miR-155 (all from Exiqon). All RT-PCRs were conducted using the Mastercycler ep Realplex and real-time thermal cycler (Eppendorf).
LNA-based anti-miR-155 transfection.
To inhibit miR-155, we used mmu-miR-155 miRCURY LNA miR inhibitor with 5′-fluorescein label (CCCCTATCACAATTAGCATT) or scramble negative antisense control with 5′-fluorescein label (all from Exiqon). The miR-155 inhibitor is a 20-nt oligonucleotide that binds complementarily and with high affinity to the active form of miR-155. Microglia were isolated from CD-1 P0 or P1 pups as described above and cultured for 5–7 d. Cells were transfected for 4–6 h at 37°C and 5% CO2 with miR-155 inhibitor LNA (100 pmol) or anti-miR scramble LNA (100 pmol) mixed with OptiMem I (Invitrogen) and Lipofectamine 2000 (Invitrogen) according to the manufacturer's protocol. Cells were then washed in PBS and normal microglia medium was replaced. Microglia recovered for 24–48 h before PBS or LPS stimulation. The night before stimulation, the medium was replaced with serum-free medium. Cells were stimulated for 4 h with 100 ng/ml LPS or an equivalent volume of PBS, followed by total RNA isolation and RT-PCR as described above.
IL6 ELISA.
To assess IL6 levels in LPS-stimulated miR-155−/− mice, we used 7-week-old miR-155−/− and C57BL/6J WT mice and performed intracerebroventricular injection of either 1 μl of LPS (1 mg/ml) or 1 μl of saline. A total of 12 mice were divided into four groups: (1) miR-155−/− + saline, (2) miR-155−/− + LPS, (3) WT + saline, and (4) WT + LPS. Surgical procedures were followed as described above. Four days after LPS or saline injections, mice were euthanized and the whole brain was extracted, hemisected, weighed, snap-frozen in dry ice, and stored at −80°C until further applications. After thawing, the cerebellum and brainstem were removed, the remaining tissue was homogenized, and protein was extracted using RIPA buffer containing 2 mm phenylmethylsulfonyl fluoride, 1 mm sodium fluoride, and 41 mm sodium orthovanadate on ice for 30 min. To determine IL6 levels, we used the Mouse IL6 Ready-SET-Go! ELISA Kit (eBioscience) according to the manufacturer's protocol.
Primary NSC cultures.
Primary NSCs were isolated from E13.5 to E14 CD-1 mouse fetuses. Briefly, the entire fetal brain was removed. The cortex and hippocampus were separated from the cerebellum and brainstem and placed in cold PBS with 2% glucose on ice. The meninges were removed and discarded. Pooled brain tissue was resuspended in proliferation medium [DMEM/F12 (Invitrogen) supplemented with penicillin/streptomycin, B27 supplement (Invitrogen), 20 ng/ml recombinant human EGF (Invitrogen) and 20 ng/ml recombinant human FGF2 (eBioscience)] and triturated to obtain a single cell suspension. Cells were centrifuged for 5 min at 150 × g and resuspended in proliferation medium. The cell suspension was filtered through a 40 μm filter and cells were counted using a hemocytometer. Neurosphere cultures were started by seeding at least 12 × 106 cells in 45 ml of proliferation medium in a T175 flask and incubated at 37°C in 5% CO2. Neurospheres were dissociated when they attained a diameter of ∼100 μm (every 3–4 d) and replated at a density of 1.25 × 10⁵ cells in 8–10 ml per T25 flask. Neurospheres were used until seven passages, at which point cell viability and proliferation rate begins to decrease.
Primary neural precursor cell isolation and culture.
Primary neural precursor cells (NPCs) were isolated from pregnant E17 CD-1 mouse fetuses as described previously (Asai et al., 2014). The cell suspension was counted and plated on poly-d-lysine-coated plates at a density of 100,000 cells per well in a 24-well plate and cultured in neurobasal medium supplemented with B-27, GlutaMAX, and penicillin/streptomycin (all from Invitrogen). Every four days, half of the medium was replaced with fresh medium.
Neural cell/primary microglia coculture assay.
To determine the impact that microglia have on neurogenesis in vitro, we used a coculture assay of 24-well plates with transwells containing 0.4 μm pores (Millipore) as described previously (Kiyota et al., 2012). NSCs or NPCs were plated on coverslips coated with poly-D-lysine (Sigma-Aldrich) and laminin (for NSCs only) (Invitrogen) in the well of the 24-well plate and microglia in the transwell above NSCs. NSCs or NPCs were plated at 50,000–100,000 cells/ well in 500 μl of medium according to the assay (for NSCs: DMEM/F12 supplemented with B-27 and penicillin/streptomycin; NPCs: neurobasal medium supplemented with B-27, GlutaMAX, and penicillin/streptomycin; all from Invitrogen).
Microglial LPS stimulation and IL6 neutralizing antibody treatment.
For the LPS stimulation and IL6 antibody experiment, microglia were trypsinized and resuspended using the appropriate medium, counted, and then stimulated in 14 ml round-bottomed polypropylene tubes (Falcon 2059) for 4 h before addition to the transwell. Stimulation conditions were as follows (8 groups, n = 3–4/group): WT microglia ± LPS (100 ng/ml), WT microglia with IL6 neutralizing antibody (200 ng/ml) ± LPS, WT microglia with isotype control antibody (200 ng/ml) ± LPS, and miR155−/− microglia ± LPS. Stimulated microglia were seeded in the transwells at a 3:10 ratio of microglia to NSCs and cocultured for 5 d, followed by fixation with 4% PFA, as described previously (Kiyota et al., 2012). Cells were immunostained for GFAP (astrocytes), βIII-tubulin (neurons), and DAPI marking cellular DNA to identify viable cells. Coverslips were mounted on slides and at least 10 20× images were counted for each group. Manual counts of astrocytes and neurons were normalized to the percentage of viable cells (assessed by whole vs fragmented nuclei).
Transfection of pre-miR and NSC/microglia coculture study.
To determine the effects of exogenous miR-155 on NSC proliferation, differentiation, and gene expression, NSCs and microglia were treated with the miR precursor mmu-miR-155-5p or Cy3-labeled control miR mimic (all from Ambion). Mouse embryonic NSCs were isolated as described above or thawed from liquid-nitrogen-frozen neurosphere stocks and then plated at a density of 40,000 (proliferation studies) or 100,000 (differentiation studies) cells/well in 24-well plates in proliferation medium. For differentiation studies, NSC medium was changed to differentiation medium 8 h before transfection. For coculture studies, microglia were isolated from P0/P1 C57BL/6J or CD-1 pups using CD11b MicroBeads (Miltenyi Biotec). Microglia were plated at 85,000–100,000 cells/transwell in DMEM supplemented with 10% fetal bovine serum, penicillin/streptomycin, and 20 ng/ml murine colony stimulating factor (Abzyme). Cells were transfected with Lipofectamine 2000 alone (Invitrogen, Mock group), or with Lipofectamine 2000 plus control mimic or pre-miR-155 mimic. NSCs were transfected with 0.2 nm miR mimics in serum-free DMEM/F12 for 24 h. Microglia were transfected in transwells with 100 nm mimics in DMEM for 1 h or overnight according to our initial LNA-based RT-PCR experiments, which showed ∼500× basal miR-155 expression in primary microglia versus NSCs. After transfection, half of the medium was changed to preconditioned medium according to the study. Microglia medium was changed to NSC proliferation medium and transwells were transferred onto NSCs. NSCs were treated for 2 h or overnight with BrdU (10 μm final concentration) 24 h after starting coculture and fixed with 4% PFA another 24 h later. For differentiation studies, transfections and coculture were performed identically to proliferation studies using NPCs or NSCs plus microglia. Microglia and neural cells were cultured in neural-cell-specific differentiation medium (DMEM/F12-based medium for NSCs or neurobasal-based medium for NPCs; see above). Half of the medium was changed every other day and cells were fixed for immunostaining 96 h after starting coculture. For gene expression analysis, NSCs were lysed with Qiazol (QIAGEN) 48 h after transfection. RNA was extracted and subjected to RT-PCR as described above.
Statistical analysis.
All data were normally distributed and presented as mean values ± SEM. In the case of single mean comparisons, data were analyzed by Student's t test. In the case of multiple mean comparisons, data were analyzed by one-way ANOVA and Tukey's post hoc or two-way repeated measures ANOVA using Prism 4.0c (GraphPad Software). p < 0.05 was regarded as a significant difference.
Results
miR-155 is essential for robust IL6 gene induction in microglia
miR-155 targets Suppressor of Cytokine signaling-1 (SOCS1), suggesting that miR-155 may be critical for driving cytokine expression under proinflammatory conditions (Betel et al., 2008). In WT microglia, LPS stimulation significantly increased expression of the proinflammatory cytokines IL6, IL-1β, Nitric Oxide Synthase-2 (NOS2), and Tumor Necrosis Factor-α (TNFα), which were significantly reduced in miR-155−/− microglia (Fig. 1A). Of this group, LPS-induced IL6 gene induction showed the most significant reduction by deletion of miR-155 (WT, 16,000-fold; miR-155−/−, 32-fold; p < 0.001 WT vs miR-155−/−). To further determine the role of miR-155 in IL6 gene induction, we compared the effect of LNA-based anti-miR-155 inhibition or genetic deletion of miR-155 on IL6 mRNA expression in microglia. LPS stimulation led to a significant increase in miR-155 expression in WT microglia compared with PBS-treated control (64-fold increase, p < 0.001 ΔΔCT LPS vs PBS group, n = 3–4/group), which was ablated in miR-155−/− microglia. We observed a significant difference in LPS-induced miR-155 expression between WT and miR-155-silenced groups (Fig. 1B, left, 64- vs 4-fold increase, p < 0.05 WT vs anti-miR-155 LNA-transfected microglia). Src-homology-2 containing inositol phosphatase (SHIP1, also known as INPP5D), a known target normally suppressed by miR-155 (Wang et al., 2014), showed significant reduction by LPS treatment in WT microglia (>32-fold suppression). This was completely ablated in LPS-stimulated miR-155−/− microglia (p < 0.001 WT ΔΔCT vs miR-155−/− ΔΔCT, Fig. 1B, middle) and significantly dampened in anti-miR155-treated LPS-stimulated microglia (>8-fold suppression, p < 0.05 WT ΔΔCT vs anti-miR155-treated ΔΔCT). There was a significant (p < 0.001) reduction in IL6 mRNA expression after LPS stimulation by knock-out (∼15,820-fold reduction) or silencing (∼15,968-fold reduction) of miR-155 compared with WT microglia (Fig. 1B, right), demonstrating that miR-155 is essential for robust IL6 expression in response to inflammatory challenge.
Figure 1.
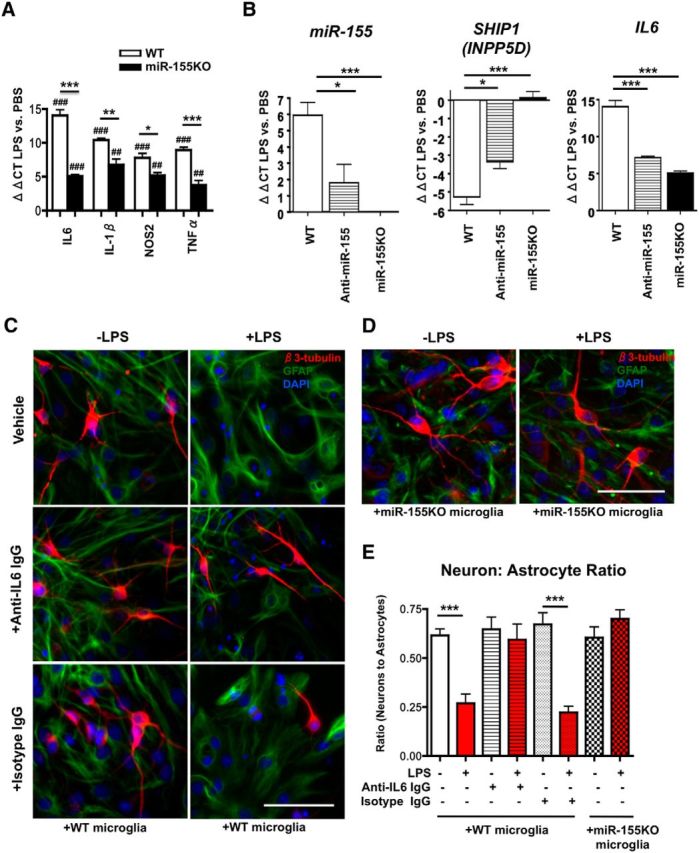
miR-155 is critical for robust LPS-induced IL6 gene induction. A, B, Microglial miR and mRNA expression after LPS stimulation in vitro. Acutely isolated neonatal murine microglia from WT or miR-155−/− (miR-155KO) mice were plated and stimulated with PBS or LPS (20 ng/ml) for 4 h. Total RNA including miRs was extracted and subjected to RT-PCR for IL6, IL-1β, NOS2, and TNFα (A) or miR-155 (left), SHIP1 (middle), and IL6 (right) (B). Graphs show ΔΔCT value of LPS-treated microglia versus PBS-treated microglia. ***p < 0.001, **p < 0.01, and *p < 0.05 versus WT group; ###p < 0.001, ##p < 0.01, and #p < 0.05 versus PBS-treated group as determined by 1-way ANOVA and Tukey post hoc. Data are shown as mean ± SEM. C, IL6 contributes to LPS-induced decrease in neural differentiation in vitro. Top, 4 h LPS stimulation (20 ng/ml) of microglia leads to significant reduction in βIII-Tubulin+ neuron (red) to GFAP+ astrocyte (green) ratio in cocultured NSCs (NSCs; pictured in C and D), corrected by treatment with anti-IL6 antibody (middle) but not isotype control antibody (bottom). D, miR-155 knock-out in microglia rescues LPS-induced decrease in neuron: astrocyte ratio of cocultured NSCs (pictured). For C and D, 20× objective original magnification; scale bars, 100 μm; nuclei shown in blue (DAPI). E, Quantification of neuron: astrocyte ratio as described in C and D. White bars, NSCs cocultured with PBS-treated microglia; red bars, NSCs cocultured with LPS-treated microglia. n = 3–4 wells per group. ***p < 0.001 as determined by 1-way ANOVA and Tukey post hoc. Data are shown as mean ± SEM.
miR-155 and IL6 contribute to microglial-induced neurogenic deficits in vitro
We hypothesized that inflammation-induced neurogenic suppression is caused by miR-155's regulation of neuropoietic cytokines such as IL6. To determine the effect of miR-155 and IL6 on cell fate during inflammatory challenge, we used an in vitro transwell coculture system with murine embryonic NSCs in a lower chamber and murine microglia in an upper chamber, which allowed secretory factor communication of the two cell types between compartments without any confounding effects of cell-to-cell contact. Microglia were stimulated with LPS or vehicle (PBS), and then cocultured in transwells above NSCs for 5 d in the differentiation condition. LPS stimulation of WT microglia led to a significant decrease in the neuron to astrocyte ratio, whereas treatment with anti-IL6-neutralizing antibody mitigated LPS-induced astrogliogenic differentiation (identified by glial fibrillary acidic protein; GFAP) and restored neural differentiation (identified by βIII-Tubulin) (Fig. 1C,E). Similarly, when NSCs were cocultured with miR-155−/− microglia, LPS treatment of microglia had no effect on neural differentiation (Fig. 1D,E). These results suggest that LPS-treated microglia induce gliogenesis of NSCs through induction of miR-155 and IL6 and that miR-155 regulates proinflammatory cytokine expression, including IL6, in microglia.
Genetic ablation of miR-155 restores inflammation-induced neurogenic deficits in vivo
TLR4-activation-induced inflammation leads to hippocampal neurogenic abnormalities, including proliferation, differentiation, and synapse formation. To investigate whether miR-155 deletion rescues inflammation-induced neurogenic deficits, we used a central inflammation mouse model in which 7-week old WT or miR-155−/− mice were intracerebroventricularly injected with LPS (1 μg in 1 μl) or saline (1 μl), followed by a series of intraperitoneal BrdU injections to mark proliferating cells. Five days after inflammatory challenge, animals were killed and brains were removed for immunohistochemical analysis of the hippocampal DG (Fig. 2A,B). We observed a significant reduction in BrdU+ and DCX+ (a marker of immature neurons) cells in the DG of LPS-treated WT mice versus saline controls (Fig. 2C–E), consistent with previous reports (Monje et al., 2003). However, miR-155−/− mice showed no difference in BrdU or DCX expression in the DG after intracerebroventricular injection of saline or LPS (Fig. 2C–E). This provides evidence that miR-155 is essential for LPS-induced hippocampal neurogenic deficits.
Figure 2.

Disruption of miR-155 leads to reversal of inflammation-induced decrease in NSC proliferation and neural differentiation in the DG. A, Diagram of the hippocampal DG. ML, Molecular layer; CA, cornu ammonis. B, Timeline of experimental design. C, Representative images of inflammation-induced changes in DCX (green; immature neurons), BrdU (red; proliferating cells), and DAPI (blue; nuclei) expression in the DG of WT and miR-155−/− (155KO) mice treated with saline or LPS (1 μg) intracerebroventricularly at 7 weeks of age. Scale bar, 100 μm. D, Quantification of total BrdU+ cells in the DG. E, DCX fluorescence intensity in the DG (procedure-defined units, p.d.u.). n = at least 10 images counted from 7 animals/ group. ***p < 0.001 by 1-way ANOVA and Tukey post hoc. Data are shown as mean ± SEM.
Genetic ablation of miR-155 restores inflammation-induced alterations in microglial morphology and IL6 expression
To investigate the effect of miR-155 on microglial density and phenotype in inflammatory conditions, we performed detailed analysis of microglial morphology using the microglial marker ionized calcium-binding adapter molecule- 1 (IBA1). There was no change in the density of microglia overall in the hilus, SGZ and GCL regions between groups (Fig. 3A,B). LPS treatment significantly increased the proportion of amoeboid out of total microglia in WT mice (p < 0.05) (Fig. 3A,C), suggesting an increase in proinflammatory microglial activation phenotype. This effect was not seen in miR-155−/− mice, indicating that miR-155 mediates the microglial innate immune response after LPS challenge.
Figure 3.

miR-155 deletion diminishes LPS-induced microglial activation and IL6 protein levels. A, Representative images of inflammation-induced changes in microglial morphology (ionized calcium binding adaptor protein-1, IBA1, green, microglial marker; DAPI, blue, nuclei marker) in the DG (including GCL, SGZ, and hilus) of WT and miR-155−/− (155KO) mice treated with saline or LPS (1 μg) intracerebroventricular at 7 weeks of age. Top left, Labeling of GCL and hilus; refer to Figure 2A for the diagram of hippocampus. B, Quantification of total IBA1+ cells in DG (including SGZ, GCL, and hilus; Fig. 2A) normalized to the size of area. C, IBA1+ microglial cell morphology shown as proportion of amoeboid out of total IBA1+ cells. D, IL6 protein expression in whole brain measured by ELISA. n = 3 animals per group; ****p < 0.0001 and *p < 0.05 as determined by 1-way ANOVA and Tukey post hoc. Data are shown as mean ± SEM.
To determine whether miR-155 regulates IL6 protein expression in our in vivo inflammation model, total protein was extracted from whole forebrains for IL6 ELISA. LPS treatment significantly increased IL6 levels in WT mice compared with saline (p < 0.001), whereas there was no significant difference between LPS- and saline-treated miR-155−/− mice (Fig. 3D). These results show that loss of miR-155 prevents LPS-induced hippocampal DG neurogenic deficits, amoeboidal activation of microglia, and IL6 protein expression in vivo.
Enhanced miR-155 expression leads to abnormalities in proliferation, differentiation, and migration of NSCs
To determine whether miR-155 gene induction itself is sufficient to cause SGZ neurogenic deficits, we used a Cre-recombinase- and DOX-inducible miR-155 transgenic mouse line, NesCre8;miR-155LSLtTA, which displays nestin-promoter-driven Cre-mediated expression of miR-155 in neural and hematopoietic stem cells, including microglia. To investigate the effect of miR-155 gene induction both throughout prenatal and postnatal life and only during adulthood, we generated NesCre8;miR155LSLtTA mice that were fed either regular chow to induce miR-155 expression or chow with DOX to deactivate enhanced expression, as described previously (Babar et al., 2012; Fig. 4A). Mice from 4 groups (control, miR155-hi, miR155- lo, and miR155-hi-adult; n = 4–5 animals/group) were killed at 7–8 weeks of age for neuropathological analysis.
During postnatal neurogenesis, NSCs proliferate along the SGZ (Fig. 2A) and differentiating neurons express early neuronal markers such as DCX, forming a clearly delineated SGZ, and then migrate via radial-glia-like cells toward the outer molecular layer across the GCL (Fig. 5B). The overall number of DCX+ immature neurons in the DG (SGZ and GCL) was significantly reduced in miR155-hi and miR155-hi-adult mice compared with control (p < 0.01), with a nonsignificant reduction in miR155-lo mice (Fig. 4B,C). Most DCX+ cells were located in an organized fashion along the SGZ in control mice. However, miR155-lo and miR155-hi-adult mice showed significantly fewer DCX+ cells along the SGZ compared with control and miR155-hi mice showed a further reduction in DCX+ cells in the SGZ that was significantly lower than both DOX-treated groups. Strikingly, miR155-hi mice showed aberrantly oriented DCX+ cells penetrated into the GCL with almost no recognizable SGZ compared with control, with an ∼8-fold increase in DCX+ cells in the GCL compared with control. miR155-hi-adult mice showed a significant decrease in DCX+ cells in the SGZ compared with control and miR155-lo mice showed a trend toward decreased DCX+ cells in the SGZ (Fig. 4B,D). In miR155-hi mice, DCX+ cell processes were markedly reduced in length and not oriented in the regular direction across the GCL toward the outer molecular layer. This abnormal localization, shortened processes, and aberrant orientation of DCX+ cells in the GCL were visually apparent (Fig. 4B, right, second from top).
Figure 5.

Elevated miR-155 leads to ectopic localization of radial-glia-like cells in the DG. A, Representative images of GFAP+ radial-glia-like cells in the SGZ and GCL in control, miR155-hi, miR155-lo, and miR155-hi-adult DG, showing their miR155-induced mislocalization. Original magnification = 40× objective. Scale bar, 100 μm. Arrowheads indicate ectopic GFAP+ radial-glia-like cell bodies. B, Diagram of DG showing radial-glia-like (type 1 progenitor) cells with normal cell body location in the SGZ. C, Total GFAP+ radial-glia-like cells in the SGZ per millimeter revealed no significant differences between groups. D, Ratio of GFAP+ cells in the SGZ versus GCL. n = 10–20 brain sections per group. Scale bar, 100 μm, Original objective = 40×. *p < 0.05 by 1-way ANOVA and Tukey post hoc. Data are shown as mean ± SEM.
To determine whether miR-155 expression leads to defective migration of NSCs, we assessed the number and location of GFAP+ radial-glia-like cells (recognized by their long singular processes) in the DG. There was no difference in overall number of GFAP+ radial-glia-like cells in the SGZ and GCL between the four groups (Fig. 5A,C). However, in a similar manner to DCX+ cells, miR155-hi mice showed a significantly increased ratio of radial-glia-like cells penetrated into the GCL and shortened processes in abnormal orientation compared with control (Fig. 5A,D).
To estimate the number of proliferating cells, we used Ki67, a protein expressed in all dividing cells during interphase and mitosis. There was an increase in the number of Ki67+ cells in miR155-hi mice, with a greater effect in lifetime enhancement of miR-155 expression compared with only during adulthood (control, 7.00 ± 0.29; miR155-hi, 21.64 ± 0.92; miR155-lo, 9.69 ± 0.32; miR155-hi-adult, 13.0 ± 0.35). Most Ki67+ cells in all groups were located along the SGZ (Fig. 6A,B). We observed a significant reduction in immature neurons in the DG with enhanced miR-155 expression. To determine whether miR-155 induction leads to increased astrocytes, we counted GFAP+ cells in the hilus and outer molecular layer of the hippocampus, possible sites of migrated differentiated NSCs. We found a significant increase in GFAP+ cells in the outer molecular layer of miR155-hi mice (p < 0.01), but not the miR155-lo or miR155-hi-adult groups compared with control (Fig. 7A,B). There was no difference in GFAP+ cell density in the hilus between groups (Fig. 7C,D).
Figure 6.
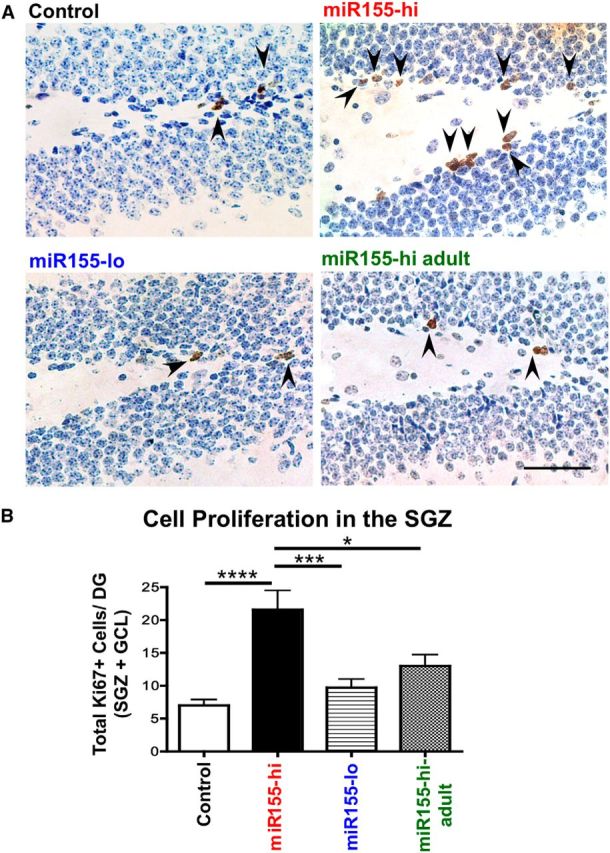
miR-155 elevation increases proliferation in the DG. A, Representative images of Ki67 staining (a cell proliferation marker) in control, miR155-hi, miR155-lo, and miR155-hi-adult DG, with hematoxylin counterstaining. Arrows indicate Ki67+ proliferating cells. B, Quantification of Ki67+ cells in the DG. Total number of Ki67+ cells per DG was counted in at least 15 sections per group from at least 2 different animals per group and normalized by the area size. Scale bar, 100 μm, Original objective = 10×. ****p < 0.0001, ***p < 0.001, and *p < 0.05 as determined by 1-way ANOVA and Tukey post hoc. Data are shown as mean ± SEM.
Figure 7.

Transgenic miR-155 expression increases astrocytes in the molecular layer of the DG. A, Representative images of GFAP+ astrocytes in the molecular layer (see Fig. 2A diagram) in control, miR155-hi, miR155-lo, and miR155-hi-adult mice. B, Total number of GFAP+ astrocytes per square millimeter in the molecular layer; n = 3–5 animals per group. Scale bar, 100 μm, Original objective = 10×. **p < 0.01 as determined by 1-way ANOVA and Tukey post hoc. Data are shown as mean ± SEM. C, Representative images of GFAP+ astrocytes in the DG in control, miR155-hi, miR155-lo, and miR155-hi-adult brains. Scale bar, 100 μm. Original objective = 10×. Inset shows magnification of microglia in hilus region. D, Total number of GFAP+ astrocytes per square millimeter in the hilus quantified from n = 3–5 animals per group. There were no significant differences as determined by 1-way ANOVA.
Enhanced miR-155 expression leads to increased microglial number and amoeboid phenotype in the DG
To investigate microglial density and phenotype in the DG, we analyzed IBA1+ cells by immunohistochemistry. miR155-hi mice showed an ∼80% increase in total IBA1+ cell density in the SGZ/GCL and hilus and there was a slight but nonsignificant increase in miR-155-lo mice versus control (Fig. 8A,B). Enhanced miR-155 expression both throughout life and only during adulthood led to increased proportion of amoeboid out of total microglia in the DG compared with control. Detailed analysis of microglial morphology revealed that the increased proportion of amoeboid microglia in miR-155-overexpressing mice is mainly in the SGZ/GCL region (Fig. 8C, black bars) rather than the hilus, which showed no significant differences in amoeboid versus ramified microglia (Fig. 8C, white bars).
Figure 8.
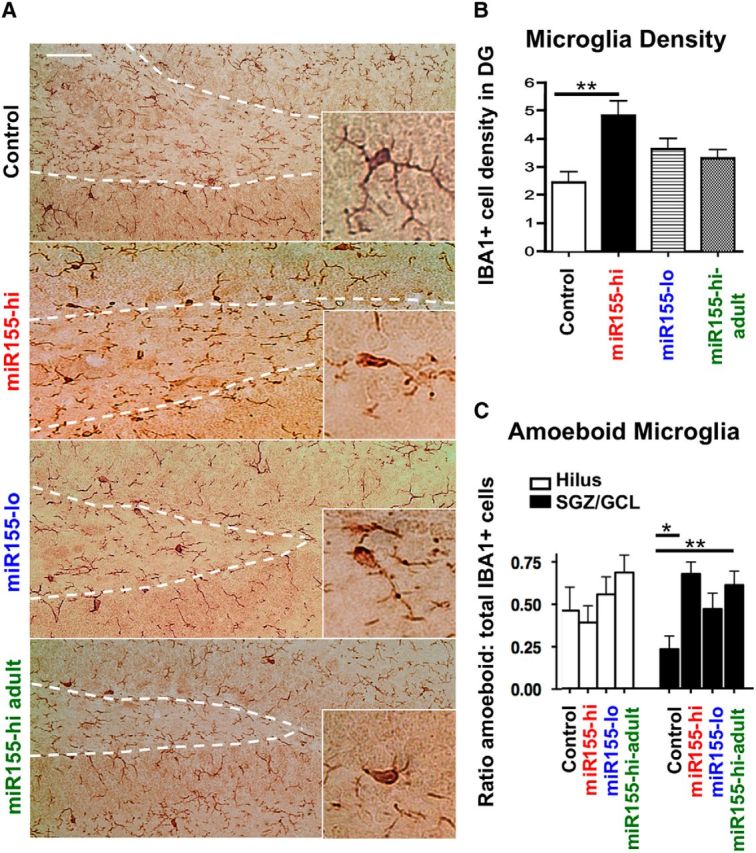
Elevated miR-155 increases microglia density in the DG and amoeboid morphology in the SGZ and GCL, but not in the hilus. A, Representative images of miR-155-induced changes in IBA1+ microglia morphology in the DG. Scale bar, 100 μm. Original magnification = 20×. Inset shows high-magnification representative IBA1+ cells. B, Density of IBA1+ cells in the DG, including SGZ, GCL, and hilus (see Fig. 2A diagram). C, Proportion of amoeboid versus total IBA1+ microglia in the hilus (white bars) and the SGZ/GCL regions (black bars) as quantified according to the microglia morphology. Morphology characterization criteria was modified from Lawson et al. (1990). n = 10–20 images counted from at least 2 animals per group. *p < 0.05 as determined by 1-way ANOVA and Tukey post hoc. Data are shown as mean ± SEM.
Cell-autonomous and microglial effects of enhanced miR-155 expression on NSC proliferation and differentiation in vitro
NesCre8;miR-155LSLtTA mice express miR-155 in any cell previously expressing nestin, including NSCs, astrocytes, neurons, and microglia. To clarify the cell-type-autonomous effects of miR-155 expression on NSC proliferation, we transfected mouse embryonic NSCs with mock transfection (lipofectamine only), control miR mimic, or pre-miR-155 mimic, and cultured cells in proliferation medium. Cells were treated with BrdU 24 h after transfection and fixed 48 h after transfection. A total of 94–98% of all cells were nestin+, demonstrating purity of the NSC culture (Fig. 9A,B). There was no difference in the population of Ki67+/nestin+ double-positive cells (cells in the cell cycle) between groups (Fig. 9A,C). Similarly, there was no difference in the population of BrdU+ cells (incorporated during the S-phase of the cell cycle) between groups (Fig. 9D,E). To determine the cell-type-autonomous effects of miR-155 expression on NSCs in differentiation conditions, we repeated the mimic transfection and cultured NSCs in differentiation medium for 96 h. The number of DCX+ neurons with intact nuclei (signifying live cells at the time of fixation) was significantly reduced by pre-miR-155 transfection to NSCs (Fig. 10A,B, black bars), whereas there was no change in the number of GFAP+ cells with intact nuclei (Fig. 10A,B, white bars). Further analysis revealed that miR-155-transfected NSCs showed increased percentage of fragmented nuclei (apoptotic cells) (Fig. 10C) and increased cleaved caspase-3 immunoreactivity (Fig. 10D), confirming that pre-miR-155 transfection to NSCs leads to increased apoptosis. The mimic transfection efficiency was 70–80% as confirmed by detection of the Cy3-labeled control pre-miR mimic, visible in endosomal puncta in the cell soma at 24, 48, and 96 h after transfection (Fig. 10E, 96 h).
Figure 9.
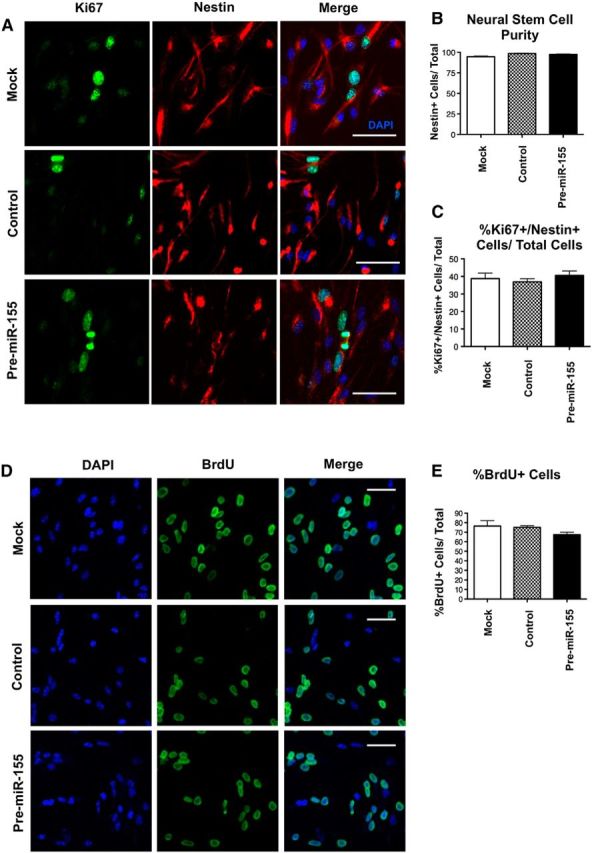
Cell-autonomous effects of miR-155 on NSC proliferation in vitro. A, Representative images of NSCs transfected with mock transfection (lipofectamine only), control Cy3-labeled miR mimic, or pre-miR-155 mimic and cultured for 48 h. Green, Ki67 (proliferating cells); red, nestin (stem cells); blue, DAPI (nuclei). Scale bar, 50 μm. B, Quantification of NSC purity shown as the percentage of nestin+ cells out of total cells. C, Quantification of NSCs in the cell cycle shown as the percentage of Ki67+/nestin+ cells out of total DAPI cells. D, Representative images of NSCs transfected with mock transfection, control Cy3-labeled miR mimic, or pre-miR-155 mimic and cultured for 48 h. BrdU was added to cells 24 h after plating and cells were fixed 24 h later. Green, BrdU (cells in S-phase of cell cycle); blue, DAPI (nuclei). Scale bar, 50 μm. E, Quantification of percentage BrdU+ cells out of total cells in D. For B and D, n = at least 10 20× original magnification images were quantified per group. No significant differences determined by 1-way ANOVA. Data are shown as mean ± SEM.
Figure 10.

Cell-autonomous effects of miR-155 on neural differentiation, survival, and migration molecules of NSCs in vitro. A, Representative images of NSCs transfected with mock transfection (lipofectamine only), scramble Cy3-labeled miR mimic, or pre-miR-155 mimic and cultured for 72 h in differentiation conditions. Green, DCX; red, GFAP; blue, DAPI. Original magnification = 20×. Scale bar, 50 μm. B, Percentage DCX+ (black bars) and GFAP+ (white bars) cells with whole nuclei (live cells at fixation time) out of total cells. C, Percentage of cells with fragmented nuclei (apoptotic cells) out of total cells. D, Cleaved caspase-3 fluorescence intensity in NSCs transfected with mock, control, or pre-miR-155 mimic (procedure defined units, p.d.u; B–D) at least 10 20× original magnification images counted/ measured per group. **p < 0.01 and *p < 0.05 as determined by 1-way ANOVA and Tukey post hoc. E, Transfection efficiency of Cy3-labeled control miR mimic. Green, Cy3; red, GFAP (astrocytes); blue, DAPI (nuclei). F, RT-PCR target gene expression analysis of NSCs transfected with control or pre-miR-155 mimic. Left, Primer set 1 (see Materials and Methods for sequences), Right, Primer set 2. **ΔΔCT p < 0.01 versus control, mimic-transfected NSCs; ###p < 0.001, ##p < 0.01, and #p < 0.05 versus mock-transfected NSCs as determined by 1-way ANOVA and Tukey post hoc. Data are shown as mean ± SEM.
Ras homolog gene family, member A (RhoA) is a small GTPase protein known to regulate the actin cytoskeleton. RHOA is a validated miR-155 target (Hsu et al., 2014) and is downregulated by miR-155 expression in epithelial cells (Kong et al., 2008). RhoA is essential for proper neuronal migration (Katayama et al., 2013) and maintenance of apical-basal NPC polarity (Herzog et al., 2011). To elucidate whether RhoA plays a role in the molecular mechanism of abnormal neuronal migration in miR155-hi mice, we transfected NSCs with mock transfection (lipofectamine only), control miR mimic, or pre-miR-155 mimic. After 96 h of differentiation, cells were lysed and RNA was extracted for RT-PCR. Pre-miR-155-treated NSCs showed a significant reduction of RHOA compared with mock and control mimic-treated groups, confirmed with two different RHOA primer sets (Fig. 10F).
To determine the effects of microglial miR-155 expression on NSC proliferation, microglia were transfected with mock transfection, control miR mimic, or pre-miR-155 mimic and cocultured with NSCs. NSCs cocultured with pre-miR-155-transfected microglia for 48 h showed a significantly increased percentage of Ki67+ cells compared with NSCs with control, mimic-transfected microglia or NSCs cultured alone (Fig. 11A,B). Coculture with microglia increased NSC proliferation (marked by BrdU incorporation) in all groups compared with NSCs cultured without microglia and coculture with pre-miR-155-transfected microglia led to a further significant increase compared with NSCs with control, mimic-transfected microglia (Fig. 11A,C). In the differentiation assay, NSCs cultured without microglia showed significantly increased percentage of GFAP+ glial cells, which was reduced by coculture with mock or control, mimic-transfected microglia. However, pre-miR-155-transfected microglia recapitulated the increased astrogliogenic NSC cell fate (Fig. 12A,B). Next, NPCs were cocultured with mock- or miR-mimic-transfected microglia. Coculture with mock- or control, mimic-transfected microglia significantly increased neural differentiation of NSCs as measured by the percentage of DCX+ neurons compared with NSCs cultured alone. There was no difference in the number of DCX+ cells in mock versus control, mimic-transfected microglia. However, microglia's neurogenic effect was mitigated by pre-miR-155 transfection to microglia (Fig. 12C,D). These data demonstrate that expression of miR-155 in microglia has a significant, nonautonomous effect on the proliferation and differentiation of NSCs.
Figure 11.
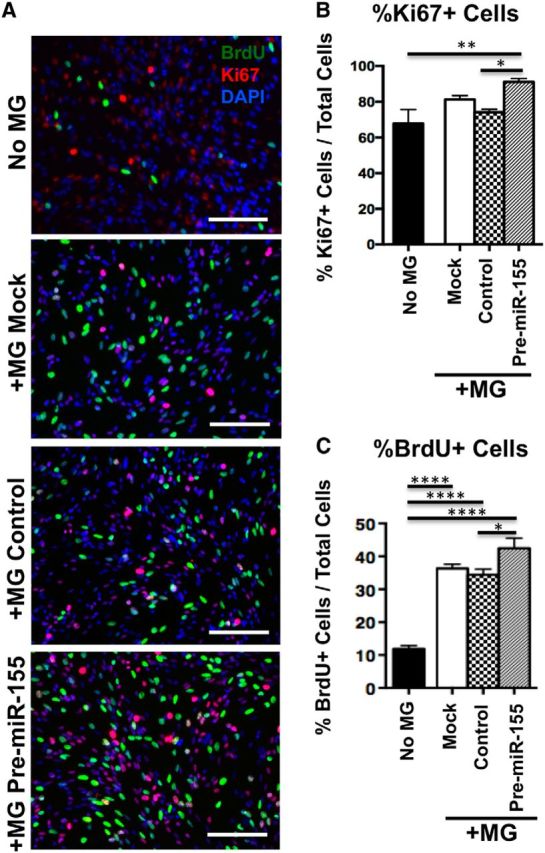
Non-cell-autonomous effect of miR-155 expression in microglia on NSC proliferation. A, Representative images of NSCs (pictured) indirectly cocultured with mock, scramble, or pre-miR-155 mimic-transfected microglia (MG, not pictured) in transwells for 48 h. BrdU was added to NSC medium 2 h before fixation. Red, Ki67; green, BrdU; blue, DAPI. Original magnification = 20×. Scale bar, 200 μm. B, C, Quantification of NSCs pictured in A, percentage of Ki67+ NSCs (B), and percentage of BrdU+ NSCs (C), determined from at least 10 20× original magnification images. ****p < 0.0001, **p < 0.01, and *p < 0.05 as determined by 1-way ANOVA and Tukey post hoc. Data are shown as mean ± SEM.
Figure 12.
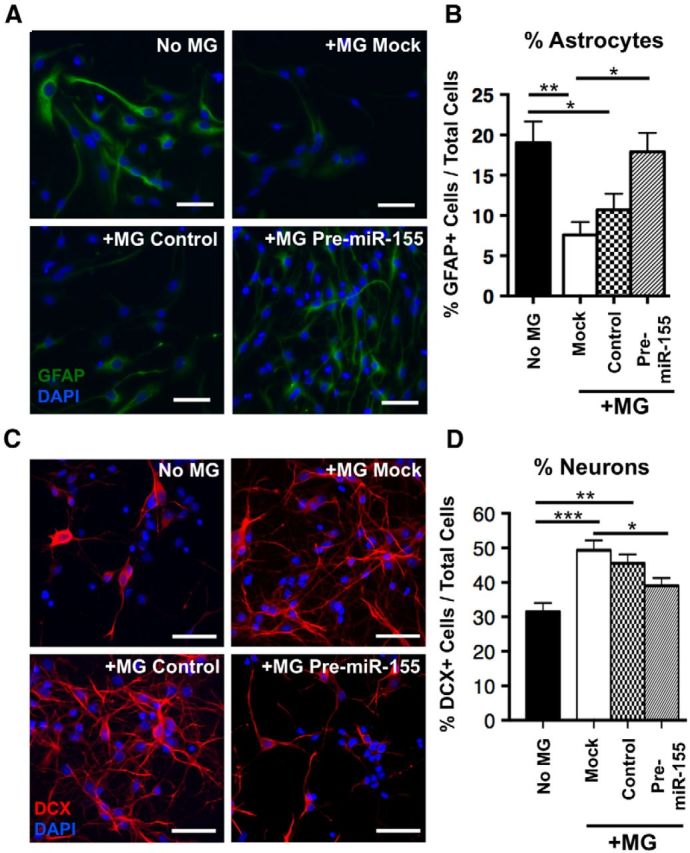
Non-cell-autonomous effect of miR-155 expression in microglia on neural differentiation. A, Representative images of NSCs (pictured) cocultured with mock, scramble, or pre-miR-155 mimic–transfected microglia (in transwells, not pictured) in differentiation conditions. Scale bar, 200 μm. B, Quantification of NSCs pictured in A, percentage of astrocytes (GFAP+ cells, green) out of total cells. C, Representative images of NPCs (pictured) cocultured with mock, scramble, or pre-miR-155 mimic-transfected microglia (in transwells, not pictured) in differentiation conditions for 96 h. Scale bar, 200 μm. D, Quantification of NPCs pictured in C showing percentage neurons (DCX+ cells) out of total cells. For B and D microglia (MG), at least 10 20× magnification images were counted per group. ***p < 0.001, **p < 0.01, and *p < 0.05 as determined by 1-way ANOVA and Tukey post hoc. Data are shown as mean ± SEM.
Discussion
Knowledge of the precise mechanisms connecting neuroinflammation and neurogenesis may aid in determining specific therapeutic targets for improving neurogenic abnormalities. The evidence presented here shows that genetic ablation of miR-155 restores inflammation-induced neurogenic deficits and microglial activation and decreases IL6 gene and protein expression. Enhanced miR-155 expression is causal and sufficient for aberrations in microglial activation phenotype and proliferation, migration, and differentiation of NSCs in the hippocampus.
How miR-155 increases IL6 expression is unknown. There are no predicted miR-155-binding sites in the 3′-UTR of the IL6 mRNA transcript (Griffiths-Jones et al., 2008; Kozomara and Griffiths-Jones, 2014). However, SOCS1, which normally inhibits IL6/IL6ST (gp130) JAK/STAT3 signaling, is a validated murine and human miR-155 target (Betel et al., 2008). In human microglia and macrophages, miR-155 elicits control of proinflammatory responses, including IL6 induction, putatively via SOCS1 repression (Moore et al., 2013). SOCS1 repression enhances the IL6/IL6ST (gp130) JAK/STAT3 axis; STAT3 activation in turn activates transcription of IL6 and progliogenic genes including GFAP, skewing NSC differentiation to the glial lineage (Peng et al., 2011). This is in agreement with our observations that blocking miR-155 or IL6 in microglia prevents LPS-induced reduction in neural differentiation of cocultured NSCs. Similarly, miR-155-overexpressing microglia are gliogenic to cocultured NSCs.
To pinpoint whether miR-155 expression alters neurogenesis and microglial activation directly, we took advantage of a recently created nestin-promoter-driven and DOX-inducible miR-155 transgenic mouse line, NesCre8;miR-155LSLtTA. This mouse model permits temporal control of miR-155 in a cell-type-specific manner, enabling comparisons between enhanced expression throughout life or only during adulthood. This is an invaluable tool for understanding the influence of pathological miR-155 expression on abnormal developmental and postnatal neurogenesis.
Abnormal granular localization and polarity of immature neurons and radial glia-like cells is an unexpected result of miR-155 overexpression in vivo. NSCs migrate from the ventricular zone toward target areas via the radial projection of GFAP+ radial glial cells prenatally (Rakic, 1988) and postnatally (Tramontin et al., 2003). A similar mechanism is suggested for radial-glia-like cells in the postnatal hippocampus, guiding development of the DG and postnatal NSC migration from the SGZ toward the outer molecular layer (Xu et al., 2015). Mislocalization of radial-glia-like cell bodies and short, directionally abnormal processes in miR155-overexpressing mice suggest that ectopic presence of immature neurons may be caused by the prior mislocalization of radial glial cell bodies to the GCL. Interestingly, DCX+ differentiated NPCs show drastically shorter neuritic processes by either being cultured in the absence of microglia or by coculture with miR-155-overexpressing microglia, raising the possibility that microglia secrete guidance molecules and that this guidance role is disrupted by miR-155 expression. Neuronal and radial glial cell mislocalization is also seen in miR155-hi-adult mice, suggesting that both acute and long-term miR-155 expression can significantly disrupt postnatal neural migration.
Rho GTPases, which regulate actin and microtubule cytoskeletons, cell polarity, and adhesion, are central to neuronal migration (Govek et al., 2011). RhoA, a validated miR-155 target in epithelial cells (Kong et al., 2008; Hsu et al., 2014), regulates neural migration prenatally (Pacary et al., 2011) and postnatally (Ota et al., 2014). We show that RHOA is downregulated by miR-155 overexpression in differentiated NSCs. RhoA is required for both normal cortical interneuron migration (Katayama et al., 2013) and maintenance of apical-basal NPC polarity in spinal cord epithelium (Herzog et al., 2011). A regulatory role of RhoA has recently been highlighted in the morphological and synaptic maturation of adult-born dentate granular cells (Vadodaria and Jessberger, 2013). These data suggest that RHOA downregulation by miR-155 contributes to improper migration and cell polarity in the DG of miR-155-overexpressing mice. Considering this relationship, pathological miR-155 expression could critically interfere with preprogrammed neural migration processes during neurodevelopment. Aberrant migration leads to defective cortical layering and is seen in severe pediatric CNS disorders including Down syndrome and autism spectrum disorders (Wisniewski, 1990; Wegiel et al., 2010). The role of neural migration in postnatal adult neurogenesis is less explored; our study encourages investigation of how increased miR-155 expression during adulthood, such as that seen in human ALS (Koval et al., 2013) and Down syndrome (Wang et al., 2013) adult patient brain, may contribute to the pathogenesis of these disorders.
Enhancement of miR-155 expression recapitulates some, but not all, effects of LPS treatment in the DG. LPS challenge leads to decreased proliferating cells, whereas miR-155 expression in microglia leads to increased NSC proliferation. LPS activates directly TLR4 and apoptosis signaling pathways (Gay and Gangloff, 2007; Schilling et al., 2013), which may not be activated by miR-155 alone. In contrast, miR-155 can act as an onco-miR. A recent study suggests that miR-155 is a master miR linking inflammation to cancer through targeting cancer-related miRs, which in turn regulate oncogene expression through the transcriptional repressor Ets-1 and the transcriptional activator C/EBP-β (Hu et al., 2014). Interestingly, stimulation of cancer cells with IL6, LPS, or the viral mimetic polyriboinosinic:polyribocytidylic acid [poly(I:C)] significantly enhances miR-155 expression, leading to cell proliferation (Jiang et al., 2010). This demonstrates that a variety of proinflammatory stimuli can upregulate miR-155.
miR-155 overexpression appears to mediate primary and secondary effects on neurogenesis. LPS is a ligand for TLR4, a receptor relatively specific to microglia in the brain (Bsibsi et al., 2002), supporting the notion that the effects of LPS on neurogenesis involve secondary signaling from LPS-stimulated microglia. Conversely, our NesCre8;miR-155LSLtTA mice overexpress miR-155 in nestin+ cells, which includes neurons, astrocytes, and NSCs in addition to microglia. In our in vitro study using a pre-miR-155 mimic, miR-155 overexpression had no cell-autonomous effect on NSC proliferation. Microglia had a proliferative effect on NSCs, which was augmented by microglial miR-155 overexpression. Similarly, microglia increased neural differentiation of NSCs, but miR-155 overexpression mitigated this effect. Together, these results suggest that microglia secrete proliferative and neurogenic factors that critically affect newborn brain cells and that miR-155 expression significantly alters these effects. In agreement with this, miR-155-overexpressing mice showed increased proliferation and molecular layer astrocytosis, yet decreased dentate granule neurons. Interestingly, miR-155's proliferative and proapoptotic effects may be directly related: several studies suggest that triggering cell cycle activation in differentiated neurons leads to apoptosis rather than cell division (Herrup et al., 2004; Kruman et al., 2004).
Amoeboid microglia found in miR155-overexpressing mice could include newborn parenchymal or infiltrated monocyte-derived microglia. In the adult SGZ, excess proliferating NSCs undergo apoptosis and are cleared by microglia (Sierra et al., 2010). This leads us to propose that heightened cell proliferation in miR-155-overexpressing mice leads to apoptosis and recruitment of microglia to the SGZ as a “cleanup” mechanism. Regardless of their origin in this context, our study of the miR-155-hi-adult group shows that microglia rapidly respond to miR-155: induction during adulthood specifically increases amoeboid microglia and reduces the number of immature neurons after only 1 week. A recent report suggests that M1 microglial activation is modulated by miR-155-mediated suppression of the anti-inflammatory transcription factor c-Maf (Su et al., 2014). Interestingly, these impacts of short miR-155 enhancement during adulthood recapitulate the effects of LPS challenge on microglial activation and neural cell death, supporting the idea that miR-155 orchestrates at least some of the LPS-induced neurogenic deficits.
Our findings have valuable implications for treating pediatric psychiatric disorders: miR-155 is elevated in Down syndrome (Wang et al., 2013), IL6 is increased in autistic patient brain (Wei et al., 2011), and increased systemic IL6 in childhood is associated with an increased risk of depression and psychosis in young adulthood (Khandaker et al., 2014). Accordingly, targeting the miR-155/IL6/STAT3 axis may be an effective intervention. We demonstrated that LNA- based anti-miR-155 can reduce microglial IL6 expression and correct neurogenic suppression in vitro, and genetic disruption of miR-155 rescues hippocampal neurogenesis in response to LPS stimulation in vivo. Novel therapeutics targeting miRs include miR mimics, ToughDecoy miR sponges, and LNA-modified anti-miR oligonucleotides. This opens the possibility for investigation of anti-miR-155 agents in the context of inflammation-related pediatric psychiatric disorders.
Footnotes
This work was supported by the National Institutes of Health (Training Grant 5T32GM008541 and Grant 7R21AG032600 to T.I.) and the PhRMA Foundation (M.E.W. and R.W.F.), the Jerome Lejeune Foundation (T.I.), and anonymous foundations. We thank Grant Yonemoto, Lisa Nguyen, Keri Omuro, and Alicia Van Enoo for their contributions to the study, Tarik Haydar for consultation and manuscript review, and Susan Leeman for critical review of the manuscript.
The authors declare no competing financial interests.
References
- Asai H, Ikezu S, Woodbury ME, Yonemoto GM, Cui L, Ikezu T. Accelerated neurodegeneration and neuroinflammation in transgenic mice expressing P301L tau mutant and tau-tubulin kinase 1. Am J Pathol. 2014;184:808–818. doi: 10.1016/j.ajpath.2013.11.026. [DOI] [PMC free article] [PubMed] [Google Scholar]
- Babar IA, Cheng CJ, Booth CJ, Liang X, Weidhaas JB, Saltzman WM, Slack FJ. Nanoparticle-based therapy in an in vivo microRNA-155 (miR-155)-dependent mouse model of lymphoma. Proc Natl Acad Sci U S A. 2012;109:E1695–E1704. doi: 10.1073/pnas.1201516109. [DOI] [PMC free article] [PubMed] [Google Scholar]
- Balasubramaniam B, Carter DA, Mayer EJ, Dick AD. Microglia derived IL-6 suppresses neurosphere generation from adult human retinal cell suspensions. Exp Eye Res. 2009;89:757–766. doi: 10.1016/j.exer.2009.06.019. [DOI] [PubMed] [Google Scholar]
- Baltimore D, Boldin MP, O'Connell RM, Rao DS, Taganov KD. MicroRNAs: new regulators of immune cell development and function. Nat Immunol. 2008;9:839–845. doi: 10.1038/ni.f.209. [DOI] [PubMed] [Google Scholar]
- Belarbi K, Jopson T, Tweedie D, Arellano C, Luo W, Greig NH, Rosi S. TNF-alpha protein synthesis inhibitor restores neuronal function and reverses cognitive deficits induced by chronic neuroinflammation. J Neuroinflammation. 2012;9:23. doi: 10.1186/1742-2094-9-23. [DOI] [PMC free article] [PubMed] [Google Scholar]
- Betel D, Wilson M, Gabow A, Marks DS, Sander C. The microRNA.org resource: targets and expression. Nucl Acids Res. 2008;36:D149–D153. doi: 10.1093/nar/gkm995. [DOI] [PMC free article] [PubMed] [Google Scholar]
- Bsibsi M, Ravid R, Gveric D, van Noort JM. Broad expression of Toll-like receptors in the human central nervous system. J Neuropathol Exp Neurol. 2002;61:1013–1021. doi: 10.1093/jnen/61.11.1013. [DOI] [PubMed] [Google Scholar]
- Butovsky O, Jedrychowski MP, Cialic R, Krasemann S, Murugaiyan G, Fanek Z, Greco DJ, Wu PM, Doykan CE, Kiner O, Lawson RJ, Frosch MP, Pochet N, Fatimy RE, Krichevsky AM, Gygi SP, Lassmann H, Berry J, Cudkowicz ME, Weiner HL. Targeting miR-155 restores abnormal microglia and attenuates disease in SOD1 mice. Ann Neurol. 2015;77:75–99. doi: 10.1002/ana.24304. [DOI] [PMC free article] [PubMed] [Google Scholar]
- Cardoso AL, Guedes JR, Pereira de Almeida L, Pedroso de Lima MC. miR-155 modulates microglia-mediated immune response by down-regulating SOCS-1 and promoting cytokine and nitric oxide production. Immunology. 2012;135:73–88. doi: 10.1111/j.1365-2567.2011.03514.x. [DOI] [PMC free article] [PubMed] [Google Scholar]
- Chugh D, Nilsson P, Afjei SA, Bakochi A, Ekdahl CT. Brain inflammation induces post-synaptic changes during early synapse formation in adult-born hippocampal neurons. Exp Neurol. 2013;250:176–188. doi: 10.1016/j.expneurol.2013.09.005. [DOI] [PubMed] [Google Scholar]
- Ekdahl CT, Claasen JH, Bonde S, Kokaia Z, Lindvall O. Inflammation is detrimental for neurogenesis in adult brain. Proc Natl Acad Sci U S A. 2003;100:13632–13637. doi: 10.1073/pnas.2234031100. [DOI] [PMC free article] [PubMed] [Google Scholar]
- Elton TS, Selemon H, Elton SM, Parinandi NL. Regulation of the MIR155 host gene in physiological and pathological processes. Gene. 2013;532:1–12. doi: 10.1016/j.gene.2012.12.009. [DOI] [PubMed] [Google Scholar]
- Freilich RW, Woodbury ME, Ikezu T. Integrated expression profiles of mRNA and miRNA in polarized primary murine microglia. PLoS One. 2013;8:e79416. doi: 10.1371/journal.pone.0079416. [DOI] [PMC free article] [PubMed] [Google Scholar]
- Gay NJ, Gangloff M. Structure and function of Toll receptors and their ligands. Annu Rev Biochem. 2007;76:141–165. doi: 10.1146/annurev.biochem.76.060305.151318. [DOI] [PubMed] [Google Scholar]
- Govek EE, Hatten ME, Van Aelst L. The role of Rho GTPase proteins in CNS neuronal migration. Dev Neurobiol. 2011;71:528–553. doi: 10.1002/dneu.20850. [DOI] [PMC free article] [PubMed] [Google Scholar]
- Griffiths-Jones S, Saini HK, van Dongen S, Enright AJ. miRBase: tools for microRNA genomics. Nucl Acids Res. 2008;36:D154–D158. doi: 10.1093/nar/gkm952. [DOI] [PMC free article] [PubMed] [Google Scholar]
- Guidi S, Bonasoni P, Ceccarelli C, Santini D, Gualtieri F, Ciani E, Bartesaghi R. Neurogenesis impairment and increased cell death reduce total neuron number in the hippocampal region of fetuses with Down syndrome. Brain Pathol. 2008;18:180–197. doi: 10.1111/j.1750-3639.2007.00113.x. [DOI] [PMC free article] [PubMed] [Google Scholar]
- Herrup K, Neve R, Ackerman SL, Copani A. Divide and die: cell cycle events as triggers of nerve cell death. J Neurosci. 2004;24:9232–9239. doi: 10.1523/JNEUROSCI.3347-04.2004. [DOI] [PMC free article] [PubMed] [Google Scholar]
- Herzog D, Loetscher P, van Hengel J, Knüsel S, Brakebusch C, Taylor V, Suter U, Relvas JB. The small GTPase RhoA is required to maintain spinal cord neuroepithelium organization and the neural stem cell pool. J Neurosci. 2011;31:5120–5130. doi: 10.1523/JNEUROSCI.4807-10.2011. [DOI] [PMC free article] [PubMed] [Google Scholar]
- Hsu SD, Tseng YT, Shrestha S, Lin YL, Khaleel A, Chou CH, Chu CF, Huang HY, Lin CM, Ho SY, Jian TY, Lin FM, Chang TH, Weng SL, Liao KW, Liao IE, Liu CC, Huang HD. miRTarBase update 2014: an information resource for experimentally validated miRNA-target interactions. Nucl Acids Res. 2014;42:D78–D85. doi: 10.1093/nar/gkt1266. [DOI] [PMC free article] [PubMed] [Google Scholar]
- Hu S, Zhu W, Zhang LF, Pei M, Liu MF. MicroRNA-155 broadly orchestrates inflammation-induced changes of microRNA expression in breast cancer. Cell Res. 2014;24:254–257. doi: 10.1038/cr.2013.137. [DOI] [PMC free article] [PubMed] [Google Scholar]
- Hutsler JJ, Zhang H. Increased dendritic spine densities on cortical projection neurons in autism spectrum disorders. Brain Res. 2010;1309:83–94. doi: 10.1016/j.brainres.2009.09.120. [DOI] [PubMed] [Google Scholar]
- Jiang S, Zhang HW, Lu MH, He XH, Li Y, Gu H, Liu MF, Wang ED. MicroRNA-155 functions as an OncomiR in breast cancer by targeting the suppressor of cytokine signaling 1 gene. Cancer Res. 2010;70:3119–3127. doi: 10.1158/0008-5472.CAN-09-4250. [DOI] [PubMed] [Google Scholar]
- Junker A. Pathophysiology of translational regulation by microRNAs in multiple sclerosis. FEBS Lett. 2011;585:3738–3746. doi: 10.1016/j.febslet.2011.03.052. [DOI] [PubMed] [Google Scholar]
- Katayama K, Imai F, Campbell K, Lang RA, Zheng Y, Yoshida Y. RhoA and Cdc42 are required in pre-migratory progenitors of the medial ganglionic eminence ventricular zone for proper cortical interneuron migration. Development. 2013;140:3139–3145. doi: 10.1242/dev.092585. [DOI] [PMC free article] [PubMed] [Google Scholar]
- Keck-Wherley J, Grover D, Bhattacharyya S, Xu X, Holman D, Lombardini ED, Verma R, Biswas R, Galdzicki Z. Abnormal microRNA expression in Ts65Dn hippocampus and whole blood: contributions to Down syndrome phenotypes. Dev Neurosci. 2011;33:451–467. doi: 10.1159/000330884. [DOI] [PMC free article] [PubMed] [Google Scholar]
- Khandaker GM, Pearson RM, Zammit S, Lewis G, Jones PB. Association of serum interleukin 6 and C-reactive protein in childhood with depression and psychosis in young adult life: a population-based longitudinal study. JAMA Psychiatry. 2014;71:1121–1128. doi: 10.1001/jamapsychiatry.2014.1332. [DOI] [PMC free article] [PubMed] [Google Scholar]
- Kiyota T, Ingraham KL, Swan RJ, Jacobsen MT, Andrews SJ, Ikezu T. AAV serotype 2/1-mediated gene delivery of anti-inflammatory interleukin-10 enhances neurogenesis and cognitive function in APP+PS1 mice. Gene Therapy. 2012;19:724–733. doi: 10.1038/gt.2011.126. [DOI] [PMC free article] [PubMed] [Google Scholar]
- Kong W, Yang H, He L, Zhao JJ, Coppola D, Dalton WS, Cheng JQ. MicroRNA-155 is regulated by the transforming growth factor beta/Smad pathway and contributes to epithelial cell plasticity by targeting RhoA. Mol Cell Biol. 2008;28:6773–6784. doi: 10.1128/MCB.00941-08. [DOI] [PMC free article] [PubMed] [Google Scholar]
- Koval ED, Shaner C, Zhang P, du Maine X, Fischer K, Tay J, Chau BN, Wu GF, Miller TM. Method for widespread microRNA-155 inhibition prolongs survival in ALS-model mice. Hum Mol Genet. 2013;22:4127–4135. doi: 10.1093/hmg/ddt261. [DOI] [PMC free article] [PubMed] [Google Scholar]
- Kozomara A, Griffiths-Jones S. miRBase: annotating high confidence microRNAs using deep sequencing data. Nucl Acids Res. 2014;42:D68–D73. doi: 10.1093/nar/gkt1181. [DOI] [PMC free article] [PubMed] [Google Scholar]
- Kruman II, Wersto RP, Cardozo-Pelaez F, Smilenov L, Chan SL, Chrest FJ, Emokpae R, Jr, Gorospe M, Mattson MP. Cell cycle activation linked to neuronal cell death initiated by DNA damage. Neuron. 2004;41:549–561. doi: 10.1016/S0896-6273(04)00017-0. [DOI] [PubMed] [Google Scholar]
- Lawson LJ, Perry VH, Dri P, Gordon S. Heterogeneity in the distribution and morphology of microglia in the normal adult mouse brain. Neuroscience. 1990;39:151–170. doi: 10.1016/0306-4522(90)90229-W. [DOI] [PubMed] [Google Scholar]
- Li YY, Alexandrov PN, Pogue AI, Zhao Y, Bhattacharjee S, Lukiw WJ. miRNA-155 upregulation and complement factor H deficits in Down's syndrome. Neuroreport. 2012;23:168–173. doi: 10.1097/WNR.0b013e32834f4eb4. [DOI] [PMC free article] [PubMed] [Google Scholar]
- Monje ML, Toda H, Palmer TD. Inflammatory blockade restores adult hippocampal neurogenesis. Science. 2003;302:1760–1765. doi: 10.1126/science.1088417. [DOI] [PubMed] [Google Scholar]
- Moore CS, Rao VT, Durafourt BA, Bedell BJ, Ludwin SK, Bar-Or A, Antel JP. miR-155 as a multiple sclerosis-relevant regulator of myeloid cell polarization. Ann Neurol. 2013;74:709–720. doi: 10.1002/ana.23967. [DOI] [PubMed] [Google Scholar]
- Murugaiyan G, Beynon V, Mittal A, Joller N, Weiner HL. Silencing microRNA-155 ameliorates experimental autoimmune encephalomyelitis. J Immunol. 2011;187:2213–2221. doi: 10.4049/jimmunol.1003952. [DOI] [PMC free article] [PubMed] [Google Scholar]
- Nakanishi M, Niidome T, Matsuda S, Akaike A, Kihara T, Sugimoto H. Microglia-derived interleukin-6 and leukaemia inhibitory factor promote astrocytic differentiation of neural stem/progenitor cells. Eur J Neurosci. 2007;25:649–658. doi: 10.1111/j.1460-9568.2007.05309.x. [DOI] [PubMed] [Google Scholar]
- Ota H, Hikita T, Sawada M, Nishioka T, Matsumoto M, Komura M, Ohno A, Kamiya Y, Miyamoto T, Asai N, Enomoto A, Takahashi M, Kaibuchi K, Sobue K, Sawamoto K. Speed control for neuronal migration in the postnatal brain by Gmip-mediated local inactivation of RhoA. Nat Commun. 2014;5:4532. doi: 10.1038/ncomms5532. [DOI] [PubMed] [Google Scholar]
- Pacary E, Heng J, Azzarelli R, Riou P, Castro D, Lebel-Potter M, Parras C, Bell DM, Ridley AJ, Parsons M, Guillemot F. Proneural transcription factors regulate different steps of cortical neuron migration through Rnd-mediated inhibition of RhoA signaling. Neuron. 2011;69:1069–1084. doi: 10.1016/j.neuron.2011.02.018. [DOI] [PMC free article] [PubMed] [Google Scholar]
- Paolicelli RC, Bolasco G, Pagani F, Maggi L, Scianni M, Panzanelli P, Giustetto M, Ferreira TA, Guiducci E, Dumas L, Ragozzino D, Gross CT. Synaptic pruning by microglia is necessary for normal brain development. Science. 2011;333:1456–1458. doi: 10.1126/science.1202529. [DOI] [PubMed] [Google Scholar]
- Peng H, Sun L, Jia B, Lan X, Zhu B, Wu Y, Zheng J. HIV-1-infected and immune-activated macrophages induce astrocytic differentiation of human cortical neural progenitor cells via the STAT3 pathway. PLoS One. 2011;6:e19439. doi: 10.1371/journal.pone.0019439. [DOI] [PMC free article] [PubMed] [Google Scholar]
- Ponomarev ED, Veremeyko T, Weiner HL. MicroRNAs are universal regulators of differentiation, activation, and polarization of microglia and macrophages in normal and diseased CNS. Glia. 2013;61:91–103. doi: 10.1002/glia.22363. [DOI] [PMC free article] [PubMed] [Google Scholar]
- Rakic P. Specification of cerebral cortical areas. Science. 1988;241:170–176. doi: 10.1126/science.3291116. [DOI] [PubMed] [Google Scholar]
- Schilling JD, Machkovech HM, He L, Diwan A, Schaffer JE. TLR4 activation under lipotoxic conditions leads to synergistic macrophage cell death through a TRIF-dependent pathway. J Immunol. 2013;190:1285–1296. doi: 10.4049/jimmunol.1202208. [DOI] [PMC free article] [PubMed] [Google Scholar]
- Sierra A, Encinas JM, Deudero JJ, Chancey JH, Enikolopov G, Overstreet-Wadiche LS, Tsirka SE, Maletic-Savatic M. Microglia shape adult hippocampal neurogenesis through apoptosis-coupled phagocytosis. Cell Stem Cell. 2010;7:483–495. doi: 10.1016/j.stem.2010.08.014. [DOI] [PMC free article] [PubMed] [Google Scholar]
- Su W, Hopkins S, Nesser NK, Sopher B, Silvestroni A, Ammanuel S, Jayadev S, Möller T, Weinstein J, Garden GA. The p53 transcription factor modulates microglia behavior through microRNA-dependent regulation of c-Maf. J Immunol. 2014;192:358–366. doi: 10.4049/jimmunol.1301397. [DOI] [PMC free article] [PubMed] [Google Scholar]
- Tramontin AD, García-Verdugo JM, Lim DA, Alvarez-Buylla A. Postnatal development of radial glia and the ventricular zone (VZ): a continuum of the neural stem cell compartment. Cereb Cortex. 2003;13:580–587. doi: 10.1093/cercor/13.6.580. [DOI] [PubMed] [Google Scholar]
- Ueno M, Fujita Y, Tanaka T, Nakamura Y, Kikuta J, Ishii M, Yamashita T. Layer V cortical neurons require microglial support for survival during postnatal development. Nat Neurosci. 2013;16:543–551. doi: 10.1038/nn.3358. [DOI] [PubMed] [Google Scholar]
- Vadodaria KC, Jessberger S. Maturation and integration of adult born hippocampal neurons: signal convergence onto small Rho GTPases. Front Synaptic Neurosci. 2013;5:4. doi: 10.3389/fnsyn.2013.00004. [DOI] [PMC free article] [PubMed] [Google Scholar]
- Wang J, Wu M, Wen J, Yang K, Li M, Zhan X, Feng L, Li M, Huang X. MicroRNA-155 induction by Mycobacterium bovis BCG enhances ROS production through targeting SHIP1. Mol Immunol. 2014;62:29–36. doi: 10.1016/j.molimm.2014.05.012. [DOI] [PubMed] [Google Scholar]
- Wang X, Zhao Y, Zhang X, Badie H, Zhou Y, Mu Y, Loo LS, Cai L, Thompson RC, Yang B, Chen Y, Johnson PF, Wu C, Bu G, Mobley WC, Zhang D, Gage FH, Ranscht B, Zhang YW, Lipton SA, et al. Loss of sorting nexin 27 contributes to excitatory synaptic dysfunction by modulating glutamate receptor recycling in Down's syndrome. Nat Med. 2013;19:473–480. doi: 10.1038/nm.3117. [DOI] [PMC free article] [PubMed] [Google Scholar]
- Wegiel J, Kuchna I, Nowicki K, Imaki H, Wegiel J, Marchi E, Ma SY, Chauhan A, Chauhan V, Bobrowicz TW, de Leon M, Louis LA, Cohen IL, London E, Brown WT, Wisniewski T. The neuropathology of autism: defects of neurogenesis and neuronal migration, and dysplastic changes. Acta Neuropathol. 2010;119:755–770. doi: 10.1007/s00401-010-0655-4. [DOI] [PMC free article] [PubMed] [Google Scholar]
- Wei H, Zou H, Sheikh AM, Malik M, Dobkin C, Brown WT, Li X. IL-6 is increased in the cerebellum of autistic brain and alters neural cell adhesion, migration and synaptic formation. J Neuroinflammation. 2011;8:52. doi: 10.1186/1742-2094-8-52. [DOI] [PMC free article] [PubMed] [Google Scholar]
- Wisniewski KE. Down syndrome children often have brain with maturation delay, retardation of growth, and cortical dysgenesis. Am J Med Genet Suppl. 1990;7:274–281. doi: 10.1002/ajmg.1320370755. [DOI] [PubMed] [Google Scholar]
- Xu L, Tang X, Wang Y, Xu H, Fan X. Radial glia, the keystone of the development of the hippocampal DG. Mol Neurobiol. 2015;51:131–141. doi: 10.1007/s12035-014-8692-y. [DOI] [PubMed] [Google Scholar]