Abstract
The present research aims to show that the occurrence of alpha blocking or event-related desynchronization (ERD) strongly depends on the amplitude and also on the phase angle of alpha activity at the stimulus onset. Simple visual stimulation was presented to 17 healthy subjects during EEG recording. An O2 electrode was used for analysis with a 32 channel EEG sampling system. We used a segmentation of raw data in order to obtain the evoked potential. Prestimulus and poststimulus activities were filtered in the alpha (8–13 Hz) frequency band. Later, four different events (blocked, time-locked, phase-locked, and eliminated) were separately averaged. Phase-locked sweeps were determined by application of inter-trial coherence analysis. The evaluation of the data shows that “time-locked and phase-locked sweeps” were the dominating pattern and not “the blocked pattern”, which occurred only when the prestimulus alpha was high. In the analyses of EEG-EP sweeps, only 22 % of epochs showed (ERD). The ANOVA revealed significant differences between four different alpha responses (F(3,48) = 11.175; p < 0.001). Furthermore, alpha oscillations in time-locked responses were significantly higher than blocked (p < 0.0001). The analyses clearly demonstrate that important precaution is needed when using the ERD as a cognitive or pathological marker.
Keywords: EEG, ERD, Evoked potential, Alpha, Oscillation activity, Occipital, Healthy subjects
Introduction
The present papers aims to show that the emphasis of Event Related Desychronization (or alpha blocking) in cognitive processes can lead to erroneous interpretations and that pre-stimulus activity should be analyzed in detail before establishing theories on the role of alpha blocking (ERD) in sensory and cognitive processes (Başar 2012; Başar and Güntekin 2012).
Event-related desynchronization (ERD)
An important property of alpha activity is the phenomenon of “alpha blocking (ERD),” first described in the early days of EEG research. The act of opening the eyes blocks the existent alpha-activity; a simple light stimulation triggers the same effect. One of the first demonstrations related to the possibility of functional effect was provided by Creutzfeldt (1993) who showed that during mental arithmetic operations, the alpha activity of subjects was blocked, whereas beta activity increased. The term desynchronization has not been confirmed at the cellular level, but it is now mostly used in the neuroscience literature.
Pfurtscheller and Lopes da Silva (1999) provide a detailed description of ERD measurements. According to these authors, “the term ERD is only meaningful if the baseline (alpha activity), measured some seconds before the event, represent a rhythmicity, seen as a clear peak in the pre-stimulus power spectrum”. Pfurtscheller and Lopes da Silva (1999) further state that EROs (Event-Related Oscillations) only have meaning if the event results in the case of an oscillatory response component not detected in the pre-stimulus event. The last statement is, however, somewhat contradictory, since event-related oscillations can be also detected in the presence of alpha activity (Başar 1980; Basar et al. 1997; Rémond and Lesèvre 1967; Klimesch 1999; Başar 2011).
Pre-stimulus EEG, alpha blocking (ERD) and alpha response
Before presenting the results of this report it is important to emphasize that an inverse relationship exists in all frequency windows between the amplitudes of pre-stimulus oscillations and event-related responses. In the last 30 years, this basic phenomenon was analyzed by several groups (Başar 1980; Rahn and Başar 1993a, b; Stampfer and Başar 1985; Brandt 1997). The studies by Jansen and Brandt (1991) are among the most systematic. We also refer to the relevant work of Barry et al. (2006), which mentions the importance of preferred states prior to stimulation. According to the above-mentioned publications, any statement related to the final functional interpretation of alpha ERD should be pronounced only after examination of the relationship between EROs and pre-stimulus alpha.
Half a century ago, the concept of “evoked alpha” was already developed by Bishop et al. (1953). Studies by Dinse et al. (1991, 1997) and Dudkin et al. (1978) confirmed the existence of the “alpha response” at the cellular level. Later, cross-modality experiments demonstrated that sensory alpha responses are dependent on the modality of sensory stimulation and recording site.
The amplitude, time course, and frequency contents of evoked potentials (especially N100–P200 wave complex) strongly depend on the amplitude of alpha activity prior to a sensory stimulation. Publications by Brandt and Jansen (1991) and Brandt (1997) confirmed not only the findings of Başar (1980) regarding the inverse relationship between evoked potentials and pre-stimulus EEG; these authors also described a model presenting evidence that the generation of spontaneous EEG activity can acquire the waveforms of EPs when pulse-like signals serve as input. Furthermore, these authors described a marked correlation between N100 amplitude and pre-stimulus EEG. The data of Jansen and Brandt (1991) supported the hypothesis that spontaneous 10-Hz activity and visual evoked potentials are generated by some of the same neural structures, and that the visual-evoked potentials are due to distributed action rather than dipolar sources.
Another important question is the following: Klimesch et al. (2007) assumed that the most important brain signal is the alpha desynchronization. According to results in Başar (2012) and Başar and Güntekin (2012) this is a questionable assumption. One of the aims of the study is to examine whether such a statement is reliable and further whether ERD can be used as a neurophysiologic cognitive marker.
Methods
Subjects
17 healthy subjects (10 males, 7 females) volunteered to participate in the study. Most of the subjects were university students and university staff and faculty members. Participants’ ages ranged from 19 to 48 years. The mean age of subjects was 28.8 ± 8.8 years. All of the subjects were right handed. All subjects had completed at least 10 years of education. All subjects were interviewed with a questionnaire on their family history, demographic and medical profiles and drinking habits. None of the subjects reported any current or past neurological or psychiatric illness and all participants had normal or corrected to normal vision. All subjects signed an approved consent form.
Stimuli and experimental procedure
For stimulation a simple square visual stimulus with an intensity of approximately 10 cd/m2 was displayed on a computer screen. Viewing distance was 120 cm, resulting in a stimulus size of 8.1° of a visual angle (absolute stimulus size was 17 × 17 cm). Sixty light stimuli were presented with stimulus duration of 1,000 ms and a completely dark interval between each stimulus presentation. The duration of the blank interval varied randomly between 3 and 7 s.
Electrophysiological recording
EEG was recorded by using the BrainAmp EEG amplifier, Brain Vision Recorder software (Brainproducts, Munich, Germany), and the BrainCap electrode cap, at 30 positions. The EEG was amplified by means of a BrainAmp with band limits of 0.01–250 Hz. The EEG was digitized online at a sampling rate of 500 Hz. All electrode impedances were less than 10 kΩ. Two linked earlobe electrodes (A1 and A2) served as references. The EOG from the medial upper and lateral orbital rim of the right eye was also registered. For the reference electrodes and EOG recordings, Ag–AgCl electrodes were used. The EEG and EOG signals were visually scored and portions of the data that contained aberrant eye movements, muscle movements or artifacts, were removed.
EEG analysis
The recorded EEG data were analyzed off-line in consecutive epochs of 1 s (−500 ms pre-stimulation, +500 ms post stimulation period); the epochs containing artifacts were rejected by an off-line technique, i.e. single sweep EOG recordings were examined visually and trials with eye movement or blink artifacts were rejected. Single trial epochs were than filtered in 8–13 Hz alpha frequency range. We used “Butterworth Zero Phase Filters” for alpha filtering. Visual inspection of single trail alpha oscillations was performed in order to analyze the different patterns of alpha oscillations; the maximum peak-to-peak alpha amplitudes in the pre-stimulus time period (−500 ms) and post stimulus time period were also analyzed. In this analysis four different alpha patterns were detected.
In first group of single trials, pre-stimulus alpha oscillations were higher than the post stimulus alpha oscillations, this group was titled, “alpha blocking (ERD)” single trials.
In the second group of single trials, post-stimulus alpha oscillations were higher than pre-stimulus alpha oscillations. In this group, there were two sub-patterns, namely “time-locked” and “phase-locked” alpha oscillations. Often the expression time-locked is described as induced oscillations.
The “phase-locked” alpha oscillations were between 0 and 300 ms; the first negative peak of alpha response was at 100 ms and the second negative peak of alpha response was at 200 ms. However, the exact time of the first negative peak and second negative peak varied between epochs.
The procedure of selecting phase-locked responses consisted of two steps. Firstly; we prepared a template of damped sinusoidal oscillatory response with peakings at 100 and 200 ms following the stimulation. Single responses were than compared with this template. In this way we built a subgroup with phase-locked responses. Secondly; we performed an analysis using the inter-trial coherence method. This will be further explained below.
Inter-trial coherence (ITC) is a frequency-domain measure for the synchronization of activity at a particular latency and frequency for a set of experimental events to which EEG data trials are time-locked (Delorme and Makeig 2004; Tallon-Baudry et al. 1996). Here, we calculated the ITC using the EEGLAB version as follows (Delorme and Makeig 2004):
For j = 1–N trials,
where Фj(t, f) is the phase of the wavelet at time t and frequency f. ITC values range from 0 (indicating absence of phase-locking) to 1 (indicating perfect phase synchronization). All ITC values were baseline-corrected over −300 to −50 ms and were computed for each participant for the grand average; ITC values were averaged across all participants. We used each participant’s individual peak-frequency in the alpha-band for the wavelet transform within the range of 15–20 Hz in the time interval between 0 and 200 ms.
After evaluation of both processes we compared the template subgroup with the ITC method and we found that the inter-trial coherence of the subgroup was in the range of 1 for all the subjects. Accordingly, we can very accurately state that the number of phase-locked components is highly reliable.
-
4.
In the fourth group of alpha oscillations, neither the pre-stimulus nor the post-stimulus alpha oscillations were high. We named this group of single trials “eliminated signals”.
Results
Classification of alpha pre-stimulus and post-stimulus patterns
In summary there were four groups of single trials (1) alpha blocking (ERD), (2) time-locked, (3) phase-locked, and (4) eliminated. For each subject and for each categorized alpha oscillations (ERD or alpha blocking, time-locked, phase-locked, eliminated), peak-to-peak maximum amplitudes were analyzed for both pre-stimulus (−500 ms) and post-stimulus (+500) time periods.
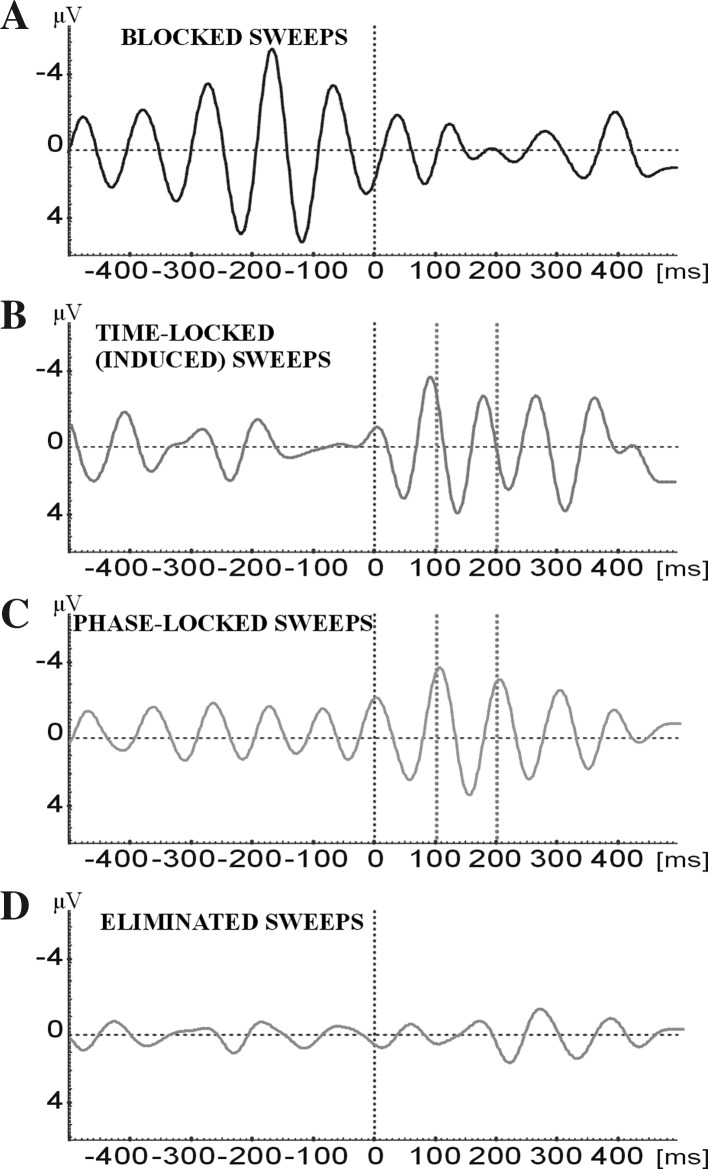
In order to analyze the relation of pre-stimulus activity and post-stimulus responses we used the EEG and evoked responses of seventeen subjects. For each subject, we classified four different types of EEG-EP epochs that are filtered in the 8–13 Hz frequency range. Figure 1 illustrates these four types of signal EEG-EP epochs.
In general, if the pre-stimulus activity has high amplitudes the stimulation triggers an alpha blocking (ERD) (the amplitude of pre-stimulus activity is sensitive in the period of 300 ms before stimulation) (Fig. 1a).
In the case of low pre-stimulus EEG activity, usually a time-locked enhancement (induced) of the alpha response is observed upon stimulation (the expressions “high alpha activity” or “low alpha activity” are determined upon analyses of our pre-stimulus sweeps for a given subject. Firstly, for each subject an average of peak-to-peak maximum amplitudes are computed. Lower alpha groups are single epochs that are less than the average of the high amplitude groups (Fig. 1b).
The third group of sweeps show only “phase-locking” in the 200 ms following sensory stimulation. This peaking of 100 and 200 ms correspond to the 100 and 200 ms in the conventional average of the unfiltered evoked potential (Fig. 1c).
The fourth type of EEG and EP sweeps shows whether there is blocking (ERD), time-locking or phase locking (Fig. 1d).
Fig. 1.
Averaging of for types of responses for a typical subject. The results are obtained from the Occipital area
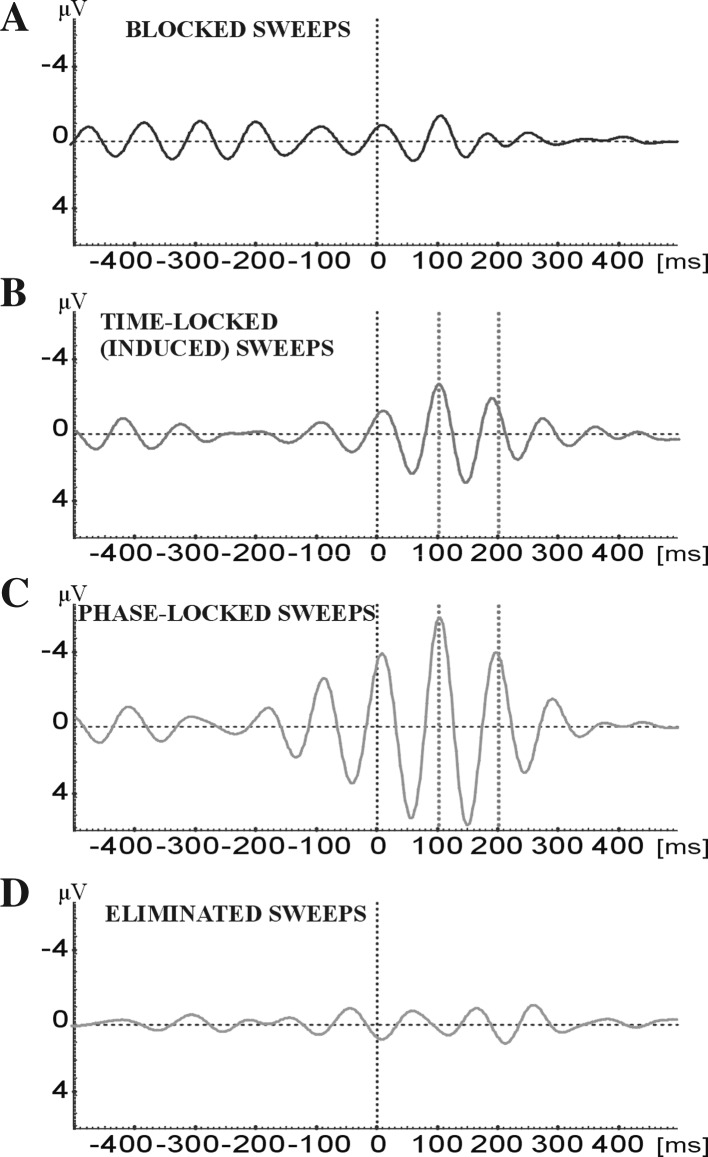
Figure 2 shows the grand average (N = 17) obtained by averaging the responses from all subjects.
Fig. 2.
The grand average (N = 17) obtained by averaging four types of responses from all 17 subjects. The results are obtained from the Occipital area
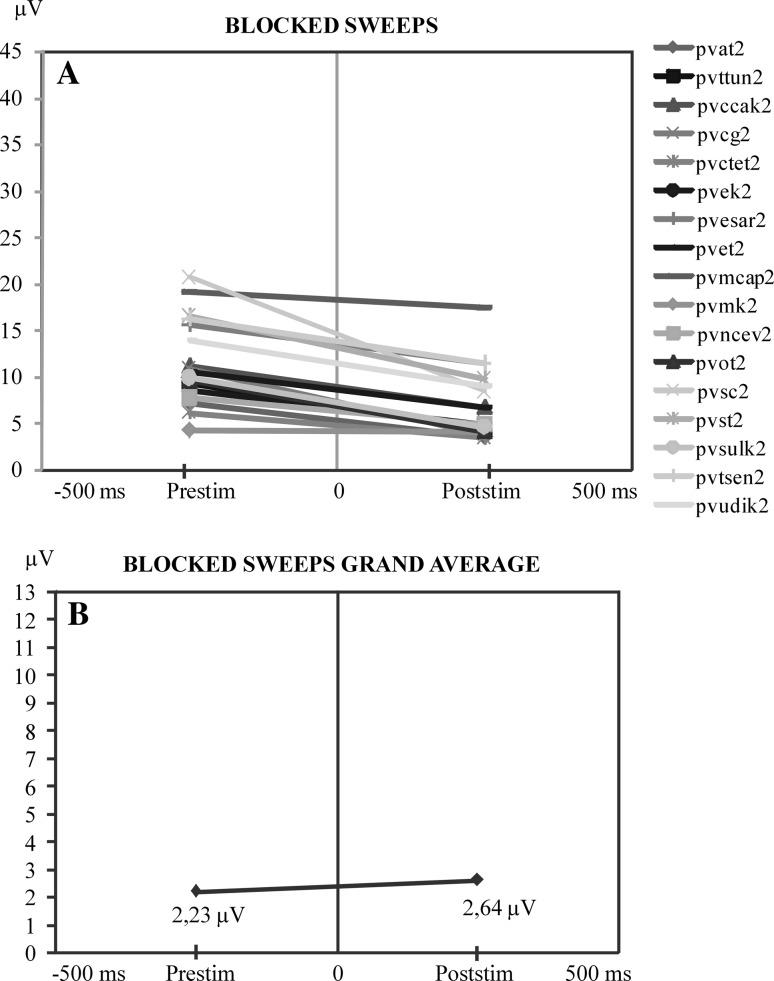
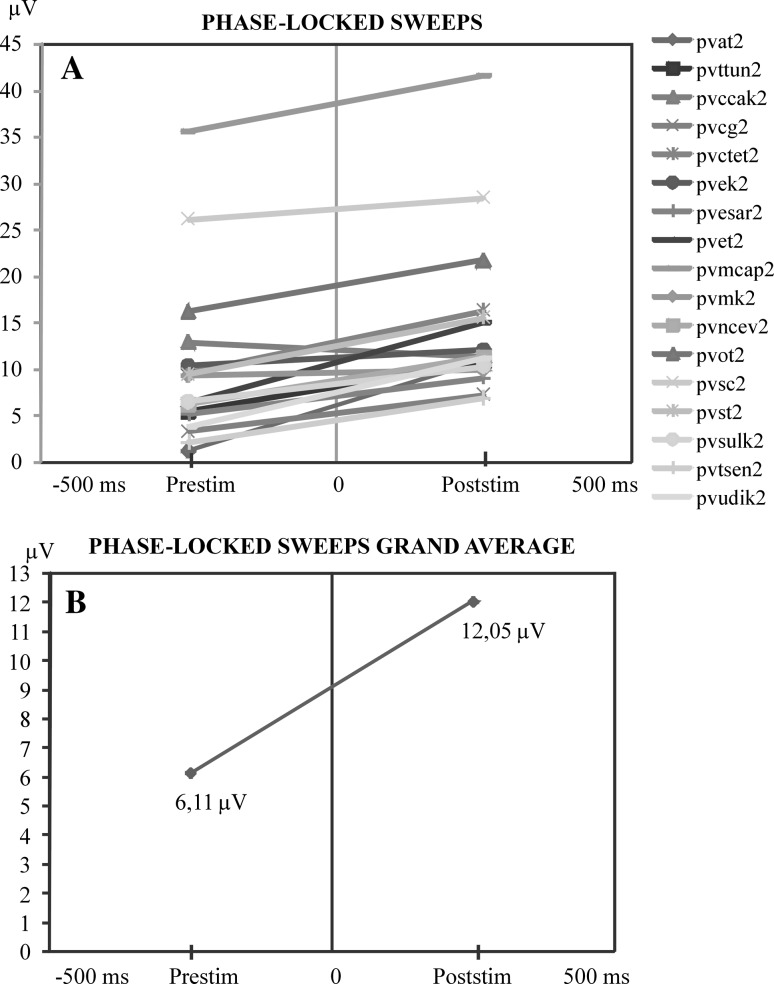
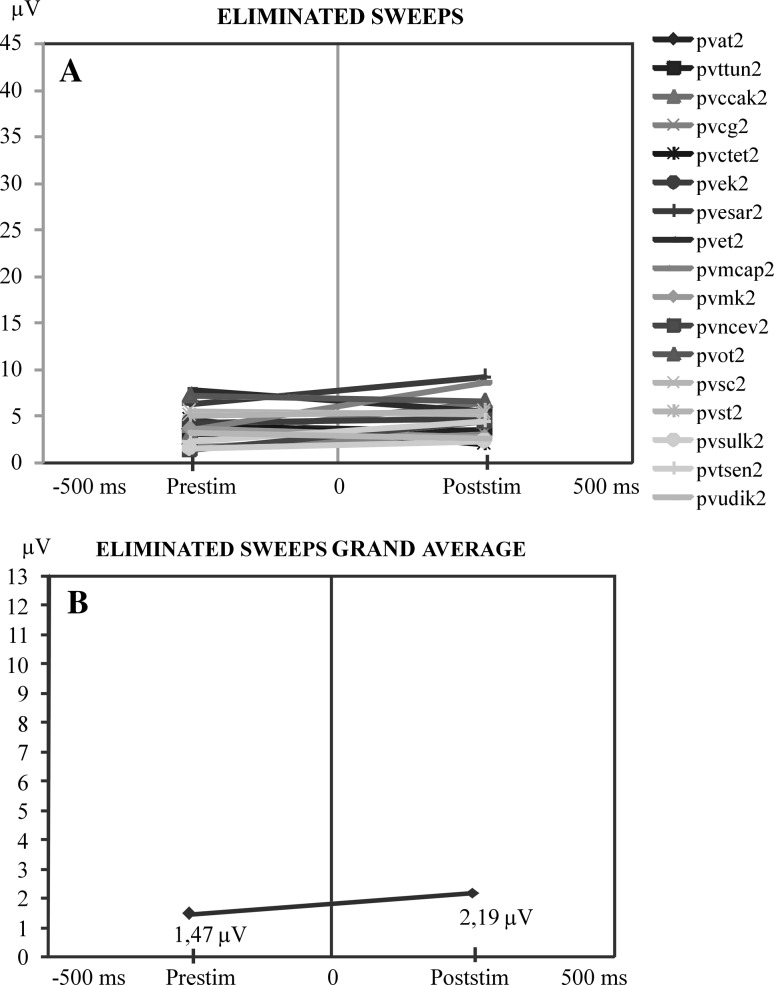
Figures 3, 4, 5 and 6 illustrate four types of mean values of sweeps on a line graph for each subject. In this graph, the relationships between the pre-stimulus and post-stimulus activity are shown by indicating peak-to-peak values. Figure 3a represents blocked sweeps. In this figure, pre-stimulus and post-stimulus amplitudes are compared. The curves are presented with different colors. In most of the subjects, pre-stimulus values are higher than the post-stimulus values for blocked sweeps. In Fig. 3a, which contains the microvolt values of single subjects, we observe a decrease from pre-stimulus amplitudes to post-stimulus amplitudes. But this difference disappears in the grand average of blocked sweeps (N = 17) (Fig. 3b).
Fig. 3.
a Comparison of the maximum values of pre-stimulus and post-stimulus alpha responses along the time axis. At the ordinate is the maximum peak-to-peak amplitude of the pre-stimulus activity prior to stimulation. At the right side of the illustration is the maximum of alpha amplitude in the time interval of 0–200 ms following stimulation. This illustration shows that when pre-stimulus activity is high the post-stimulus alpha oscillations are highly reduced. b Display of the mean value curve of all subjects in a
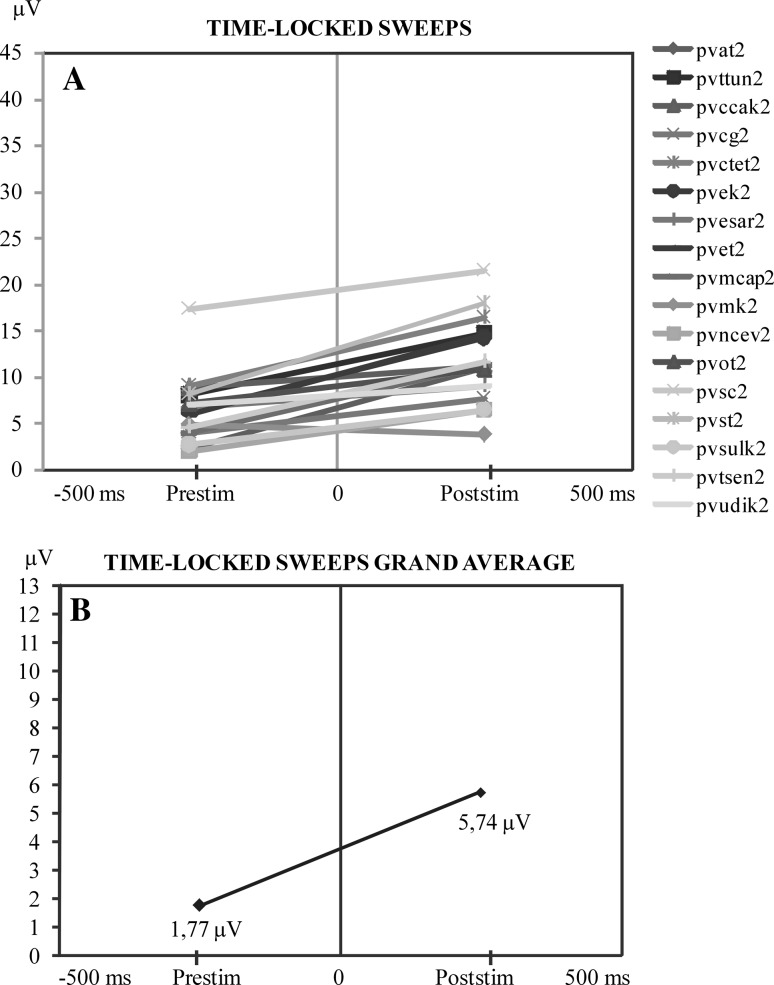
Fig. 4.
a Comparison of the maximum values of pre-stimulus and post-stimulus alpha responses along the time axis. At the ordinate is the maximum peak-to-peak amplitude of the pre-stimulus activity prior to stimulation. At the right side of the illustration is the maximum of alpha amplitude in the time interval of 0–200 ms following stimulation. This illustration shows that when pre-stimulus activity is high the post-stimulus alpha oscillations are highly reduced. b Display of the mean value curve of all subjects in a
Fig. 5.
a Comparison of the maximum values of pre-stimulus and post-stimulus alpha responses along the time axis. At the ordinate is the maximum peak-to-peak amplitude of the pre-stimulus activity prior to stimulation. At the right side of the illustration is the maximum of the alpha amplitude in the time interval of 0–200 ms following stimulation. This illustration shows that when pre-stimulus activity is high the post-stimulus alpha oscillations are highly reduced. b Display of the mean value curve of all subjects in a
Fig. 6.
a Comparison of the maximum values of pre-stimulus and post-stimulus alpha responses along the time axis. At the ordinate is the maximum peak-to-peak amplitude of the pre-stimulus activity prior to stimulation. At the right side of the illustration is the maximum of alpha amplitude in the time interval of 0–200 ms following stimulation. This illustration shows that when pre-stimulus activity is high the post-stimulus alpha oscillations are highly reduced. b Display of the mean value curve of all subjects in a
Figure 4a shows the result in time-locked sweeps. In this group of time-locked sweeps, an increment from pre-stimulus amplitudes to post-stimulus amplitudes is observed. Also the grand average of the time-locked sweeps of single subjects have the same feature as the grand average (Fig. 4b).
Figure 5a shows the relation of phase-locking sweeps. The similar situation is observed in time-locked sweeps. In both grand averages of phase-locking sweeps (Fig. 5b) and in single subjects an increment from pre-stimulus amplitudes to post-stimulus amplitudes is observed.
Figure 6a shows the ensembles of eliminated sweeps. There is no definite regular increment or decrement in eliminated sweeps in single subjects and in the grand average (Fig. 6b).
Description of ensemble of all EEG-EP sweeps
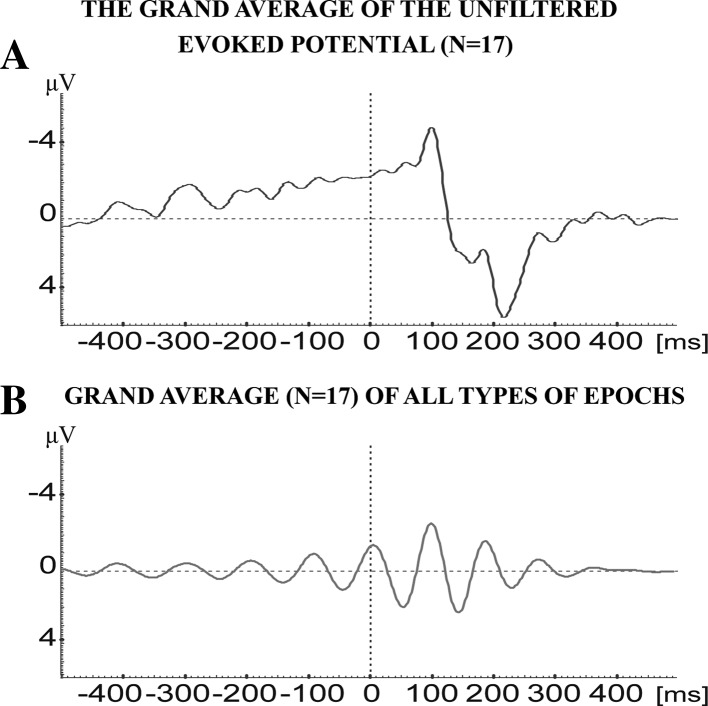
After the separate analyses of all four different types of blocking (ERD), time-locking, phase-locking and non specific sweeps the conjecture is open for building the grand average of all single subjects containing all four types of EEG-EP epochs. In this grand average of filtered signals (Fig. 7b) a response with two peaks, with latencies of 100 and 200 ms, characterize the evoked oscillation. This is a typical phase-locked and time-locked pattern. Thus, the simple mean value evaluation clearly points out that the “time-locked and phase-locked sweeps” are the dominating pattern in all the analysis of the ensembles of four types of patterns. On the other hand, the filtered response (Fig. 7b) is almost congruent with the conventional non-filtered visual evoked potential (Fig. 7a). This is described below.
Fig. 7.
a Grand average of the unfiltered evoked potential from 17 subjects. b Grand average (N = 17) of filtered evoked potential in the frequency window of 8–13 Hz. This average consists of the sum of all four types of sweeps: blocked, time-locked, phase-locked, and eliminated
Statistical evolution of results
SPSS was used for statistical analysis. A repeated measure ANOVA was used to determine the statistical significance of differential alpha responses. For each subject groups and for each categorized sets alpha oscillations (alpha blocking (ERD), time-locked response, phase-locked response, eliminated response.
In the statistical analysis, repeated measures of ANOVA included the within-subject factors as four different alpha responses (blocking (ERD), time-locked, phase-locked, eliminated); two pre-stimulus post-stimulus conditions (Pre-stimulation vs. post-stimulation), two locations (parietal and occipital) and two hemispheres (right and left). Post-hoc comparisons for within-subject effects were analyzed using the t test. Greenhouse and Geisser (1959)corrected p values were reported, and the level of significance was set to p < 0.05 for post hoc comparisons.
The ANOVA revealed significant differences between the four different alpha responses (blocking (ERD), time-locked, phase-locked, eliminated) (F(3,48) = 11.175; p < 0.001). Post-hoc comparisons showed that alpha oscillations in phase-locking were significantly higher than in blocking (ERD), time-locked, and eliminated alpha oscillations (p < 0.0001). Furthermore, alpha oscillations in time-locked responses were significantly higher than in blocking (ERD), and eliminated alpha oscillations (p < 0.0001). Overall, in four groups, eliminated alpha oscillations were the lowest in amplitude. The ANOVA revealed significant differences between pre-stimulation versus post-stimulation conditions (F(1,16) = 13.846; p < 0.003. Post hoc comparisons showed that alpha oscillations in post-stimulation were higher than the alpha oscillations in pre-stimulation (p < 0.0001).
The ANOVA revealed significant results for four different alpha responses (blocking (ERD), time-locked, phase-locked, eliminated) X pre-stimulation-post-stimulation alpha oscillations. (F(3,48) = 50.578; p < 0.0001). Post hoc comparisons showed that phase-locked alpha oscillations, time-locked and eliminated alpha oscillations were significantly higher in the post-stimulus time period than the pre-stimulus time period (p < 0.0001; p < 0.0001; p < 0.009). Furthermore, post hoc comparisons showed that blocked alpha oscillations were significantly higher in the pre-stimulus time period than in the post-stimulus time period (p < 0.001).
The ANOVA revealed significant results for four different alpha responses (blocking (ERD), time-locked, phase-locked, eliminated) pre-stimulation-post-stimulation alpha oscillationsXLocation (parietal vs. occipital) (F(3,48) = 4,95; p < 0.02). Post hoc comparisons showed that alpha oscillations were significantly higher for occipital electrodes than for parietal electrodes for both pre-stimulus and post-stimulus time intervals.
The ANOVA revealed significant results for four different alpha responses (blocking (ERD), time-locked, phase-locked, eliminated) X pre-stimulation-post-stimulation alpha oscillationsXhemisphere (right vs. left) (F(3,48) = 3,53; p < 0.03). The ANOVA revealed significant results for pre-stimulation-post-stimulation alpha oscillations X Location X hemisphere (right vs. left) (F(3,48) = 4,78; p < 0.05). The significant results were found for the phase-locked response and for post-stimulus period. It was further seen that this significance was more pronounced for right parietal electrode. Post hoc comparisons showed that right parietal electrode (P4) post-stimulus phase locked alpha oscillations were significantly higher than the left parietal electrode (P3) post-stimulus phase locked alpha oscillations (p < 0.02).
Discussion
Rahn and Başar (1993a, b) showed a substantial increase in both auditory and visual N1-P2 amplitude, when stimuli were presented, only during low amplitude alpha and theta EEG states. Furthermore, Schürmann and Başar (1994) and Başar and Schürmann (1994) demonstrated the topographic and modality-dependent EP differences in alpha and theta responses to visual and auditory stimulation resulting from non-linear resonance phenomena.
Başar and Stampfer (1985) observed a phase reordering or ‘preferred phase angle’ in the delta (0.5–3.5 Hz) frequency range to produce maximal negativity at the time of stimulus onset. Phase alignment was also observable in the alpha range (the focus of this study). Further evidence for preferred (dynamic) EEG frequency phase alignment has been reported by Barry et al. (2003), Pleydell-Pearce (1994) and Rockstroh et al. (1989).
According to Barry et al. (2004), “averaging” is generally used to increase the signal:noise ratio of the small stimulus-related response hidden in the background EEG activity. These authors state that the resultant ERP is simply an average, which may not be truly representative of the actual response from any single event. There is increasing evidence to suggest that the average does not provide a good estimate of the trial-to-trial response, which appears to be highly variable (Anderson et al. 1991; Başar 1980; Ford et al. 1994; Stampfer and Başar 1985). Recognition of these limitations of conventional ERP extraction methods has led researchers to explore new methods of examining and interpreting the ERP (Jasiukaitis and Hakerem 1998; Price 1997; Rahn and Başar 1993b).
In more recent studies, Becker et al. (2008) insist that for stages of low pre-stimulus alpha activity recorded at the vertex, an enhancement of the N1–P2 peak-to-peak amplitude (100–250 ms) was demonstrated in fronto-central areas. Also, Barry et al. (2000) showed convincing evidence from auditory oddball data, that a direct relationship between pre-stimulus alpha activity and EP component amplitude (as proposed by Brandt and Jansen 1991) is compatible with the existence of an inverse relationship between pre-stimulus alpha and the mentioned “EP enhancement factor” (as proposed by Başar 1980). These studies imply that the reported inverse correlation allows manifold interpretations of the relationship between EP amplitude and ongoing alpha amplitude. Actually, any relationship that is weaker than directly proportional, even a clear independence of EP and ongoing alpha amplitude, yields such an inverse correlation. Barry et al. (2000) described that the results of Başar’s group and Brandt’s group studies on the “EP enhancement factor” do not contradict but rather support the evoked theory and its implications. However, at least a strict phase reset can be excluded, since such a behavior would prevent the consistently reported inverse relationship between pre-stimulus and post-stimulus alpha enhancement.
The results of Ben-Simon et al. (2008) also suggest that the human alpha rhythm represents at least two simultaneously occurring processes, which characterize the “resting brain;” one is related to expected change in sensory information, while the other is endogenous and independent of stimulus change. These findings support the earlier claim made by Walter (Walter 1950) that the scalp-recorded alpha is the end product of many alpha rhythms that are spatially averaged over the scalp.
According to Min and Herrmann (2007), the relationship between pre-stimulus alpha and pre-stimulus performance implies that the pre-stimulus alpha, which prepares the subsequent task, seems to predict the post-stimulus responses. Ishii et al. (2009) analyzed oddball tasks by means of MEG and found prolonged alpha responses, and also positive correlations between pre-stimulus theta/alpha spectral power and P300 amplitude.
According to Harris (2003), “prediction”, “expectancy” and “motor preparation” are manifested with changes of alpha activity. State dependency is an important factor in understanding the mechanisms through which brain stimulation modulates neural activity and behavior. As to this point, Silvanto et al. (2008) stated that the impact of any external stimulus is dependent not only on the properties of that stimulus, but also on the initial state of the stimulated system.
Important conclusion
The discussion clearly demonstrates that the occurrence of alpha blocking (ERD) strongly depends on several factors:
The amplitude of pre-stimulus alpha activity. Blocking (ERD) of alpha occurs only if the alpha activity, prior to stimulation, has a regular oscillatory behavior with higher amplitudes.
The phase angle. Rémond and Lesèvre (1967) noted enhancement of ERP components when stimuli were presented at the maximum and, to a lesser degree, the positive-going zero crossing of the alpha wave. As discussed in “Discussion” section, the pre-stimulus alpha is depended on the modalities of sensory and cognitive strategies during the recording of event related potentials.
Furthermore,
-
3.
The foregoing conclusions indicate that in healthy subjects the occurrence of alpha blocking (ERD) does not depend on the modality of the stimulation but from signal quality at the time point of stimulus onset. State dependency is an important factor in understanding the mechanisms through which brain stimulation modulates neural activity and behavior.
-
4.
In diseases, a standardization procedure for each disease must be developed. For example, in patients with bipolar disorder, the alpha activity is 80 % reduced; in this case, it is impossible to research alpha blocking (ERD) or to use this phenomenon as a cognitive or pathologic marker (Başar et al. 2010; Başar 2011).
-
5.
As outlined in “Results” section, the number of occurrence of evoked responses that are phase-locked or time-locked is much higher than blocked sweeps. The ERD is existent only in 22 % of EEG-EP epochs. On the contrary, phase-locked and time-locked sweeps exist in 30 % of EEG/EP sweeps. This is also reflected in the grand average of all post-stimulus signals as shown in Table 1.
-
6.
This report indicates that there is a strong need for precaution when using the ERD as an indicator of cognitive processes. Furthermore, the results do not support Klimesch’s statement (Klimesch et al. 2007) that alpha blocking (ERD) is the most important functional indicator of the brain. Because, also in the grand average of EEG-EP sweeps, phase-locked and time-locked alpha response remains dominating whereas the blocking effect disappears.
Table 1.
The table describes the percentage of single EEG-EP sweeps: Enhanced, phase locked, blocked and eliminated
| Blocked | Time-locked | Phase-locked | Eliminated | |
|---|---|---|---|---|
| Percent | 22 | 15 | 15 | 48 |
Our present analysis is restricted to the occipital area and visual stimulation. However, our preliminarily analysis shows that similar results will also be obtained for recording in the central and frontal areas and also in application of stimulation with cognitive tasks (Başar and Güntekin 2012).
References
- Anderson J, Rennie C, Gordon E, Howson A, Meares R. Measurement of maximum variability within event-related potentials in schizophrenia. Psychiatry Res. 1991;39:33–44. doi: 10.1016/0165-1781(91)90006-B. [DOI] [PubMed] [Google Scholar]
- Barry RJ, Kirkaikul S, Hodder D. EEG alpha activity and the ERP to target stimuli in an auditory oddball paradigm. Int J Psychophysiol. 2000;39:39–50. doi: 10.1016/S0167-8760(00)00114-8. [DOI] [PubMed] [Google Scholar]
- Barry RJ, De Pascalis V, Hodder D, Clarke AR, Johnstone SJ. Preferred EEG brain states at stimulus onset in a fixed interstimulus interval auditory oddball task and their effects on ERP components. Int J Psychophysiol. 2003;47(3):187–198. doi: 10.1016/S0167-8760(02)00151-4. [DOI] [PubMed] [Google Scholar]
- Barry RJ, Clarke AR, Mc Carthy R, Selikowitz M, Johnstone SJ, Rushby JA. Age and gender effects in EEG coherence. I. Developmental trends in normal children. Clin Neurophysiol. 2004;115:2252–2258. doi: 10.1016/j.clinph.2004.05.004. [DOI] [PubMed] [Google Scholar]
- Barry RJ, Rushby JA, Smith JL, Clarke AR, Croft RJ. Dynamics of narrow-band EEG phase effects in the passive auditory oddball task. Eur J Neurosci. 2006;24(1):291–304. doi: 10.1111/j.1460-9568.2006.04879.x. [DOI] [PubMed] [Google Scholar]
- Başar E. EEG–brain dynamics. Relation between EEG and brain evoked potentials. Amsterdam: Elsevier; 1980. p. 412. [Google Scholar]
- Başar E. Brain–body–mind in the nebulous cartesian system: a holistic approach by oscillations. New York: Springer; 2011. [Google Scholar]
- Başar E. A review of alpha activity in integrative brain function: fundamental physiology, sensory coding, cognition and pathology. Int J Psychophysiol. 2012;86(1):1–24. doi: 10.1016/j.ijpsycho.2012.07.002. [DOI] [PubMed] [Google Scholar]
- Başar E, Güntekin B. A short review of alpha activity in cognitive processes and in cognitive impairment. Int J Psychophysiol. 2012;86:25–38. doi: 10.1016/j.ijpsycho.2012.07.001. [DOI] [PubMed] [Google Scholar]
- Başar E, Schürmann M. Functional aspects of evoked alpha and theta responses in humans and cats: occipital recordings in cross-modality experiments. Biol Cybern. 1994;72:175–183. doi: 10.1007/BF00205981. [DOI] [PubMed] [Google Scholar]
- Başar E, Stampfer HG. Important associations among EEG-dynamics, eventrelated potentials, short-term memory and learning. Int J Neurosci. 1985;26(3–4):161–180. doi: 10.3109/00207458508985615. [DOI] [PubMed] [Google Scholar]
- Basar E, Schürmann M, Basar-Eroglu C, Karakas S (1997) Alpha oscillations in brain functioning: an integrative theory. In: Basar E, Hari R, Lopes da Silva FH, Schürmann M (eds) Brain alpha activity: new aspects and functional correlates. special issue of the International Journal Psychophysiology, vol 26(1–3), pp 5–29 [DOI] [PubMed]
- Başar E, Güntekin B, Tülay E, Yener GG. Evoked and event related coherence of Alzheimer patients manifest differentiation of sensory-cognitive networks. Brain Res. 2010;1357:79–90. doi: 10.1016/j.brainres.2010.08.054. [DOI] [PubMed] [Google Scholar]
- Becker R, Ritter P, Villringer A. Influence of ongoing alpha rhythm on the visual evoked potential. NeuroImage. 2008;39:707–716. doi: 10.1016/j.neuroimage.2007.09.016. [DOI] [PubMed] [Google Scholar]
- Ben-Simon E, Podlipsky I, Arieli A, Zhdanov A, Hendler T. Never resting brain: simultaneous representation of two alpha related processes in humans. PLoS One. 2008;3(12):3984. doi: 10.1371/journal.pone.0003984. [DOI] [PMC free article] [PubMed] [Google Scholar]
- Bishop PO, Jeremy D, McLeod JG. Phenomenon of repetitive firing in lateral geniculate of cat. J Neurophysiol. 1953;16:443–447. doi: 10.1152/jn.1953.16.4.437. [DOI] [PubMed] [Google Scholar]
- Brandt J. Visual and auditory evoked phase resetting of the alpha EEG. Int J Psychophysiol. 1997;26:285–298. doi: 10.1016/S0167-8760(97)00771-X. [DOI] [PubMed] [Google Scholar]
- Brandt ME, Jansen BH. The relationship between prestimulus alpha amplitude and visual evoked potential amplitude. Int J Neurosci. 1991;61:261–268. doi: 10.3109/00207459108990744. [DOI] [PubMed] [Google Scholar]
- Creutzfeldt OD. Cortex cerebri. Performance, Structural and Functional Organization of the Cortex. Berlin: Springer; 1993. [Google Scholar]
- Delorme A, Makeig S. EEGLAB: an open source toolbox for analysis of single-trial EEG dynamics including independent component analysis. J Neurosci Methods. 2004;134:9–21. doi: 10.1016/j.jneumeth.2003.10.009. [DOI] [PubMed] [Google Scholar]
- Dinse HR, Krüger K, Mallot HP, Best J. Temporal structure of cortical information processing: cortical architecture, oscillations, and non-separability of spatiotemporal receptive field organization. In: Kruger J, editor. Neuronal cooperativity. Berlin: Springer; 1991. pp. 67–104. [Google Scholar]
- Dinse HR, Krüger K, Akhavan AC, Spengler F, Schöner G, Schreiner CE. Low frequency oscillations of visual, auditory and somatosensory cortical neurons evoked by sensory stimulation. Int J Psychophysiol. 1997;26:205–227. doi: 10.1016/S0167-8760(97)00765-4. [DOI] [PubMed] [Google Scholar]
- Dudkin KN, Glezer VD, Gauselman VE, Panin AI. Types of receptive fields in the lateral geniculate body and their functional model. Biol Cybern. 1978;29:37–47. doi: 10.1007/BF00365234. [DOI] [PubMed] [Google Scholar]
- Ford J, White P, Lim K, Pfefferbaum A. Schizophrenics have fewer and smaller P300s: a single-trial analysis. Biol Psychiatry. 1994;35:96–103. doi: 10.1016/0006-3223(94)91198-3. [DOI] [PubMed] [Google Scholar]
- Greenhouse SW, Geisser S. On methods in the analysis of profile data. Psy-chometrika. 1959;24:95–112. [Google Scholar]
- Harris JB. Differential conditioning of alpha amplitude: a fresh look at an old phenomenon. Clin Neurophysiol. 2003;116(6):1433–1443. doi: 10.1016/j.clinph.2005.02.003. [DOI] [PubMed] [Google Scholar]
- Ishii R, Canuet L, Herdman A, Gunji A, Iwase M, Takahashi H, Nakahachi T, Hirata M, Robinson SE, Pantev C, Takeda M. Cortical oscillatory power changes during auditory oddball task revealed by spatially filtered magnetoencephalography. Clin Neurophysiol. 2009;120(3):497–504. doi: 10.1016/j.clinph.2008.11.023. [DOI] [PubMed] [Google Scholar]
- Jansen BH, Brandt ME. The effect of phase of prestimulus alpha activity on the averaged visual evoked response. Electroencephalogr Clin Neurophysiol. 1991;80:241–250. doi: 10.1016/0168-5597(91)90107-9. [DOI] [PubMed] [Google Scholar]
- Jasiukaitis P, Hakerem G. The effect of prestimulus alpha activity on the P300. Psychophysiology. 1998;25:157–165. doi: 10.1111/j.1469-8986.1988.tb00979.x. [DOI] [PubMed] [Google Scholar]
- Klimesch W. EEG alpha and theta oscillations reflect cognitive and memory performance: a review and analysis. Brain Res Rev. 1999;29:169–195. doi: 10.1016/S0165-0173(98)00056-3. [DOI] [PubMed] [Google Scholar]
- Klimesch W, Sauseng P, Hanslmayr S. EEG alpha oscillations: the inhibitiontiming hypothesis. Brain Res Rev. 2007;53(1):63–88. doi: 10.1016/j.brainresrev.2006.06.003. [DOI] [PubMed] [Google Scholar]
- Min BK, Herrmann CS. Prestimulus EEG alpha activity reflects prestimulus top-down processing. Neurosci Lett. 2007;422(2):131–135. doi: 10.1016/j.neulet.2007.06.013. [DOI] [PubMed] [Google Scholar]
- Pfurtscheller G, Lopes da Silva FH. Event-related EEG/MEG synchronization and desynchronization: basic principles. Clin Neurophysiol. 1999;110(11):1842–1857. doi: 10.1016/S1388-2457(99)00141-8. [DOI] [PubMed] [Google Scholar]
- Pleydell-Pearce C. DC potential correlates of attention and cognitive load. Cogn Neuropsychol. 1994;11:149–166. doi: 10.1080/02643299408251972. [DOI] [Google Scholar]
- Price G. The effect of pre-stimulus alpha activity on the auditory P300 paradigm: a prospective study. Brain Topogr. 1997;9:169–176. doi: 10.1007/BF01190386. [DOI] [PubMed] [Google Scholar]
- Rahn E, Başar E. Prestimulus EEG-activity strongly influences the auditory evoked vertex responses: a new method for selective averaging. Int J Neurosci. 1993;69:207–220. doi: 10.3109/00207459309003331. [DOI] [PubMed] [Google Scholar]
- Rahn E, Başar E. Enhancement of visual evoked potentials by stimulation during low prestimulus EEG stages. Int J Neurosci. 1993;72:123–136. doi: 10.3109/00207459308991629. [DOI] [PubMed] [Google Scholar]
- Rémond A, Lesèvre N. Variations in average visual evoked potentials as a function of the alpha rhythm phase autostimulation. EGG Clin Neurophysiol. 1967;26:42–52. [PubMed] [Google Scholar]
- Rockstroh B, Elbert T, Canavan A, Lutzenberger W, Birbaumer N. Slow cortical potentials and behavior. Munich: Urban and Schwarzenberg; 1989. [Google Scholar]
- Schürmann M, Başar E. Topography of alpha and theta oscillatory responses upon auditory and visual stimuli in humans. Biol Cybern. 1994;72:161–174. doi: 10.1007/BF00205980. [DOI] [PubMed] [Google Scholar]
- Silvanto J, Muggleton N, Vincent W. State-dependency in brain stimulation studies of perception and cognition. Trends Cogn Sci. 2008;12(12):447–454. doi: 10.1016/j.tics.2008.09.004. [DOI] [PubMed] [Google Scholar]
- Stampfer HG, Başar E. Does frequency analysis lead to better understanding of human event related potentials? Int J Neurosci. 1985;26:181–196. doi: 10.3109/00207458508985616. [DOI] [PubMed] [Google Scholar]
- Tallon-Baudry C, Bertrand O, Delpuech C, Pernier J. Stimulus specificity of phase-locked and non-phase-locked 40 Hz visual responses in human. J Neurosci. 1996;16:4240–4249. doi: 10.1523/JNEUROSCI.16-13-04240.1996. [DOI] [PMC free article] [PubMed] [Google Scholar]
- Walter WG. Normal rhythms: their development, distribution and significance. In: Hill D, Parr G, editors. Electroencephalography. London: McDonald; 1950. [Google Scholar]


