Abstract
Recent experimental studies have revealed that up and down transitions exist in membrane potential of neurons. This paper focuses on the neurodynamical research of these transitions in a single neuron since it is the basic to study the transitions in the neural network for further work. The results show there exists two stable levels in the neuron called up and down states. And transitions between these two states are bidirectional or unidirectional with the values of parameters changing. We also study the periodic spontaneous activity of the transitions between up and down states without any inputting stimulus which coheres with the experimental results.
Keywords: Up and down transition, Bistability, Spontaneous activity, Ion channel model
Introduction
Different behavioral states of the animal are characterized by distinct patterns of global brain activity (Cheng-yu et al. 2009). Neural electrophysiology experiments show that during slow-wave sleep in the primary visual cortex of anesthetized animals (Anderson et al. 2000; Lampl et al. 1999; Steriade et al. 1993) and during quiet wakefulness in the somatosensory cortex of unanesthetized animals (Petersen et al. 2003), the membrane potentials make spontaneous transitions between two different levels called up and down states (Parga and Abbott 2007).
A hallmark of this subthreshold activity is a bimodal distribution of the membrane potential, with peaks at the mean potentials of depolarized and hyperpolarized states. Transitions between up and down states can also been evoked by sensory stimulation (Anderson et al. 2000; Petersen et al. 2003; Haider et al. 2007; Sachdev et al. 2004). Interestingly, patterns of sensory evoked activity are similar to those produced spontaneously. Studies in rats and cats report another interesting feature, the response to the stimulus depends on the state of the spontaneous fluctuations (Petersen et al. 2003). The effect appears to be dependent; in rats, if a sensory stimulus is applied when the recorded neuron is in a down state, responses are stronger than if it is applied during an up state (Petersen et al. 2003; Sachdev et al. 2004). In contrast, in cats, the stronger response occurs during the up state (Haider et al. 2007).
Why these transitions occur and whether this spontaneous activity engages in brain functions or not still remains unclear. In fact, we know little about expressions of neuron membrane potentials and interactions between neural networks, especially the relationship between neural coding modes and cognitive behaviors. So according to the view of reductionism, we start our research on up and down transitions from one single neuron, which is undoubtedly an effective method and the first step to study the mechanism of neural information processing. On the other hand, due to the limited technical means of the electrophysiology experiments, it is hard to record the data of large neural clusters in the same time. However, data of one single neuron is easy to be measured. So, obviously, figuring out the dynamics of a single neural up and down transitions is a basic for us to learn network activities and cognitive behavior.
Recent findings show that activation of a single cortical neuron can significantly modulate sensory perception and motor outputs (Brecht et al. 2004; Houweling and Brecht 2007; Cheng-yu et al. 2009). Furthermore, repetitive high-frequency burst spiking of a single rat cortical neuron could trigger a switch between the cortical states resembling slow-wave and rapid-eye-movement sleep (Cheng-yu et al. 2009). This is reflected in neural activity of the stimulated neuron changing from high frequency and low amplitude oscillations to low frequency and high amplitude ones or vice versa. At the same time, cortical local field potential (LFP) changes over time. Local field potential (LFP) is always used to describe the state of the whole cortex (Wang et al. 2009, 2008; Wang and Zhang 2007; Liu et al. 2010). Therefore, the up and down states of single neuron reflect distinct global cortical states, which resemble slow-wave and rapid-eye-movement sleep, respectively (Cheng-yu et al. 2009; Steriade et al. 1993; Destexhe et al. 1999; Gervasoni et al. 2004). All of these results point to the power of single cortical neurons in modulating the behavior state of animals (Cheng-yu et al. 2009).
This paper will report three characteristics, bistability, directivity and spontaneity, of up and down transitions, using the dynamical model of one single neuron. Bistability is regarded as key in understanding basic phenomena of cellular functioning. The importance of bistability and the related up and down transitions has been emphasized in different fields of research (Zheng and Zhang 2013; Araki 2013; Jia and Huaguang 2012; Njap et al. 2012), including spatial coherence resonance (Perc 2005, 2006; Perc and Marhl 2006). The insights have also been applied to biochemical (Gosak et al. 2007) and calcium (Perc et al. 2007).
Biophysical model
The single neural dynamic model based on H–H equations. H–H model is considered as an example to explain the ionic mechanisms underlying the initiation and propagation of action potential. Many other papers have considered the dynamics of H–H model in various aspects, including channel noise (Sun et al. 2011), spike latency (Ozer et al. 2009), spatial coherence (Sun et al. 2008), stochastic resonance (Ozer et al. 2009 et al).
In this paper, this dynamic model (Loewenstein et al. 2005) consists of the following three ionic currents: an instantaneous, inward current (sodium current), a slow h-like current, an outward current (a potassium current and a leak current). According to the numerical simulation of this models, we obtained results of up and down transitions and gave the analysis in view of ionic movement. Fortunately, some of the results are similar to ones observed in electrophysiology experiments. The current equation for the model is:
| 1 |
where,
| 2 |
| 3 |
| 4 |
| 5 |
where, .
Two types of persistent inward, persistent sodium and persistent calcium, have been characterized in Purkinje cells (Llinas and Sugimori 1980, 1980). Somatic Purkinje cell bistability has been associated with persistent sodium (Llinas and Sugimori 1980) whereas dendritic bistablity has been shown to result from persistent calcium conductance (Llinas and Sugimori 1980). Here we use persistent sodium in our model for simplicity but it is likely that it is the combination of these two currents that enables the bistablity (Loewenstein et al. 2005).
There are two dynamic variables: membrane potential and inactivation term of the h-current, when we discuss the bistability and directivity. But when study on the spontaneity, we add another variable called the inactivation term of potassium current to the model. They are called two-dimension-model and three-dimension-model, respectively. The dynamics of the inactivation terms of h-current and potassium current are:
| 6 |
| 7 |
where, , , , , , .
In these equations, represents membrane potential of the neuron, while replace a sodium current, a slow h-like current, a potassium current and a leak current, respectively. Similarly respectively represent the sodium conductance, the slow h-like conductance, the potassium conductance and the leak conductance, and are the corresponding reversal potentials. The inactivation terms of the sodium current, the h-like current, the potassium current are described by and dynamic variables and , with the time constant . And , are constants. The values of these parameters are showed in Table 1.
Table 1.
Values of the constants
| Constant | Values | Unit |
|---|---|---|
| μF/cm2 | ||
| ms/cm2 | ||
| mV | ||
| mV | ||
| mV | ||
| ms/cm2 | ||
| mV | ||
| mV | ||
| mV | ||
| /(mV s) | ||
| /s | ||
| mV | ||
| /(mV s) | ||
| /s | ||
| mV | ||
| mV | ||
| mV | ||
| mV | ||
| ms | ||
| ms/cm2 | ||
| mV |
Results
Bistability
Transitions between up and down states can be induced by two different kinds of stimuli. One is to add brief outward current pulses, another is to improve the sodium conductance to a certain value instantaneously.
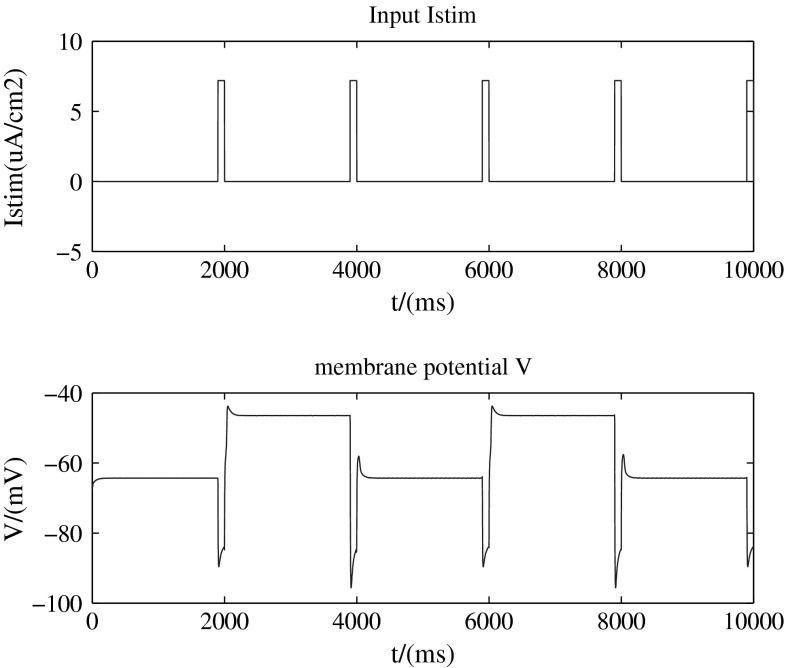
Figure 1 (with two-dimension-model, b = 1) presents a brief outward input current 0.1s, 7.2 μ A/cm2 which is added every two seconds (top) and the up (about −45 mV) and down (about −65 mV) transitions of the membrane potential provoked by the input stimulation (bottom).
Fig. 1.
Add a brief outward current pulses (0.1s, 7.2 μ A/cm2)
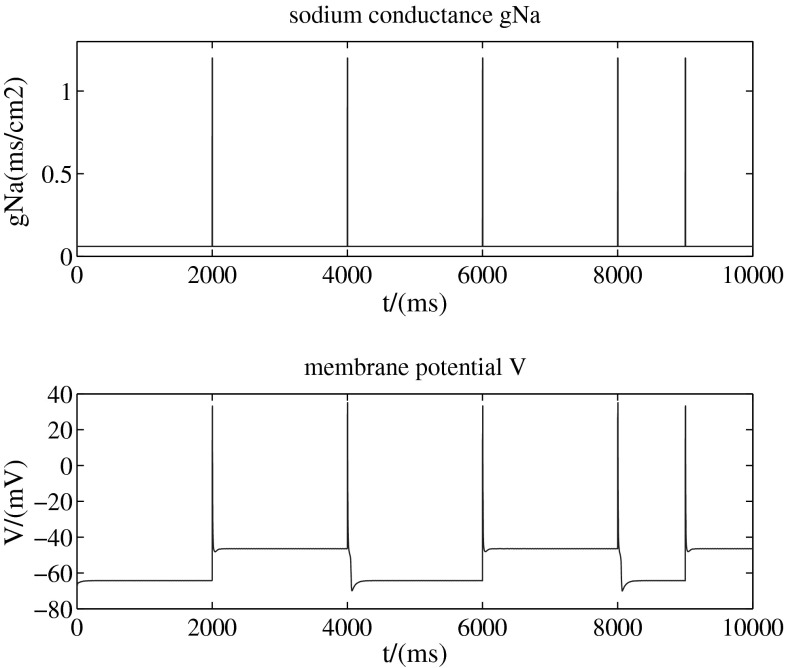
Figure 2 (with two-dimension-model, b = 1) shows a stimulation which increases the sodium conductance from 0.06 to 1.2 mS/cm2 instantaneously (top) and the up (about −45 mV) and down (about −65 mV) transitions of the membrane potential triggered by this kind of stimulation (bottom). These transitions are a little bit complex: the membrane potential rises up over 0 mV instantaneously but then drops quickly. In fact, here are the action potentials.
Fig. 2.
Increase the sodium conductance instantaneously (0.06–1.2 ms/cm2)
So from above two results, we find that this dynamic model can describe the bistalility of the up and down transitions of neural membrane potential. That means there are two stable states for membrane potential. The neuron can stay at any one of the two without input. When the neuron is stimulated, which destroys its original stability, it can switch its state from one to another to adjust itself to a new balance. These two states are called up state and down state respectively. That is to say, the up and down transitions can be modulated by external stimulations.
The ionic movement in and out of the membrane may be the mechanism of the transitions. In the situation of Fig. 2, when sodium conductance increases to a certain level, it causes slight depolarization, activating the sodium channel with sodium ions moving into cells, which increases membrane potential over than the threshold, leading to much more sodium ions moving into cells. When the membrane potential arrives to the peak value, the sodium channel is inactivated. While the potassium ions flow out of the cells, which leads to repolarization of the membrane potential. Then the repolarization activates the h-like channel, which involves the sodium and potassium ions going through, leading to sodium ions moving into cells. At the same time, potassium ions continue moving out of the cells, a new balance between the outflow of potassium and the inflow of sodium begins.
In another situation of Fig. 1, when we add outward current pulses, a kind of hyperpolarized stimulus, the h-like channel is activated, accompanying with sodium ions moving into cells. The slight depolarization is too small to trigger an action potential, so that the moving in and out ions get into balance with the membrane potential belows threshed. So the membrane potential stays in a stable state.
However, if we add a little depolarized stimulus to the cell in down state, there’s only parts of the sodium channels opening up with little sodium ions moving into cells. Also with the moving out of the potassium ions, membrane potential stays in an up stable state under the threshold. But from the up state, the little depolarized input is not enough to induce an action potential, so the membrane potential just returns back to up state after the movement of ions. As a result, bistability absents in this case. So as the case of large depolarized input. There will be action potential, but no phenomenon of bistability. In short, there is no bistability under the depolarized stimuli, whether the level of depolarization is little or much.
Directivity
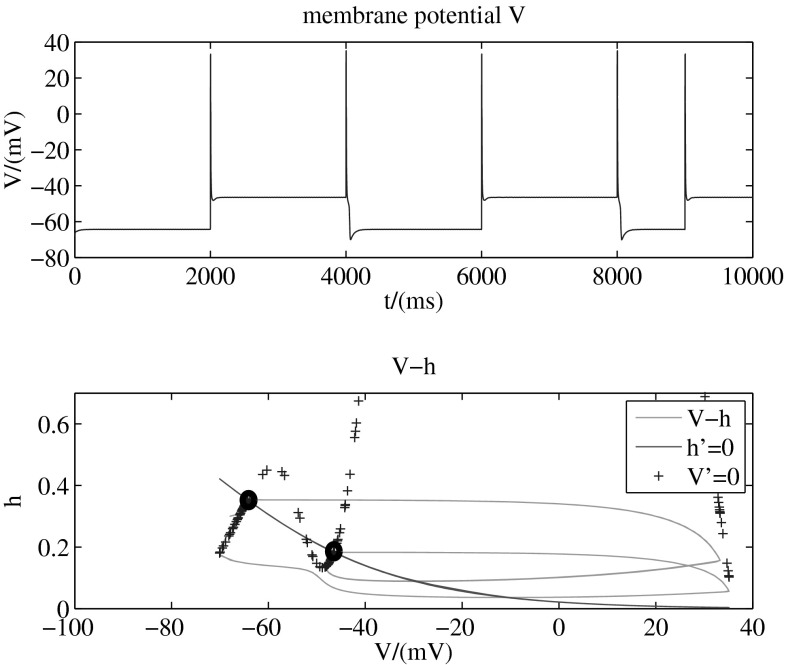
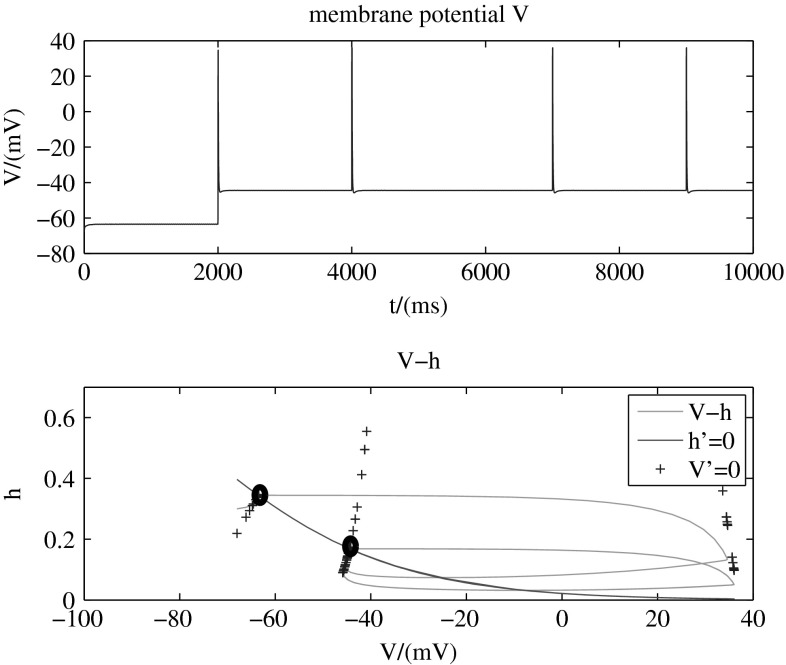
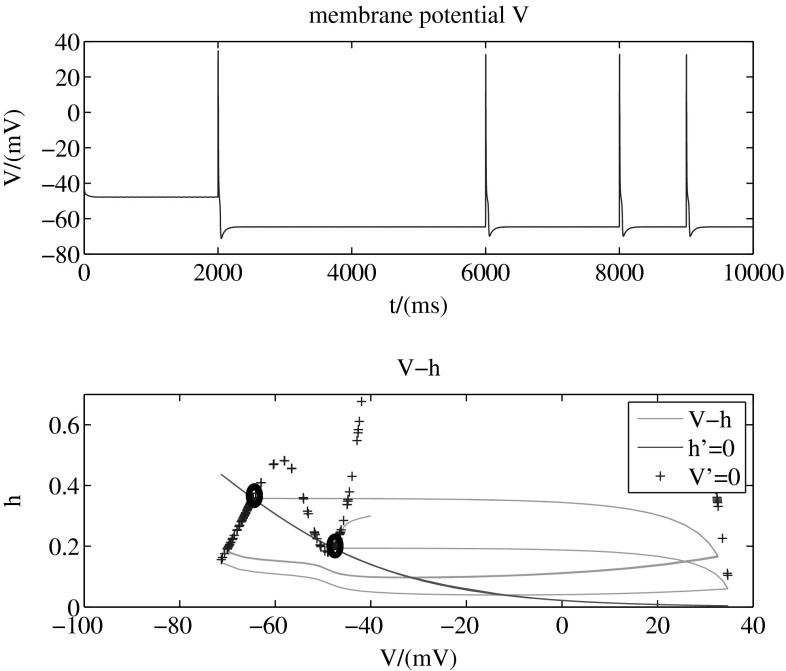
In the given model, directivity of the transition is modulated by potassium conductance. Figures 3, 4 and 5 (with two-dimension-model, b = 1) present different transition modes adjusted by different values of potassium conductance. The tops of these three figures are membrane potential , while the bottoms are phase planes for the two dynamic variables and in the model. The line (red, solid) shows all the points that , another line (blue, +) shows all the points that , and the intersection of these two lines is stable point of the system. In other words, the two points marked by black circles are stable points, and other points in the plane are unstable. That means, the system will stay in any one of the two stable points after a long run. The green solid line in the figure presents the transition process from one stable point to another.
Fig. 3.
Membrane potential and phase plane when mS/cm2. (Color figure online)
Fig. 4.
Membrane potential and phase plane when mS/cm2. (Color figure online)
Fig. 5.
Membrane potential and phase plane when mS/cm2. (Color figure online)
Figure 3 shows that when mS/cm2, membrane potential can transit from the down state to the up state by adding a stimulation that increases sodium conductance instantaneously. With the same stimulation, it also can transit from the up state to the down state. So the transitions are bidirectional on condition that mS/cm2. The phase plane further shows that the system transmits between the two stable states.
We can observe other phenomena by making some changes on the potassium conductance.
Figure 4 presents that when mS/cm2, membrane potential can transit from the down state to the up state by adding a stimulation that increases sodium conductance instantaneously. But with the same stimulation, the membrane potential always stays in the up state without any change. In other words, the transitions are unidirectional from the down state to the up state in the circumstance that mS/cm2. The phase plane also shows that the system can only vary from the lower membrane potential stable point to higher one and then move around the higher one periodically.
Figure 5 reveals that when mS/cm2, membrane potential can transit from the up state to the down state by adding a stimulation that increases sodium conductance instantaneously. However, with the same stimulation, the membrane potential always stays in the down state without any change. In other words, the transitions are unidirectional from the up state to the down state under the circumstance that mS/cm2. The phase plane also presents that the system can only vary from the higher membrane potential stable point to lower one and then move around the lower one periodically.
The above three results reveal that this dynamic model can describe the bidirectional or unidirectional characteristic of up and down transitions of neural membrane potential. That means the transitions can be both directions from the up state to the down one, and vice verse. Obviously, the transitions may be single direction from the up state to the down one, or only another direction from the down state to the up one.
To explain the mechanism of the bidirectional or unidirectional characteristic, we introduce the ionic movement again. When the level of potassium conductance is in an appropriate range, the case is the same as we illustrated in the bistability before.
When we improve the sodium conductance to induce the transitions, in the repolarization period, if the potassium channels are opened too less, there is less potassium ions flowing out. At the same time, the sodium ions move through the h-like channels into the cells. So there will be quick balance just after a little level of repolarization. So the stable state is always in the high membrane potential.
On the contrary, if the potassium channels are opened too much in the repolarization period, which means too much potassium ions flow out of the cells, there should be much more extent of the repolarization to stay at stable point. So the membrane potential is more likely to stabilize at down state.
Spontaneity
External stimulations are necessary when we discuss bistability and directivity of the up and down transition. Can the neuron still do transitions without any input? In fact, both in vivo and in vitro recordings indicate that neuronal membrane potentials can make spontaneous transitions distinct between up and down states (Parga and Abbott 2007). Therefore, we need further investigation in the spontaneity of the given model.
We add a new dynamic variable namely the inactivation term of potassium current to the given model since the former given model with only two dynamic variables is too simple for us to study spontaneity.
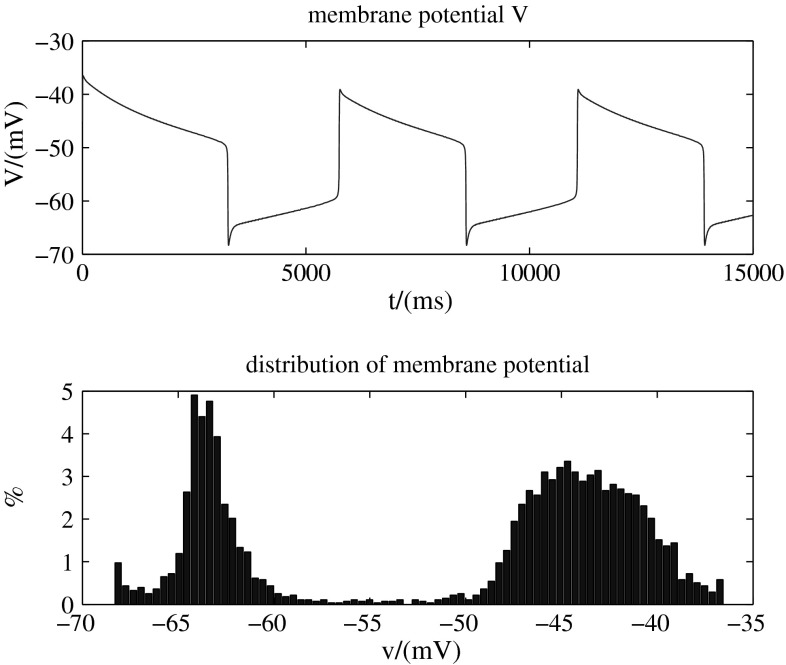
The calculation results are shown in Fig. 6. The top one shows that membrane potential presents spontaneous periodic transitions without any external stimulation. And the bottom one is the distribution of membrane potential, from which we can also find that the membrane potential almost stays in one of the up state and down state.
Fig. 6.
Membrane potential of spontaneous transitions and its distribution
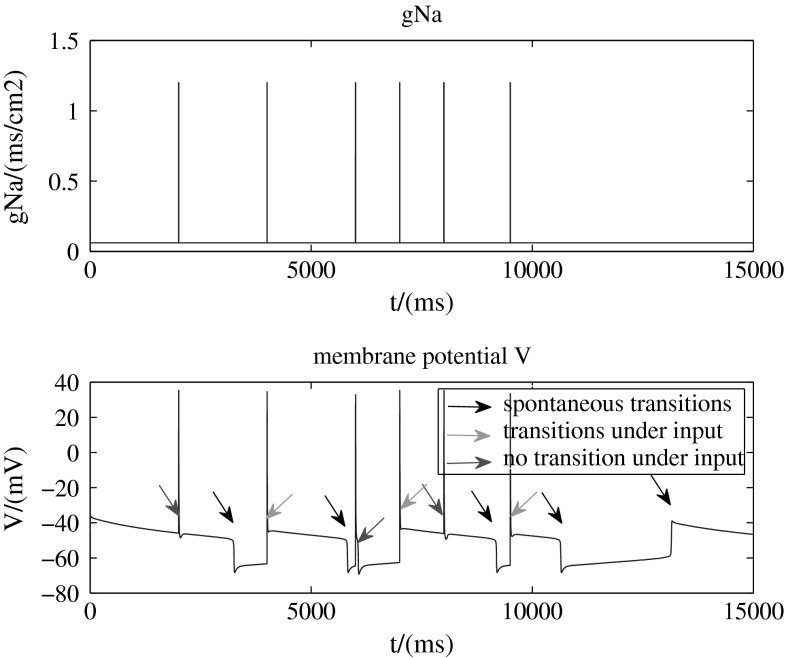
Then we add a stimulation which increases the sodium conductance from 0.06 to 1.2 mS/cm2 instantaneously to this three-dynamic-variable model. The results are showed in Figs. 7 and 8.
Fig. 7.
Adding stimulation to the model that can exhibit spontaneous transitions. (Color figure online)
Fig. 8.
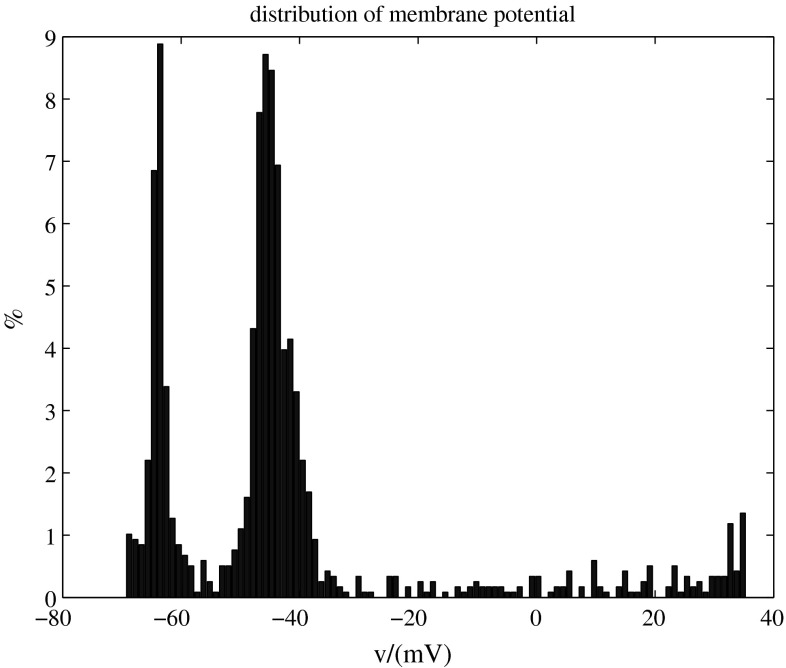
Distribution of the membrane potential
Figure 7 indicates that in the presence of synaptic input (top, increases the sodium conductance from 0.06 to 1.2 mS/cm2 instantaneously), the membrane potential transitions are more complex than before. Although most state transitions are triggered by synaptic input (green arrows), a minority of the transitions occur spontaneously (black arrows) and a minority of complex spikes in one state do not trigger a transition to another state (red arrows). This is due to the neuron that can do spontaneous transitions itself has own stability. The external inputs destroy this stability, so the neuron will make corresponding adjustment immediately, transmitting to another stable state or coming back to original stable state. An interesting phenomenon is that the neuron in the down state is more likely but not absolutely to be triggered by synaptic input than in the up state.
Figure 8 exhibits bimodal distribution of the membrane potential, which also reflects the bistability.
Above results indicate that the three-dynamic-variable model can describe periodic spontaneous transitions between the up and down states in the absence of synaptic input. And in this case, the fact that the neuron responses to stimulation has a certain relationship with which state the neuron stays. If a stimulus is applied when the neuron is in a down state, responses are stronger than if it is applied during an up state, as observed in experiments (Petersen et al. 2003; Sachdev et al. 2004).
Conclusion
This paper indicates three characteristics, bistability, directivity and spontaneity, of up and down transitions, using the dynamical model of one single neuron. The main conclusions are as follows:
This dynamic model can describe the bistalility of up and down transitions of neural membrane potential. The neuron can stay any one of the two without input. When the neuron is stimulated, it can switch its state from one to another to adjust itself to a new balance. These two states are called up state and down state respectively. That is to say, the up and down transitions can be modulated by external stimulations.
The dynamic model can describe the bidirectional or unidirectional characteristic of up and down transitions of neural membrane potential. That means the transitions can be both directions from the up state to the down one, and vice verse. Obviously, the transitions may be single direction from the up state to the down one, or only another direction from the down state to the up one. In these cases, the potassium conductance plays a key role to modulate the directivity.
The three-dynamic-variable model can describe periodic spontaneous transitions between the up and down states in the absence of synaptic input. And in this case, the fact that the neuron responses to stimulation has a certain relationship with which state the neuron stays. If a stimulus is applied when the neuron is in a down state, responses are stronger than if it is applied during an up state.
The above calculation results are very similar to experimental results observed (Anderson et al. 2000; Petersen et al. 2003; Parga and Abbott 2007; Haider et al. 2007; Sachdev et al. 2004), which illustrates our research on up and down transitions of neuronal membrane potential is successful and effective. To study up and down transitions of neural population and network, and to understand the role that a single neuron plays in the coupled neural networks are our next goals, as well as the foundation of knowing neural dynamic mechanism of network behaviors.
Contributor Information
Xuying Xu, Email: xu_xuying@126.com.
Rubin Wang, Email: rbwang@ecust.edu.cn, Email: rbwang@163.com.
References
- Anderson J, Lampl I, Reichova I, Carandini M, Ferster D. Stimulus dependence of two-state fluctuations of membrane potential in cat visual cortex. Nat Neurosci. 2000;3(6):617–621. doi: 10.1038/75797. [DOI] [PubMed] [Google Scholar]
- Araki O. Computer simulations of synchrony and oscillations evoked by two coherent inputs. Cogn Neurodyn. 2013;7(2):133–141. doi: 10.1007/s11571-012-9227-8. [DOI] [PMC free article] [PubMed] [Google Scholar]
- Brecht M, Schneider M, Sakmann B, Margrie TW. Whisker movements evoked by stimulation of single pyramidal cells in rat motor cortex. Nature. 2004;427(6976):704–710. doi: 10.1038/nature02266. [DOI] [PubMed] [Google Scholar]
- Cheng-yu TL, Poo M, Dan Y. Burst spiking of a single cortical neuron modifies global brain state. Science. 2009;324(5927):643–646. doi: 10.1126/science.1169957. [DOI] [PMC free article] [PubMed] [Google Scholar]
- Destexhe A, Contreras D, Steriade M. Spatiotemporal analysis of local field potentials and unit discharges in cat cerebral cortex during natural wake and sleep states. J Neurosci. 1999;19(11):4595–4608. doi: 10.1523/JNEUROSCI.19-11-04595.1999. [DOI] [PMC free article] [PubMed] [Google Scholar]
- Gervasoni D, Lin S-C, Ribeiro S, Soares ES, Pantoja J, Nicolelis Miguel AL. Global forebrain dynamics predict rat behavioral states and their transitions. J Neurosci. 2004;24(49):11137–11147. doi: 10.1523/JNEUROSCI.3524-04.2004. [DOI] [PMC free article] [PubMed] [Google Scholar]
- Gosak M, Marhl M, Perc M. Spatial coherence resonance in excitable biochemical media induced by internal noise. Biophys Chem. 2007;128(2):210–214. doi: 10.1016/j.bpc.2007.04.007. [DOI] [PubMed] [Google Scholar]
- Haider B, Duque A, Hasenstaub AR, Yu Y, McCormick DA. Enhancement of visual responsiveness by spontaneous local network activity in vivo. J Neurophysiol. 2007;97(6):4186–4202. doi: 10.1152/jn.01114.2006. [DOI] [PubMed] [Google Scholar]
- Houweling AR, Brecht M. Behavioural report of single neuron stimulation in somatosensory cortex. Nature. 2007;451(7174):65–68. doi: 10.1038/nature06447. [DOI] [PubMed] [Google Scholar]
- Jia B, Huaguang G. Identifying type I excitability using dynamics of stochastic neural firing patterns. Cogn Neurodyn. 2012;6(6):485–497. doi: 10.1007/s11571-012-9209-x. [DOI] [PMC free article] [PubMed] [Google Scholar]
- Lampl I, Reichova I, Ferster D. Synchronous membrane potential fluctuations in neurons of the cat visual cortex. Neuron. 1999;22(2):361–374. doi: 10.1016/S0896-6273(00)81096-X. [DOI] [PubMed] [Google Scholar]
- Liu Y, Wang R, Zhang Z, Jiao X. Analysis of stability of neural network with inhibitory neurons. Cogn Neurodyn. 2010;4(1):61–68. doi: 10.1007/s11571-009-9100-6. [DOI] [PMC free article] [PubMed] [Google Scholar]
- Llinas R, Sugimori M. Electrophysiological properties of in vitro purkinje cell somata in mammalian cerebellar slices. J Physiol. 1980;305(1):171–195. doi: 10.1113/jphysiol.1980.sp013357. [DOI] [PMC free article] [PubMed] [Google Scholar]
- Llinas R, Sugimori M. Electrophysiological properties of in vitro purkinje cell dendrites in mammalian cerebellar slices. J Physiol. 1980;305(1):197–213. doi: 10.1113/jphysiol.1980.sp013358. [DOI] [PMC free article] [PubMed] [Google Scholar]
- Loewenstein Y, Mahon S, Chadderton P, Kitamura K, Sompolinsky H, Yarom Yosef, Häusser Michael. Bistability of cerebellar purkinje cells modulated by sensory stimulation. Nat Neurosci. 2005;8(2):202–211. doi: 10.1038/nn1393. [DOI] [PubMed] [Google Scholar]
- Njap F, Claussen JC, Moser A, Hofmann UG. Modeling effect of gabaergic current in a basal ganglia computational model. Cogn Neurodyn. 2012;6(4):333–341. doi: 10.1007/s11571-012-9203-3. [DOI] [PMC free article] [PubMed] [Google Scholar]
- Ozer M, Uzuntarla M, Perc M, Graham LJ. Spike latency and jitter of neuronal membrane patches with stochastic hodgkin-huxley channels. J Theoret Biol. 2009;261(1):83–92. doi: 10.1016/j.jtbi.2009.07.006. [DOI] [PubMed] [Google Scholar]
- Ozer M, Perc M, Uzuntarla M. Stochastic resonance on newman-watts networks of hodgkin-huxley neurons with local periodic driving. Phys Lett A. 2009;373(10):964–968. doi: 10.1016/j.physleta.2009.01.034. [DOI] [Google Scholar]
- Parga N, Abbott LF. Network model of spontaneous activity exhibiting synchronous transitions between up and down states. Front Neurosci. 2007;1(1):57. doi: 10.3389/neuro.01.1.1.004.2007. [DOI] [PMC free article] [PubMed] [Google Scholar]
- Perc M. Spatial coherence resonance in excitable media. Phys Rev E. 2005;72(1):016207. doi: 10.1103/PhysRevE.72.016207. [DOI] [PubMed] [Google Scholar]
- Perc M. Thoughts out of noise. Eur J Phys. 2006;27(2):451. doi: 10.1088/0143-0807/27/2/026. [DOI] [Google Scholar]
- Perc M, Marhl M. Minimal model for spatial coherence resonance. Phys Rev E. 2006;73(6):066205. doi: 10.1103/PhysRevE.73.066205. [DOI] [PubMed] [Google Scholar]
- Perc M, Gosak M, Marhl M. Periodic calcium waves in coupled cells induced by internal noise. Chem Phys Lett. 2007;437(1):143–147. doi: 10.1016/j.cplett.2007.02.003. [DOI] [Google Scholar]
- Petersen CCH, Hahn TTG, Mehta M, Grinvald A, Sakmann B. Interaction of sensory responses with spontaneous depolarization in layer 2/3 barrel cortex. Proc Natl Acad Sci. 2003;100(23):13638–13643. doi: 10.1073/pnas.2235811100. [DOI] [PMC free article] [PubMed] [Google Scholar]
- Sachdev RNS, Ebner FF, Wilson CJ. Effect of subthreshold up and down states on the whisker-evoked response in somatosensory cortex. J Neurophysiol. 2004;92(6):3511–3521. doi: 10.1152/jn.00347.2004. [DOI] [PubMed] [Google Scholar]
- Steriade M, McCormick DA, Sejnowski TJ. Thalamocortical oscillations in the sleeping and aroused brain. Science. 1993;262(5134):679–685. doi: 10.1126/science.8235588. [DOI] [PubMed] [Google Scholar]
- Steriade M, Nuñez A, Amzica F. Intracellular analysis of relations between the slow (<1 hz) neocortical oscillation and other sleep rhythms of the electroencephalogram. J Neurosci. 1993;13(8):3266–3283. doi: 10.1523/JNEUROSCI.13-08-03266.1993. [DOI] [PMC free article] [PubMed] [Google Scholar]
- Sun X, Perc M, Kurths J. Spatial coherence resonance on diffusive and small-world networks of hodgkin-huxley neurons. Chaos: an interdisciplinary. J Nonlinear Sci. 2008;18(2):023102–023102. doi: 10.1063/1.2900402. [DOI] [PubMed] [Google Scholar]
- Sun XJ, Lei JZ, Perc M, Lu QS, Lv SJ. Effects of channel noise on firing coherence of small-world hodgkin-huxley neuronal networks. Eur Phys J B. 2011;79(1):61–66. doi: 10.1140/epjb/e2010-10031-3. [DOI] [Google Scholar]
- Wang R, Zhang Z. Energy coding in biological neural networks. Cogn Neurodyn. 2007;1(3):203–212. doi: 10.1007/s11571-007-9015-z. [DOI] [PMC free article] [PubMed] [Google Scholar]
- Wang R, Zhang Z, Chen G. Energy function and energy evolution on neuronal populations. IEEE Trans Neural Netw. 2008;19(3):535–538. doi: 10.1109/TNN.2007.914177. [DOI] [PubMed] [Google Scholar]
- Wang R, Zhang Z, Chen G. Energy coding and energy functions for local activities of the brain. Neurocomputing. 2009;73(1):139–150. doi: 10.1016/j.neucom.2009.02.022. [DOI] [Google Scholar]
- Zheng C, Zhang T. Alteration of phase-phase coupling between theta and gamma rhythms in a depression-model of rats. Cogn Neurodyn. 2013;7(2):167–172. doi: 10.1007/s11571-012-9225-x. [DOI] [PMC free article] [PubMed] [Google Scholar]


