

Abstract
In this study, we tested the underlying mechanisms of early emotional prosody perception, especially examined whether change detection in oddball paradigm was caused by emotional category and physical properties. Using implicit oddball paradigms, the current study manipulated the cues for detecting deviant stimuli from standards in three conditions: the simultaneous changes in emotional category and physical properties (EP condition), change in emotional category alone (E condition), and change in physical properties alone (P condition). ERP results revealed that physical property change increased brain responses to deviant stimuli in the EP than in the E condition at early stage 90–160 ms, suggesting that physical property change of emotional sounds can also be detected at the early stage. At the later stage 160–260 ms, the simultaneous and respective changes in emotional category and physical properties were reliably detected, and the sum of the brain responses to the corresponding changes in E and P conditions was equal to the brain responses to the simultaneous changes in EP condition. Source analysis further revealed that stimuli-driven regions (inferior parietal lobule), temporal and frontal cortices were activated at early stage, while only frontal cortices for higher cognitive processing were activated at later stage. These findings suggest that emotional prosody changes in physical properties and emotion category are perceived as domain-general change information in emotional prosody perception.
Keywords: Mismatch negativity (MMN), Emotional prosody, General-change detection, Emotional significance perception
Introduction
Rapid and accurate detection of affective signals from surroundings is adaptively crucial for humans and other animals to prepare for impending danger (Sauter and Eimer 2010). Emotional prosody conveyed in speech by modulating acoustic properties (e.g., pitch, intensity, and duration) is particularly important for understanding the speaker’s emotional state and intentions for successful communication (Dietrich et al. 2006). Early emotional prosody perception has been investigated broadly in cognitive neuroscience studies both on normal adults (Liu et al. 2012; Sauter and Eimer 2010) and patients, such as those with Williams syndrome (Pinheiro et al. 2011) and Asperger’s syndrome (Kujala et al. 2005), with methods such as event-related potentials (ERP) (Goydke et al. 2004), magnetoencephalography (MEG) (Thönnessen et al. 2010).
One popular paradigm used to explore the early perception of emotional prosody is implicit oddball paradigm. In this paradigm, participants are exposed to a stream of consecutive sounds that contain repeated standard stimuli and infrequent deviant stimuli, from different emotional categories, and required to perform a stimulus-unrelated task (e.g., watching a silent movie). Mismatch negativity (MMN), obtained by subtracting the brain responses to physically identical standards from those to occasional deviants, is considered to be associated with the involuntary attention switch caused by auditory changes (Näätänen et al. 2007, 2010). In the studies on emotional prosody, brain responses to repeated standard stimuli are compared with responses to deviant stimuli from different emotional categories. When deviants elicit stronger mismatch responses, the MMN is interpreted as an index of sensitivity to the difference between emotional categories (Goydke et al. 2004; Schirmer et al. 2005).
Given the difference in MMN amplitudes evoked by emotional and neutral vocalizations (Schirmer et al. 2005) or sounds from different emotional categories (Goydke et al. 2004), researchers infer that at around 200 ms after stimuli onset, listeners have already integrated primary cues and derived emotional significance. The detection of emotional category at around 200 ms is related to the second stage of the three-stage model of prosodic emotion perception (Schirmer and Kotz 2006). According to the model, emotional significance is extracted from a set of acoustic parameters along the auditory “what” pathway projecting from the superior temporal gyrus (STG) to the anterior superior temporal sulcus in a latency of 200 ms (Schirmer and Kotz 2006). This model is proposed on the bases of the results of a series of EEG studies on processing of emotional prosody, with the paradigms such as oddball.
The paradigm used identical sounds from one emotional category as standard stimuli and another emotional sound as deviant stimuli. In this case, whether these mismatch responses evoked in traditional emotional prosody oddball studies (Goydke et al. 2004; Schirmer et al. 2005) only reflect the detection of prosodic emotional category remains to be a question. The changes from standards to emotional deviants are not only in emotional category but also in physical properties of the sounds (e.g., intensity, pitch, phonological sequences, and so on), and both of them may be responsible for the observed MMNs (Thönnessen et al. 2010; Zevin et al. 2010). MMNs have been proved to be sensitive to salient changes in the habituation paradigm. That is, when stronger changes presented in experiment, participants were not sensitive to weak changes, suggesting that the brain response to category information is a domain-general detection (Zevin et al. 2010).
Previous ERP and fMRI studies on early emotional prosody perception have already provided evidence for the effects of change in physical properties alone. For example, changes in pitch of emotional sounds can modulate early brain response to deviant stimuli (Goydke et al. 2004), and changes in prosodic emotional intensity can modulate early brain response of N1 (Thierry and Roberts 2007). The fMRI studies also reveal a strong association between acoustic properties and cerebral responses, such as mid-superior temporal cortex for basic acoustic properties analysis (Ethofer et al. 2009a, b; Grandjean et al. 2005) and superior/inferior parietal lobule (SPL/IPL) along the auditory “where” stream for auditory spatial analysis (Ethofer et al. 2012; Sander et al. 2005). High-level cognitive regions are also involved in emotional prosody processing, such as medial frontal gyrus (MeFG) for the implicit evaluation of emotion or intentions (Amodio and Frith 2006; Sander et al. 2005), and middle/superior frontal gyrus (MFG/SFG) for emotion evaluation (Bach et al. 2008; Ethofer et al. 2009a, b).
One solution to eliminate the confounding of physical dimensions and emotional category changes is to detect the deviants in the background of constantly varying standard stimuli in a modified oddball paradigm. When the standard stimuli keep changing physically, emotional category could be the only reliable cue to detect deviants. Thönnessen et al. (2010) used 14 neutral disyllabic pseudo-words presented randomly as standard stimuli in a MEG study. The common feature shared by the standards was their neutral emotion, the deviant stimulus can only be detected by the change in emotional category. With the modified oddball paradigm this study found an early response (180–280 ms) to deviants evoked at the right temporal cortex, suggesting that emotional category was perceived at early stage.
A further question is whether sound property change can also be detected in traditional oddball paradigm containing the simultaneous changes in emotional category and physical properties. To clarify this question, it is useful to compare traditional and modified oddball paradigms, the former containing the simultaneous changes in emotional category and physical properties, and the later containing change only in emotional category.
The current study systematically manipulated the cues to deviants from standards, including four conditions: simultaneous changes in emotional category and physical properties (EP condition), change in emotional category alone (E condition), physical change alone (P condition) and an equiprobable control condition (C condition). The MMNs evoked in these conditions were examined. Two difference waves, traditional deviant-minus-standard and deviant-minus-control, were used to test the brain responses in EP, E and P conditions. Since the control stimuli embedded in stimulus sequences in C condition have the same physical characteristics and probability of occurrence as deviant stimuli in EP, E and P conditions, the deviant-minus-control difference wave has more genuine mismatch response compared to traditional deviant-minus-standard difference waves (Jacquemot et al. 2003; Kimura et al. 2009). Source analysis was conducted to reveal whether these effects could be explained in domain-general change detection.
Materials and methods
Ethics statement
All participants were provided written informed consent forms in accordance with the Declaration of Helsinki. The Ethics Committee of the Institute of Psychology, Chinese Academy of Sciences approved this study, its participant-recruitment procedure, and its methodology.
Participants
Twenty-nine university students (14 females, 15 males; mean age 22.41 years, range 19–27 years) participated in the experiment. All participants were right-handed native speakers of Mandarin Chinese with normal or corrected-to-normal vision and with no history of neurological disease or hearing deficits. They provided their written informed consent and were paid an hourly stipend. Data from the two male participants were excluded from the final analysis because of excessive artifacts during the electroencephalogram (EEG) recording sessions.
Materials and design
Sixteen syllables were created by editing the tones of natural syllables, which are meaningless and even do not exist in Chinese language. The syllables were pronounced by a professional female speaker with neutral and happy emotions, and sampled at a rate of 22,050 Hz. Twenty-six volunteers (14 females, 12 males), who did not participate in the following ERP experiment, were asked to rate the emotion valence of the syllables using a 9-point-scale, from 1 (very unpleasant) to 9 (very pleasant), and the arousal level from 1 (very calm) to 9 (very excited). Based on the rating results, 48 sounds were chosen as experimental stimuli, with each syllable read in three emotional types, that is, neutral, slightly happy, and very happy. Multiple comparisons (Bonferroni corrected) on the rating data revealed that three emotional types of the stimuli significantly differed from each other, both for valence and arousal levels (ps < .05) (Table 1). The gender effect was also analyzed, and no significant differences were observed between female and male volunteers for the emotional types (ps > .1).
Table 1.
Rating results of experiment stimuli
| Emotion | Neutral | Slightly happy | Very happy |
|---|---|---|---|
| Valence | 4.88 ± 0.54 | 6.78 ± 0.94 | 7.55 ± 1.06 |
| Arousal | 1.76 ± 1.26 | 6.39 ± 1.60 | 7.28 ± 1.32 |
The three types of stimuli were significantly different from each other both at the valence and arousal levels
In the oddball experiment, 16 very happy sounds used as deviant stimuli in three experimental conditions (i.e., EP, E, and P conditions) (Fig. 1), and neutral or slightly happy sounds as standard stimuli. The presentation of standard stimuli was manipulated to vary the cues for detecting deviants from standard stimuli. More specifically, in each block of the EP condition, a single neutral syllable was repeatedly presented as standard stimulus, and the participants would detect the very happy deviants from the neutral standards in terms of both emotional category and physical properties. In each block of the E condition, multiple neutral syllables were presented randomly as standard stimuli so that the emotional category was the only possible cue for deviance detection from neutral standards to very happy deviants. In each block of the P condition, a single slightly happy sound was repeatedly presented as standard stimulus, and the very happy deviants were detected in terms of change in the physical properties but not in the emotional category. In addition, an equiprobable control condition (C condition) was created by choosing sounds randomly from the continuously presented very happy sounds. Each very happy sound had the same probability of occurrence of deviant stimuli as in the other three conditions. Since the sixteen syllables were used as standard stimuli, deviants and control stimuli separately, then the effects of linguistic properties (such as number of strokes, phonological frequency, etc.) on experimental stimuli were matched among experiment conditions.
Fig. 1.

Experiment procedure and stimuli examples in one block. a Stimuli were presented in blocks of 44 s, followed by 6 s of silence. Each block contained 35 standard stimuli and 5 deviants from one condition. The mean duration of sounds was 500 ms, with ISI from 400 to 800 ms. b Material examples in one block of four conditions. Four conditions: (EP condition: simultaneous changes in emotional category and physical properties; E condition: emotional category change alone; P condition: physical property change alone; C condition: control condition). Emotional categories and arousal levels: (N, neutral sound; HS, slightly happy sound; HV, very happy sound)
Procedure
The participants were seated comfortably in a sound-attenuating chamber at a distance of about 120 cm away from the computer monitor to minimize eye movements. They were asked to watch a silent movie (with subtitles on) while being presented with auditory stimuli passively. The sounds were presented aurally through headphones. The sound volume was adjusted for each participant to ensure that all sounds could be heard clearly.
A block design was used, with each block containing 35 standard stimuli and 5 deviants (12.5 % probability of the deviant stimuli) (Fig. 1). The mean duration of each sound was 500 ms, with the inter-stimulus interval (ISI) of 400–800 ms. Each block lasted for about 44 s, followed by 6 s of silence. Sixteen blocks each condition, and four blocks each set, 16 sets were combined randomly in four runs. The participants rest for 2–3 min after each run. The total experiment lasted about 1 h.
ERP recording and data analysis
EEG was recorded with 64-channel Ag–AgCl electrodes mounted on an elastic cap with a sampling rate of 500 Hz. An electrode placed at the tip of the nose served as reference. Vertical electrooculogram (EOG) generated from eye-blinks were recorded supra- and infra-orbitally from the left eye. Horizontal EOG was recorded from the bilateral orbital rim. Impedances were kept below 5 kΩ. Signals were digitized with system filter settings at 0.5–100 Hz. EEG data were processed using the software NeuroScan 4.3. After eye-blink artifacts were corrected, the data were filtered offline with a low-pass filter of 30 Hz. ERP averages were computed with a 100-ms pre-stimulus baseline and a 600-ms ERP time window. Epochs with a signal change exceeding ±75 μV at any EEG electrode were rejected from averaging. On average, 8 % of the trials were excluded from further analysis.
Brain responses to deviant stimuli were averaged as deviant ERP waveforms, and brain responses to standard stimuli preceding each deviant stimulus were averaged as standard ERP waveforms. Brain responses to 80 stimuli that were randomly chosen from the control equiprobable condition (C condition) were averaged as control ERP waveform. In determining whether deviant stimuli could be detected automatically by human brain, two types of difference waves were calculated: traditional deviant-minus-standard difference waves, which are obtained by subtracting the responses to standard stimuli from those to deviant stimuli in the same condition, and deviant-minus-control difference waves, which are obtained by subtracting the responses to control stimuli from those to deviants with the same physical characteristics and probability of occurrence between the control stimuli in the C condition and deviant stimuli in the EP, E, and P conditions for a more genuine mismatch response (Jacquemot et al. 2003; Kimura et al. 2009).
Repeated measure ANOVAs were conducted by 3 (Deviant type: EP, E, and P) × 3 (Region: frontal, central, and parietal) × 3 (Hemisphere: left, middle, and right) on the mean amplitudes, and nine electrodes (i.e., F3, FZ, F4, C3, CZ, C4, P3, PZ, and P4) were chosen for analysis. A series of ANOVAs was conducted in consecutive mean amplitude latency bins of 10 ms from 0 to 300 ms post-stimulus onset. According to the different result patterns of the main effect and post hoc comparison for the Deviant type, time windows of 90–160 and 160–260 ms were determined for further analysis both on deviant-minus-standard and deviant-minus-control difference waves. Greenhouse–Geisser-corrected p values were used for ANOVA, and post hoc results were Bonferroni corrected.
Cortical sources activated by three deviant-minus-control difference waves were determined by applying source analysis of sLORETA (low-resolution brain electromagnetic tomography) to define neuroanatomical generators as additional supporting results (Jurcak et al. 2007; Pascual-Marqui 2002). sLORETA estimates the current source density distribution for epochs of brain electrical activity on a dense grid of 6,239 voxels at 5 mm spatial resolution. The voxel-based sLORATA-images were used to compare brain responses evoked by deviant stimuli and control stimuli at two time windows (90–160 and 160–260 ms). Activation maps and regions of the deviant-minus-control difference waves were obtained by first thresholding individual voxels at t value above 1.96 SD and then applying a subsequent cluster-size threshold of at least 10 voxels.
Results
Deviant-minus-standard difference waves
As shown in Fig. 2, the traditional deviant-minus-standard difference waves show that the largest negative deflection was evoked by the simultaneous changes in the emotional category and physical properties in the EP condition, and that the smallest was evoked by emotional category change in the E condition. No mismatch response was obtained by deviants in the P condition.
Fig. 2.

ERP waveforms for deviant-minus-standard difference waves. Grand average difference waves with nine electrodes (i.e., F3, FZ, F4, C3, CZ, C4, P3, PZ, and P4) are illustrated. At 90–160 and 160–260 ms, larger fronto-central mismatch responses were elicited by deviants in the EP condition than in the E condition; no mismatch response was elicited by deviants in the P condition. Topographical maps are illustrated below for each difference wave in two time windows
For time window 90–160 ms, the 3 (Deviant type: EP, E, and P) × 3 (Region: frontal, central, and parietal) × 3 (Hemisphere: left, middle, and right) repeated ANOVA reveals a significant main effect for Deviant type, F (2, 52) = 11.55, p < .01, η2p = .31, demonstrating that the difference waveform evoked by deviants in the EP condition [Mean Amplitudes (MA = −1.85 μV)] was more negative (p = .07, marginally significantly) than that in the E condition (MA = −1.05 μV); and in turn more negative than that in the P condition (MA = −0.14 μV) significantly (p < .05). The main effect on the brain region was also significant, F (2, 52) = 7.53, p < .01, η2p = .22, and a typical fronto-central distributed pattern of mismatch negative waveform was observed (Müller et al. 2002; Näätänen et al. 2010). Brain responses were more negative in the frontal and central than in the parietal region (ps < .05); no difference between the frontal and central regions was observed (p > .1). A significant interaction between Deviant type and Hemisphere was also observed, F (4, 104) = 3.41, p < .05, η2p = .12. The simple main effects of Deviant type were significant across the left, middle, and right hemispheres (ps < .05). In the left and middle hemispheres, a simple analysis indicates that difference waves evoked in the EP condition were more negative than those in the E condition and in turn were more negative than those in the P condition (ps < .05). In the right hemisphere, the difference waveforms in the EP and E conditions were significantly more negative than those in the P condition (ps < .05), but no difference between waveforms in the EP and E conditions was observed (p > .1).
For the time window 160–260 ms, the main effects were significant for the Deviant type, F (2, 52) = 12.88, p < .01, η2p = .33, and for Region, F (2, 52) = 10.42, p < .01, η2p = .29. Post hoc comparison reveals that the difference waveform in the EP condition (MA = −2.25 μV) was significantly more negative than that in the E condition (MA = −1.24 μV) (p < .05) and in turn was marginally significantly more negative than that in the P condition (MA = −0.56 μV) (p = .08). Deviant type interacted with brain Region, F (4, 104) = 3.41, p < .05, η2p = .12, and Hemisphere, F (4, 104) = 4.94, p < .01, η2p = .16. A simple analysis reveals that the difference wave evoked in the EP condition was more negative than that in the E condition and in turn was significantly more negative than that in the P condition in the frontal and central regions (ps < .05) and in the middle and right hemispheres (ps < .05).
The deviant-minus-control difference waves
As shown in Fig. 3, for the deviant-minus-control difference waves, different patterns of MMNs across conditions are observed during the two time windows of 90–160 and 160–260 ms.
Fig. 3.

ERP waveforms for deviant-minus-control difference waves. Grand average difference waves with nine electrodes (i.e., F3, FZ, F4, C3, CZ, C4, P3, PZ, and P4) are illustrated. At 90–160 ms, larger fronto-central mismatch response was elicited by deviants in EP condition than that in E condition, and no mismatch response was elicited in P condition. At 160–260 ms, larger frontal-central mismatch response was elicited by deviants in EP condition than that in E and P conditions. Topographical maps are illustrated below for each difference wave in two time windows
From 90 to 160 ms, the repeated ANOVA reveals that the significant main effects for Deviant type were F (2, 52) = 13.25, p < .01, η2p = .34, and those for Hemisphere were F (2, 52) = 3.49, p < .05, η2p = .12. Post hoc comparison shows that the difference waveform in the EP condition (MA = −1.43 μV) was more negative than that in the E condition (MA = −0.74 μV) (p = .09, marginally significantly) and in turn was significantly more negative than that in the P condition (MA = 0.11 μV) (p < .05). The Deviant type interacted with brain Region, F (4, 104) = 4.59, p < .01, η2p = .15; and Hemisphere factor, F (4, 104) = 2.4, p = .08, η2p = .08. A simple analysis indicates that the different waveform in the EP condition was more negative than that in the E condition and in turn was more negative than that in the P condition in the frontal and central regions (ps < .05) as well as in the middle and right hemispheres (ps < .05).
In the period of 160–260 ms, the main effects were significant for Deviant type, F (2, 52) = 11.50, p < .01, η2p = .31, Region, F (2, 52) = 11.01, p < .01, η2p = .3, and for Hemisphere, F (2, 52) = 5.36, p < .01, η2p = .17. Post hoc comparison reveals that the difference waveform in the EP condition (MA = −1.87 μV) was significantly more negative than that in the E condition (MA = −0.95 μV) and P condition (MA = −0.44 μV) (ps < .05). No significant difference was found between the waveforms in the E and P conditions (p > .1). The Deviant type interacted with Region, F (4, 104) = 10.51, p < .01, η2p = .29. In the frontal and central regions, a simple analysis indicates that the waveform evoked in the EP condition was more negative than that in the E and P conditions (ps < .05); no significant difference between waveforms in the E and P conditions was found (p > .1). In the parietal region, waveforms in the EP and E conditions were more negative than those in the P condition (ps < .05); no significant difference between waveforms in the EP and E conditions was found (p > .1).
Different processing patterns were inferred to occur at these two stages of 90–160 and 160–260 ms. Thus, a further 2 (Time window: 90–160, 160–260 ms) × 3 (Deviant type) × 3 (Region) × 3 (Hemisphere) repeated ANOVA was conducted. The results found a significant main effect for Time window, F (1, 26) = 5.00, p < .05, and a significant interaction effect for Time window × Deviant type × Region × Hemisphere, F (8, 208) = 2.30, p < .05. For time windows of 90–160 ms, deviants in the EP condition evoked larger fronto-central mismatch brain response than that in the E condition, while the change in physical properties alone was not detected in the P condition. From 160 to 260 ms, deviants in the EP condition also evoked larger fronto-central mismatch brain response than that in the E condition, while no significant difference was found between the waveforms in the E and P conditions. Further paired t test reveals that the empirically measured mismatch brain response elicited in the EP condition was equal to the sum of brain responses elicited in the E and P conditions (p > .1). This analysis confirmed the different processing patterns of two stages. Then source localization was conducted to serve as another leg of the argument that early and late time windows reflect different processes (Fig. 4).
Fig. 4.
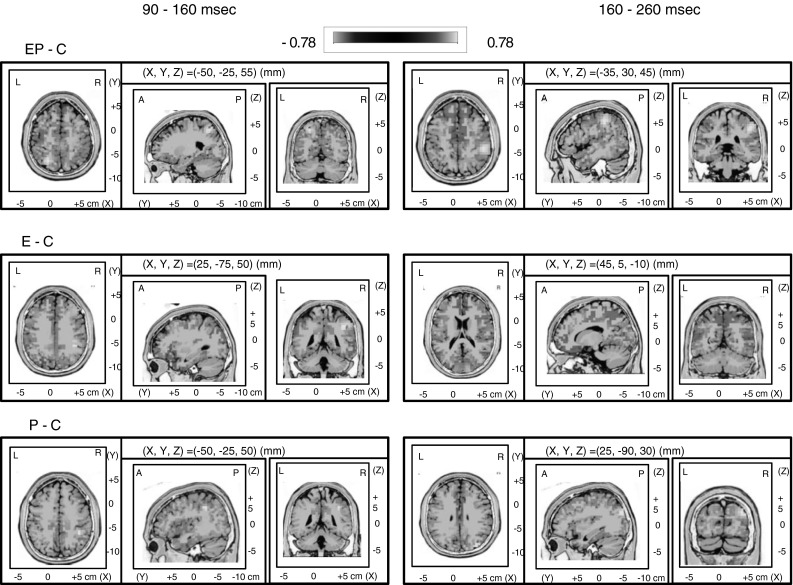
sLORETA maps for deviant-minus-control difference waves. sLORETA maps for the contrast between EP and C conditions (top row), E and C conditions (middle row), P and C conditions (bottom row), and during the early time window of 90–160 ms (left columns) and late time window of 160–260 ms (right columns) after stimulus onset. Blue deviant difference waves < control difference waves; Red control difference waves < deviant difference waves. Brain regions were activated mainly in EP and E conditions, including right auditory cortex, inferior frontal gyrus, and IPL at 90–160 ms. At the relatively later stage (160–260 ms), frontal regions (MeFG) were activated in the EP and E conditions. (Color figure online)
Source analysis
In the period of 90–160 ms, stimuli-driven regions (right IPL) were activated in EP and E conditions. More activation was evoked in the EP and E conditions in bilateral inferior/middle frontal gyrus (IFG/MFG). Right STG was also evoked in these three conditions. At the relatively later stage (160–260 ms), only the frontal regions were activated in the EP and E conditions, including bilateral MeFG. Cuneus were also activated, especially in the E condition.
Discussion
The current experiment investigated the underlying mechanisms in early emotional prosody perception using implicit oddball paradigm. We manipulated the detection cues of deviants from standards, in which emotional deviant stimuli were detected by simultaneous (EP condition) and respective changes (E condition and P condition) in emotional category and physical properties. The EEG data were analyzed in two time windows corresponding to the early and late processing stages in emotion prosody perception. We found that both physical properties and emotional significance could be detected at the very early stage, indicating that the emotion prosody change was perceived as a domain-general cue at the early stage.
Early stage
At very early stage, about 90 ms after stimulus onset, deviant stimuli were reliably detected in EP and E conditions, but not in P condition, and the amplitude of MMN in the EP condition was more negative than that in E condition. These results indicate that in EP condition the changes both in emotional category and physical properties were perceived and resulted in a larger change in the MMN amplitude than in E condition. The role of physical change for deviant detection in traditional oddball studies of emotional prosody was revealed.
It is possible that at the early stage human brains are sensitive to general information of emotional prosody, rather than specific emotional category information. Previous oddball studies on emotional prosody usually interpret MMNs elicited by emotional deviants as an index of sensitivity to difference in emotional categories (Goydke et al. 2004; Schirmer et al. 2005), due to the evolutionary significance and the processing priority of emotional information (Brosch et al. 2008, 2009). Other than category processing view, our results revealed the simultaneous change detection in emotional category and physical properties, supporting the idea of early general information of emotional prosody. Previous studies also found gradual increase of emotional intensity in voices (Chen and Yang 2012) and in faces (Utama et al. 2009) had line relation with early P2 component, demonstrating that just like music and speech, changes in emotional sounds were processed as a cue of general change processing.
No MMN was evoked by physical change alone in the P condition, which could be explained in terms of MMN properties and the existence of more salient emotion change contained in the entire experimental context. When the experimental context had more salient variations, brain responses to relatively weaker changes might be eliminated or delayed (Campanella et al. 2002; Zevin et al. 2010). Another explanation is that emotional salient stimuli may have attracted more attention resources than neutral stimuli (Grossmann et al. 2005). In the P condition, most of the attention resources were drawn by happy standards, little resources were left for deviants, so that no MMN was invoked by physical change alone.
For emotional prosody perception, an increasing number of neuroimaging studies have identified the functional neuroanatomical associations with different processing stages. At this early stage, source analysis results revealed activations in the IPL, right STG and the frontal region. The IPL, right auditory cortex with voice-sensitive activity, inferior frontal gyrus with vocal emotions recognition, have been identified as “emotional voice areas” (Ethofer et al. 2012). Particularly, the IPL was broadly activated in emotional prosody and linguistic tasks (Gandour et al. 2003; Wildgruber et al. 2005); and it is considered as the region for bottom-up sensory processing regardless of emotion (Ethofer et al. 2012) and attention resources (Buschman and Miller 2007). In our study, IPL activations were observed in the early stage across conditions based on the results of the sLORETA analysis, which could be related to bottom-up processing, such as spatial auditory analysis (Sander et al. 2005). Thus, the early perception of emotional sounds may not only be related to category perception, but also to the domain-general change information in early emotional prosody perception. Further studies combining EEG and fMRI are necessary to understand the dynamics of emotional prosody perception over time. Nonetheless, it is important to consider emotional information first as physical information than as an emotional category.
Late stage
At the relative later stage MMNs were found in all three conditions. The amplitude of MMN in the EP condition was equal to the sum of MMNs in E and P conditions. The results suggest that the changes in emotional category and physical properties can be detected separately, and that their effects can be accumulated when changing simultaneously, consistent with the additive characteristics of the auditory MMN component (Du et al. 2011).
As early MMN is supposed to reflect general processing, this later MMN is considered to reflect the emotional significance perception based on acoustic features integration (Schirmer and Kotz 2006). Previous studies consistently proposed that emotional significance is extracted after acoustic properties analysis. Thierry and Roberts (2007) found that louder neutral sounds elicit a N1 component and a P3a variation with a central distribution, and that emotional deviant sounds are only evoked the late P3a. Chen and Yang (2012) found that P2 is linearly correlated with the rate of happy sound (in the mixture of happy and neutral emotional sound), and that the brain distinguishes emotional categorical feature in the P3 interval.
The early and late MMNs found in our study were in line with the finding of MMN with two peaks, an earlier (eMMN) and a later component (lMMN), as suggested by previous studies. The studies proposed that the eMMN reflects the detection of differences in acoustic features, and lMMN reflects higher-order integrative processes in auditory perception, and they are more closely related to the cognitive demands of task and perception of auditory entities (Korpilahti et al. 2001). Therefore, this later stage is proposed to be sensitive to emotional significance processing based on acoustic feature integration.
In previous fMRI studies with implicit emotion judgments in the comparison between emotional and neutral changes, mainly the activations in the frontal cortex were observed at the later stage, such as MeFG (Gandour et al. 2003; Wildgruber et al. 2005). The engagement of frontal regions possibly reflects the implicit high evaluation of emotional significance in a top-down manner (Frühholz and Grandjean 2012).
It is interesting that prosodic emotional category and physical properties were processed simultaneously at the later stage. Each of them was a reliable cue for deviance detection, and their effects can be integrated into a larger mismatch response. These results are consistent with studies showing the simultaneous involvement of the right anterior STG and the right fronto-parietal operculum (Hoekert et al. 2008). A possible interactive view was inferred during emotional prosody perception. Recent neuroimaging studies have proved the interplay between bottom-up stimulus analysis and high-level cognitive evaluation in spoken sentence comprehension (Boulenger et al. 2011) and vocal emotion perception (Leitman et al. 2010; Wildgruber et al. 2009). For instance, Leitman et al. (2010) found that when acoustic cue salience increases, greater sensory-integrative processing in the temporal cortex and amygdala is gained, and that information processing in the inferior frontal gyrus and temporo-frontal connectivity is augmented by the increased recruitment of top-down resources when the salience of acoustic cue decreases.
In summary, by separating the role of emotional category and physical properties in the implicit oddball paradigm, our study gives novel insights into the underlying mechanisms of early emotional prosody perception. We revealed the effect of physical properties change, and found that emotional prosody could be detected at the very early stage as a cue of general change processing. The emotional significance could be perceived at a relatively later stage with the activation of some frontal regions.
Acknowledgments
This research was supported by the Natural Science Foundation of China (31070989), Open Research Fund of the State Key Laboratory of Cognitive Neuroscience and Learning (CNKOPYB0909). The authors would like to thank Xuhai Chen and Shuzhen Gan for data collection and discussions.
References
- Amodio DM, Frith CD. Meeting of minds: the medial frontal cortex and social cognition. Nat Rev Neurosci. 2006;7:268–277. doi: 10.1038/nrn1884. [DOI] [PubMed] [Google Scholar]
- Bach DR, Grandjean D, Sander D, Herdener M, Strik WK, et al. The effect of appraisal level on processing of emotional prosody in meaningless speech. Neuroimage. 2008;42:919–927. doi: 10.1016/j.neuroimage.2008.05.034. [DOI] [PubMed] [Google Scholar]
- Boulenger V, Hoen M, Jacquier C, Meunier F. Interplay between acoustic/phonetic and semantic processes during spoken sentence comprehension: an ERP study. Brain Lang. 2011;116:51–63. doi: 10.1016/j.bandl.2010.09.011. [DOI] [PubMed] [Google Scholar]
- Brosch T, Grandjean D, Sander D, Scherer KR. Behold the voice of wrath: cross-modal modulation of visual attention by anger prosody. Cognition. 2008;106:1497–1503. doi: 10.1016/j.cognition.2007.05.011. [DOI] [PubMed] [Google Scholar]
- Brosch T, Grandjean D, Sander D, Scherer KR. Cross-modal emotional attention: emotional voices modulate early stages of visual processing. J Cogn Neurosci. 2008;21:1670–1679. doi: 10.1162/jocn.2009.21110. [DOI] [PubMed] [Google Scholar]
- Buschman TJ, Miller EK. Top-down versus bottom-up control of attention in the prefrontal and posterior parietal cortices. Science. 2007;315:1860–1862. doi: 10.1126/science.1138071. [DOI] [PubMed] [Google Scholar]
- Campanella S, Gaspard C, Debatisse D, Bruyer R, Crommelinck M, et al. Discrimination of emotional facial expressions in a visual oddball task: an ERP study. Biol Psychol. 2002;59:171–186. doi: 10.1016/S0301-0511(02)00005-4. [DOI] [PubMed] [Google Scholar]
- Chen X, Yang Y (2012) When brain differentiates happy from neutral in prosody? In: Speech prosody, 6th international conference. Shanghai
- Dietrich S, Ackermann H, Szameitat DP, Alter K. Psychoacoustic studies on the processing of vocal interjections: how to disentangle lexical and prosodic information? Prog Brain Res. 2006;156:295–302. doi: 10.1016/S0079-6123(06)56016-9. [DOI] [PubMed] [Google Scholar]
- Du Y, He Y, Ross B, Bardouille T, Wu X, et al. Human auditory cortex activity shows additive effects of spectral and spatial cues during speech segregation. Cereb Cortex. 2011;21:698–707. doi: 10.1093/cercor/bhq136. [DOI] [PubMed] [Google Scholar]
- Ethofer T, Dimitri VDV, Klaus S, Patrik V. Decoding of emotional information in voice-sensitive cortices. Curr Biol. 2009;19:1028–1033. doi: 10.1016/j.cub.2009.04.054. [DOI] [PubMed] [Google Scholar]
- Ethofer T, Kreifelts B, Wiethoff S, Wolf J, Grodd W, et al. Differential influences of emotion, task, and novelty on brain regions underlying the processing of speech melody. J Cogn Neurosci. 2009;21:1255–1268. doi: 10.1162/jocn.2009.21099. [DOI] [PubMed] [Google Scholar]
- Ethofer T, Bretscher J, Gschwind M, Kreifelts B, Wildgruber D, et al. Emotional voice areas: anatomic location, functional properties, and structural connections revealed by combined fMRI/DTI. Cereb Cortex. 2012;22:191–200. doi: 10.1093/cercor/bhr113. [DOI] [PubMed] [Google Scholar]
- Frühholz S, Grandjean D. Towards a fronto-temporal neural network for the decoding of angry vocal expressions. NeuroImage. 2012;62:1658–1666. doi: 10.1016/j.neuroimage.2012.06.015. [DOI] [PubMed] [Google Scholar]
- Gandour J, Wong D, Dzemidzic M, Lowe M, Tong Y, et al. A cross-linguistic fMRI study of perception of intonation and emotion in Chinese. Hum Brain Mapp. 2003;18:149–157. doi: 10.1002/hbm.10088. [DOI] [PMC free article] [PubMed] [Google Scholar]
- Goydke KN, Altenmüller E, Möller J, Münte TF. Changes in emotional tone and instrumental timbre are reflected by the mismatch negativity. Cogn Brain Res. 2004;21:351–359. doi: 10.1016/j.cogbrainres.2004.06.009. [DOI] [PubMed] [Google Scholar]
- Grandjean D, Sander D, Pourtois G, Schwartz S, Seghier ML, et al. The voices of wrath: brain responses to angry prosody in meaningless speech. Nat Neurosci. 2005;8:145–146. doi: 10.1038/nn1392. [DOI] [PubMed] [Google Scholar]
- Grossmann T, Striano T, Friederici AD. Infants’ electric brain responses to emotional prosody. NeuroReport. 2005;16:1825–1828. doi: 10.1097/01.wnr.0000185964.34336.b1. [DOI] [PubMed] [Google Scholar]
- Hoekert M, Bais L, Kahn RS, Aleman A. Time course of the involvement of the right anterior superior temporal gyrus and the right fronto-parietal operculum in emotional prosody perception. PLoS One. 2008;3:e2244. doi: 10.1371/journal.pone.0002244. [DOI] [PMC free article] [PubMed] [Google Scholar]
- Jacquemot C, Pallier C, LeBihan D, Dehaene S, Dupoux E. Phonological grammar shapes the auditory cortex: a functional magnetic resonance imaging study. J Neurosci. 2003;23:9541–9546. doi: 10.1523/JNEUROSCI.23-29-09541.2003. [DOI] [PMC free article] [PubMed] [Google Scholar]
- Jurcak V, Tsuzuki D, Dan I. 10/20, 10/10, and 10/5 systems revisited: their validity as relative head-surface-based positioning systems. Neuroimage. 2007;34:1600–1611. doi: 10.1016/j.neuroimage.2006.09.024. [DOI] [PubMed] [Google Scholar]
- Kimura M, Katayama J, Ohira H, Schröger E. Visual mismatch negativity: new evidence from the equiprobable paradigm. Psychophysiology. 2009;46:402–409. doi: 10.1111/j.1469-8986.2008.00767.x. [DOI] [PubMed] [Google Scholar]
- Korpilahti P, Krause CM, Holopainen I, Lang AH. Early and late mismatch negativity elicited by words and speech-like stimuli in children. Brain Lang. 2001;76:332–339. doi: 10.1006/brln.2000.2426. [DOI] [PubMed] [Google Scholar]
- Kujala T, Lepisto T, Nieminen-von WT, Naatanen P, Naatanen R. Neurophysiological evidence for cortical discrimination impairment of prosody in Asperger syndrome. Neurosci Lett. 2005;383:260–265. doi: 10.1016/j.neulet.2005.04.048. [DOI] [PubMed] [Google Scholar]
- Leitman DI, Wolf DH, Ragland JD, Laukka P, Loughead J, et al. “It’s not what you say, but how you say it”: a reciprocal temporo-frontal network for affective prosody. Front Hum Neurosci. 2010;4:19. doi: 10.3389/fnhum.2010.00019. [DOI] [PMC free article] [PubMed] [Google Scholar]
- Liu T, Pinheiro AP, Deng G, Nestor PG, McCarley RW, et al. Electrophysiological insights into processing nonverbal emotional vocalizations. NeuroReport. 2012;23:108. doi: 10.1097/WNR.0b013e32834ea757. [DOI] [PubMed] [Google Scholar]
- Müller BW, Jüptner M, Jentzen W, Müller SP. Cortical activation to auditory mismatch elicited by frequency deviant and complex novel sounds: a PET study. Neuroimage. 2002;17:231–239. doi: 10.1006/nimg.2002.1176. [DOI] [PubMed] [Google Scholar]
- Näätänen R, Paavilainena P, Rinne T, Alho K. The mismatch negativity (MMN) in basic research of central auditory processing: a review. Clin Neurophysiol. 2007;118:2544–2590. doi: 10.1016/j.clinph.2007.04.026. [DOI] [PubMed] [Google Scholar]
- Näätänen R, Kujala T, Winkler IN. Auditory processing that leads to conscious perception: a unique window to central auditory processing opened by the mismatch negativity and related responses. Psychophysiology. 2010;48:4–22. doi: 10.1111/j.1469-8986.2010.01114.x. [DOI] [PubMed] [Google Scholar]
- Pascual-Marqui RD. Standardized low-resolution brain electromagnetic tomography (sLORETA): technical details. Methods Find Exp Clin Pharmacol. 2002;24(Suppl D):5–12. [PubMed] [Google Scholar]
- Pinheiro AP, Galdo-Álvarez S, Rauber A, Sampaio A, Niznikiewicz M, et al. Abnormal processing of emotional prosody in Williams syndrome: an event-related potentials study. Res Dev Disabil. 2011;32:133–147. doi: 10.1016/j.ridd.2010.09.011. [DOI] [PubMed] [Google Scholar]
- Sander D, Grandjean D, Pourtois G, Schwartz S, Seghier ML, et al. Emotion and attention interactions in social cognition: brain regions involved in processing anger prosody. Neuroimage. 2005;28:848–858. doi: 10.1016/j.neuroimage.2005.06.023. [DOI] [PubMed] [Google Scholar]
- Sauter DA, Eimer M. Rapid detection of emotion from human vocalizations. J Cogn Neurosci. 2010;22:474–481. doi: 10.1162/jocn.2009.21215. [DOI] [PubMed] [Google Scholar]
- Schirmer A, Kotz SA. Beyond the right hemisphere: brain mechanisms mediating vocal emotional processing. Trends Cogn Sci. 2006;10:24–30. doi: 10.1016/j.tics.2005.11.009. [DOI] [PubMed] [Google Scholar]
- Schirmer A, Striano T, Friederici AD. Sex differences in the preattentive processing of vocal emotional expressions. Neuroreport. 2005;16:635–639. doi: 10.1097/00001756-200504250-00024. [DOI] [PubMed] [Google Scholar]
- Thierry G, Roberts MV. Event-related potential study of attention capture by affective sounds. Neuroreport. 2007;18:245–248. doi: 10.1097/WNR.0b013e328011dc95. [DOI] [PubMed] [Google Scholar]
- Thönnessen H, Boers F, Dammers J, Chen Y-H, Norra C, et al. Early sensory encoding of affective prosody: neuromagnetic tomography of emotional category changes. Neuroimage. 2010;50:250–259. doi: 10.1016/j.neuroimage.2009.11.082. [DOI] [PubMed] [Google Scholar]
- Utama NP, Takemoto A, Koike Y, Nakamura K. Phased processing of facial emotion: an ERP study. Neurosci Res. 2009;64:30–40. doi: 10.1016/j.neures.2009.01.009. [DOI] [PubMed] [Google Scholar]
- Wildgruber D, Riecker A, Hertrich I, Erb M, Grodd W, et al. Identification of emotional intonation evaluated by fMRI. Neuroimage. 2005;24:1233–1241. doi: 10.1016/j.neuroimage.2004.10.034. [DOI] [PubMed] [Google Scholar]
- Wildgruber D, Ethofer T, Grandjean D, Kreifelts B. A cerebral network model of speech prosody comprehension. Int J Speech-Lang Pathol. 2009;11:277–281. doi: 10.1080/17549500902943043. [DOI] [Google Scholar]
- Zevin JD, Yang J, Skipper JI, McCandliss BD. Domain general change detection accounts for “dishabituation” effects in temporal-parietal regions in functional magnetic resonance imaging studies of speech perception. J Neurosci. 2010;30:1110–1117. doi: 10.1523/JNEUROSCI.4599-09.2010. [DOI] [PMC free article] [PubMed] [Google Scholar]