

Abstract
A primary goal in evolutionary biology is to identify the historical events that have facilitated the origin and spread of adaptations. When these adaptations also lead to reproductive isolation, we can learn about the evolutionary mechanisms contributing to speciation. We reveal the complex history of the gene MaMyb2 in shaping flower colour divergence within a recent radiation of monkeyflowers. In the Mimulus aurantiacus species complex, red-flowered M. a. ssp. puniceus and yellow-flowered M. a. ssp. australis are partially isolated because of differences in pollinator preferences. Phylogenetic analyses based on genome-wide variation across the complex suggest two origins of red flowers from a yellow-flowered ancestor: one in M. a. ssp. puniceus and one in M. a. ssp. flemingii. However, in both cases, red flowers are caused by cis-regulatory mutations in the gene MaMyb2. Although this could be due to distinct mutations in each lineage, we show that the red allele in M. a. ssp. puniceus did not evolve de novo or exist as standing variation in its yellow-flowered ancestor. Rather, our results suggest that a single red MaMyb2 allele evolved during the radiation of M. aurantiacus that was subsequently transferred to the yellow-flowered ancestor of M. a. ssp. puniceus via introgressive hybridization. Because gene flow is still possible among taxa, we conclude that introgressive hybridization can be a potent driver of adaptation at the early stages of divergence that can contribute to the origins of biodiversity.
Keywords: adaptation, speciation, hybridization, Mimulus, flower colour
1. Introduction
A primary goal in evolutionary biology is to identify the historical events that have led to adaptive differences between populations. Although recent studies have characterized the genetic changes underlying adaptation in several systems [1–5], the conditions surrounding the origins of adaptive alleles are rarely known. The classic view is that natural selection operates either on new mutations or on standing variation that is already present within populations [6–8]. However, despite controversy surrounding the importance of natural hybridization in evolution [9–14], it is becoming more widely appreciated that introgressive hybridization can promote adaptation by transferring advantageous alleles across taxonomic boundaries [15–24]. This is especially true in recent evolutionary radiations, such as in Heliconius butterflies and Darwin's finches [25–27], where gene flow among taxa has provided a fertile supply of beneficial genetic material that has allowed for rapid and repeated divergence. Thus, comprehensive analyses that distinguish among alternative historical scenarios are necessary for understanding the evolutionary mechanisms that are responsible for the origins of biodiversity.
Moreover, it is well known that reproductive isolation can evolve as a by-product of ecological adaptation to different environments [28–31]. Therefore, the processes of adaptation and speciation are often intimately linked, suggesting that if we can understand the origins of adaptations that contribute to reproductive isolation, we can learn about the history of speciation. However, speciation is a gradual process that can occur across a broad range of scenarios and spatial settings [32,33], potentially leading to a complex history of genetic changes underlying adaptive divergence. In addition, reproductive barriers continue to accumulate long after speciation is complete [34,35]. As a consequence, the traits and genes affecting isolation in extant species pairs may differ from when speciation commenced. By contrast, by studying taxa at an early stage of divergence, it is possible to investigate the evolutionary history of the genetic changes contributing to adaptation and reproductive isolation before they become confounded with other species differences.
The Mimulus aurantiacus species complex (Phrymaceae) is a recently radiated, monophyletic group of perennial shrubs comprising eight subspecies distributed mainly in California [36] (figure 1a). Despite being phenotypically and ecologically distinct from one another, all taxa in the complex are at least partially interfertile and hybridize in narrow areas if their geographical ranges overlap [38–42]. Of the traits that differ among the subspecies, variation in flower colour is the most striking, with two red-flowered subspecies and six yellow or yellow-orange-flowered subspecies occurring across the range of the complex (figure 1a).
Figure 1.

Evolutionary relationships within the Mimulus aurantiacus species complex. (a) Geographical locations of the 60 samples used for phylogenetic analysis, representing the eight subspecies of M. aurantiacus and the outgroup, M. clevelandii. Representative, standardized photographs of their flowers are presented. (b) Maximum-likelihood tree illustrating the relationships among the sampled individuals. Support values at all major nodes are indicated based on 100 bootstrap replicates. The four major clades (A–D) are indicated. Branches are coloured yellow to reflect the ancestral state (i.e. the probability of a character state transition at a node is less than 0.02). Branches are coloured red when the probability of a transition to red flowers (i.e. anthocyanins present) exceeded 0.98. (c) Bar plot showing the probability of membership (Q score) of each individual to one of four genotypic clusters, as revealed by the program Structure [37]. (d) Plots of the first two axes from principal components analyses (PCA) including either all ingroup samples (left) or only samples from Clade D (right). Dashed ellipses connect samples within clades (left) or within subspecies (right). The per cent variation explained by each axis is reported. (Online version in colour.)
In southern California, red-flowered M. a. ssp. puniceus and yellow-flowered M. a. ssp. australis co-occur in a narrow region where their geographical ranges overlap [42]. In a classic example of incipient speciation [43,44], pre-mating reproductive isolation has evolved between the subspecies largely as a by-product of ecological adaptation to different pollinators [42,45]. Specifically, hummingbird and hawkmoth pollinators rarely transition between flowers of each subspecies, resulting in strong, but incomplete pollinator isolation [42,45]. In support of the hypothesis that flower colour is adaptive and a major driver of these preferences, geographical variation in flower colour is maintained despite ongoing gene flow at neutral loci [46]. Moreover, extensive genetic differentiation exists between the subspecies in MaMyb2, the gene primarily responsible for the transition in flower colour [47]. However, even though this group has had a long record of taxonomic study, the evolutionary relationships among subspecies and the number and direction of flower colour transitions are unresolved, making it difficult to infer the historical events that facilitated local adaptation.
In this study, we investigate the history of flower colour evolution in the M. aurantiacus complex. Using genome-wide variation, we produce the first resolved phylogeny for the complex and use ancestral state reconstructions to infer the order and number of flower colour transitions across the group. Although red flowers appear to have evolved twice from yellow-flowered ancestors, our genetic analyses revealed that red flowers in each lineage were caused by cis-regulatory mutations in the same gene, MaMyb2. While this could be due to independent mutations in each lineage, population genetic and genomic techniques show that the recent origin of red flowers in M. a. ssp. puniceus did not arise de novo or from ancestral variation retained in its yellow-flowered ancestor. Therefore, rather than arising twice as suggested by the phylogenetic analyses, our results indicate that a red MaMyb2 allele arose once during the radiation of M. aurantiacus and was shared with the ancestor of M. a. ssp. puniceus via introgressive hybridization. Thus, transitions from yellow to red flowers have a shared genetic basis that is shrouded by a complex history.
2. Results and discussion
(a). Analysis of genome-wide variation suggests two origins of red flowers
As an initial step towards understanding the history of flower colour evolution in the M. aurantiacus species complex, we used patterns of genome-wide variation to provide the first detailed, molecular account of the relationships among subspecies. We sequenced restriction-site associated DNA tags (RAD) across 60 populations from all eight subspecies and the outgroup, M. clevelandii, and identified 41 528 SNPs that met our filtering requirements. Several methods of phylogenetic reconstruction (Bayesian, maximum-likelihood, neighbour joining and coalescent) were applied to these data, and all recovered well-supported topologies consisting of the same four clades (A–D in figure 1b; electronic supplementary material, figure S1). Additional non-tree-based approaches, including a Bayesian clustering algorithm (figure 1c) [37] and principal components analysis (PCA; figure 1d), recovered clusters of individuals that coincided with the major clades in the common tree topology. The four clades are moderately to highly differentiated from one another (range of between-clade FST: 0.30 to 0.75; range of proportion of fixed differences between clades: 0.004–0.305; electronic supplementary material, table S2), and similar to levels of differentiation reported for other recent evolutionary radiations [27,48,49].
Previously described taxa [41,50] generally formed reciprocally monophyletic groups within one of the four clades. Clade A consisted entirely of individuals of M. a. ssp. bifidus from northeastern and central California. Clade B included individuals from two subspecies, M. a. ssp. aridus from southeastern California and M. a. ssp. flemingii that is endemic to the Channel Islands off the California coast. Clade C comprised samples from M. a. ssp. aurantiacus and M. a. ssp. calycinus in central to northern California. M. a. ssp. calycinus was also found in the diverse Clade D from southern California, which also included M. a. ssp. longiflorus, M. a. ssp. australis, and M. a. ssp. puniceus. Pigment extractions revealed that only the red-flowered M. a. ssp. puniceus and M. a. ssp. flemingii produce red anthocyanin pigments in their corolla tissue, whereas the remaining subspecies do not, resulting in their yellow or yellow-orange flowers (electronic supplementary material, figure S2). Hereafter, we refer to taxa using only their subspecific names.
We draw two initial conclusions from these analyses that are pertinent for investigating the origins of flower colour differences. First, ancestral state reconstructions suggest that yellow flowers (i.e. anthocyanin absent) are ancestral in M. aurantiacus, with red flowers derived once in Clade B in the lineage leading to flemingii and once in Clade D in the lineage leading to puniceus (figure 1b). Thus, based on phylogenetic analyses, anthocyanins appear to have been gained independently in the flowers of each red-flowered subspecies. Our second conclusion is that puniceus and australis are each other's closest relatives. Samples of the red-flowered puniceus are nested within the clade of yellow-flowered australis, supporting the previous conclusion that puniceus and australis are at a very early stage in the speciation process [42].
(b). Red flowers in each subspecies are caused by cis-regulatory mutations in MaMyb2
Although puniceus and flemingii are distantly related within the M. aurantiacus complex, our genetic analyses indicate that their red flowers are caused by cis-regulatory mutations in the same gene. Previous work has shown that red flowers in puniceus are caused primarily by a cis-regulatory mutation in the R2R3-MYB transcription factor MaMyb2, which activates the expression of at least three genes (MaF3h, MaDfr and MaAns) that encode enzymes necessary for the biosynthesis of red anthocyanin pigment [47].
Consistent with these results, genetic variation in MaMyb2 significantly co-segregates with floral anthocyanin production in F2 hybrids generated from a cross between red-flowered flemingii and yellow-flowered aridus (ordinal logistic regression, likelihood ratio χ2 = 127.5; d.f. = 2; p < 0.0001, R2 = 0.39; figure 2a). In addition, we found significantly elevated expression of MaMyb2 and its putative targets in both flemingii and puniceus relative to the yellow-flowered taxa (figure 2b). We used virus-induced gene silencing (VIGS) to show that this change in gene expression at MaMyb2 was necessary for the production of red flowers in flemingii, just as it was for puniceus [47]. By post-transcriptionally knocking down MaMyb2 expression in flemingii, we revealed greatly reduced anthocyanin production in floral tissue (figure 2c), which resulted in significantly lower expression of MaMyb2 and its putative target genes relative to negative controls (figure 2d). Finally, to determine whether differences in MaMyb2 floral expression could be attributed to cis- or trans-acting mutations, we examined variation in allele-specific expression among F1 heterozygotes. A significant allelic imbalance would indicate cis-regulation, whereas similar expression of both alleles would demonstrate a mutation acting in trans [51]. In flowers of F1 hybrids between flemingii and either yellow-flowered australis or aridus, transcripts containing the flemingii allele were significantly over-represented relative to transcripts containing the australis or aridus allele (Fisher's exact test comparing allele frequencies in cDNA relative to gDNA; p < 10−7 in five F1s; electronic supplementary material, table S3).
Figure 2.

MaMyb2 controls flower colour in flemingii. (a) Genotype at MaMyb2 explains variation in floral anthocyanin production in F2 hybrids between flemingii and aridus. Mean phenotypic scores (+1 s.d.) are plotted for each genotype at a SNP marker in MaMyb2 diagnostic for either the flemingii or the aridus grandparental allele (R or Y, respectively). (b) Floral expression of MaMyb2 and its putative target genes is significantly elevated in red flowers of puniceus and flemingii relative to the yellow-flowered subspecies. Error bars represent one standard error. Similar letters connect genes that are not statistically different from each other. (c) Representative photos in side, top, and front view of flemingii flowers in either the control group (top) or MaMyb2-silenced group (bottom) from VIGS experiments. (d) Compared to negative controls (black bars), MaMyb2 VIGS silencing (white bars) leads to significantly fewer floral transcripts of MaMyb2 and its putative targets. Error bars represent one standard error; asterisks represent p < 0.001 for all genes. (Online version in colour.)
These results demonstrate that red flowers in puniceus and flemingii are both controlled by cis-regulatory mutations in MaMyb2. However, determining whether these are due to the same or different mutations will require extensive functional testing of candidate SNPs using transgenic approaches, something that is not yet feasible in M. aurantiacus. Regardless, the history of MaMyb2 divergence across the species complex appears noteworthy, in that red flowers either arose independently in each lineage because of separate gain-of-function mutations in MaMyb2 or there was a single mutation that was subsequently shared between lineages.
(c). Divergence of MaMyb2 between puniceus and australis is not consistent with their recent shared history
Although previous evidence revealed that the derived, red MaMyb2 allele became fixed in puniceus due to positive selection by pollinators [47], the conditions surrounding its origin are not clear. One possible explanation is that a novel mutation arose in the ancestor of puniceus in an environment that strongly favoured it, leading to its rapid fixation. This scenario predicts low levels of haplotype diversity in gene regions that are tightly linked to the causal mutation. Alternatively, the red MaMyb2 allele may have been present in an ancestral australis population as standing variation prior to it having been favoured by selection. In this scenario, the causal element is likely to be found on many different haplotypes.
To test these expectations, we investigated patterns of MaMyb2 haplotype variation between puniceus and australis. Despite gene flow between the subspecies, variants in MaMyb2 are known to be tightly associated with flower colour differences [47], allowing us to use sequence data to make inferences about the origin of derived red flowers in puniceus. We observed very low haplotype diversity in puniceus, with a single MaMyb2 haplotype found in nearly all samples (29/32 = 91% of sequenced alleles; figure 3). By contrast, we recovered 15 different haplotypes from 40 sampled australis alleles (frequency range 2.5–35%). This reduction in MaMyb2 diversity cannot be attributed to a recent demographic bottleneck in the ancestor of puniceus, as both subspecies have similar levels of genome-wide nucleotide diversity across populations (mean πpuniceus = 0.00148 ± s.d 2.03 × 10⁻⁴; mean πaustralis = 0.00141 ± s.d 2.59 × 10⁻⁴). In addition, the presence of a single, high frequency MaMyb2 haplotype in puniceus is not consistent with the red allele having existed as standing variation in an ancestral population of australis. Instead, these patterns support the rapid spread of a novel MaMyb2 allele in puniceus due to a recent selective sweep that caused this segment of the gene to rise to high frequency.
Figure 3.
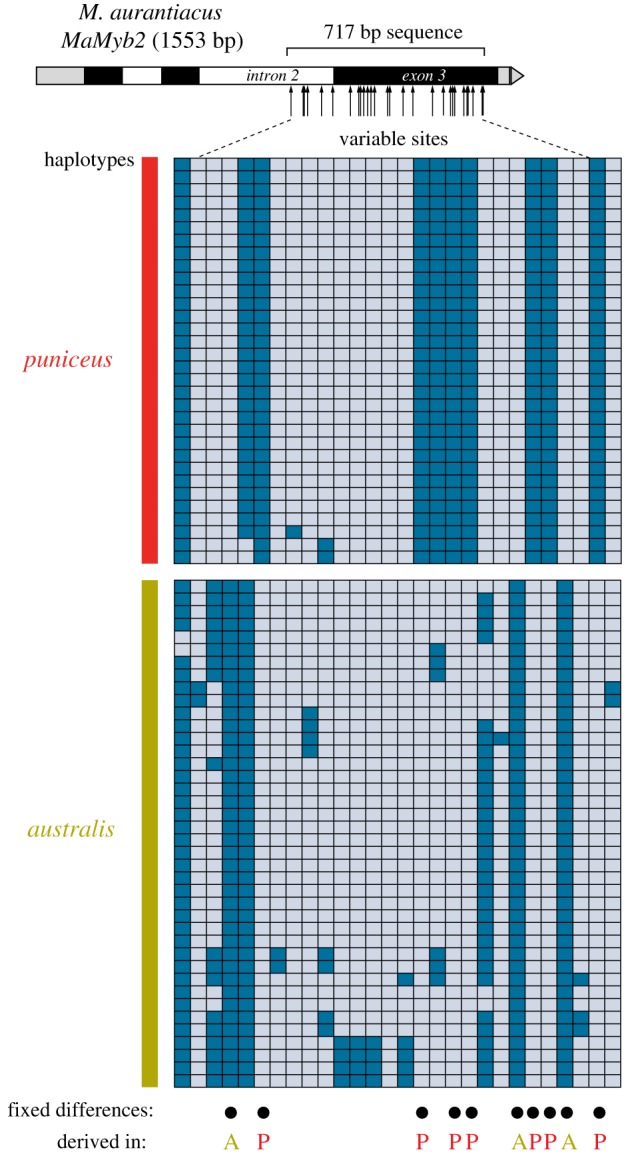
Divergence of MaMyb2 between puniceus and australis is not consistent with their recent shared history. The diagram at the top shows the structure of the MaMyb2 gene, with the location of the sequenced region indicated, along with arrows depicting the relative position of the 28 variable sites between puniceus and australis. Grey boxes represent 5′ and 3′ untranslated regions, and black and white boxes indicate exons and introns, respectively. Each row in the main diagram shows a phased haplotype including only the segregating sites from 16 puniceus and 20 australis individuals. Each segregating site is depicted as a grey or blue box that represents ancestral or derived sites, respectively, as determined by comparison with sequence from the M. clevelandii outgroup. Black circles indicate the position of the 10 differentially fixed sites, with the site labelled as A or P to represent whether the derived nucleotide is found in australis or puniceus, respectively. (Online version in colour.)
The recent shared history between puniceus and australis (figure 1) predicts that MaMyb2 sequences from puniceus should closely resemble sequences that are present in modern-day australis. However, we observed no haplotype sharing and 10 differentially fixed sites between puniceus and australis (figure 3). The presence of any fixed differences is striking given that none were found in a genome-wide comparison that surveyed more than 740 kb and 14 000 SNPs across 18 individuals from each subspecies [42]. As a consequence, the level of sequence divergence at MaMyb2 is an order of magnitude greater than the genome-wide average (mean p-distance, MaMyb2: 0.0160 ± s.d. 0.002; genome-wide: 0.00150 ± s.d. 0.00037). Moreover, when the 10 differentially fixed sites were polarized as ancestral or derived relative to the M. clevelandii outgroup, the derived SNP was found in australis three times and in puniceus seven times (figure 3). Based on the recent shared ancestry of puniceus and australis, it is unexpected to find nucleotides that are derived and fixed in australis but absent from puniceus. Thus, although these data provide compelling support for recent, strong selection on the red-flowered allele in puniceus, we conclude that this allele did not evolve de novo from a sequence that was present in its yellow-flowered ancestor. Rather, it appears that the common MaMyb2 haplotype found in puniceus originated at some other point in the evolutionary history of the species complex. The subsequent sharing of this haplotype with puniceus could have occurred either through introgressive hybridization with a third subspecies, which transferred the haplotype to the ancestor of puniceus, or through lineage sorting, which resulted in the fixation of an ancestral red allele in puniceus.
(d). MaMyb2 was transferred between divergent subspecies via introgressive hybridization
To identify the potential source of the divergent MaMyb2 sequences recovered from puniceus, we sequenced the same region of MaMyb2 in the remaining six subspecies (electronic supplementary material, table S1) and constructed a network of the phased haplotypes based on the number of nucleotide differences between them. Of the 152 sequenced MaMyb2 alleles, we recovered 53 unique haplotypes separated by a maximum of 32 mutational steps (4.5% divergence; figure 4a). In general, haplotypes sampled from each of the four clades tended to group together and were separated from neighbouring haplotypes by fewer connections than those recovered from different clades. Moreover, only a single haplotype was shared between subspecies (electronic supplementary material, figure S3). By contrast, the haplotypes recovered from puniceus represented the only exception, as they differed from the haplotypes recovered from Clade D by at least 10 changes (figure 4a). These data provide further evidence that the red allele in puniceus is not derived from a locally evolved yellow-flowered allele that pre-existed in Clade D. Instead, the puniceus haplotypes grouped with the haplotypes recovered from Clade B, which contained the red-flowered flemingii and the yellow-flowered aridus.
Figure 4.

Introgressive hybridization has led to the transfer of MaMyb2 into puniceus. (a) Haplotype network based on the number of differences among the 53 unique MaMyb2 haplotypes recovered from 76 individuals across all eight subspecies. Each haplotype is represented by a circle, the size of which is proportional to its observed frequency. Colours correspond to flower colour, coded as anthocyanins present (red) or absent (yellow), as determined in electronic supplementary material, figure S2. Black circles show the number of mutational steps separating haplotypes. Dashed polygons enclose haplotypes recovered from each of the four major clades, as depicted in the inset phylogeny cartoon redrawn from figure 1. (b) Pairwise sequence divergence at MaMyb2 among unique haplotypes. Frequency distributions of p-distance (the proportion of sites that differ between haplotypes) are plotted for comparisons within and between subspecies. Sample size reflects the number of pairwise estimates made for that comparison, and differences in the means (blue bar) between comparisons were tested using a permutation test with 10 000 randomizations. (c) Haplotype structure between puniceus and aridus. Only unique haplotypes within each subspecies are shown, with the colour coding of ancestral and derived sites the same as in figure 3. The common haplotype in puniceus is indicated by a red star. Sample sizes are indicated and represent the number of gene copies sequenced in each subspecies. The aridus haplotype that is most similar to the common puniceus haplotype is presented first and differs by only two changes, one of which is fixed and private to puniceus (black circle). (Online version in colour.)
The random sorting of a red MaMyb2 allele that arose much earlier (i.e. in the ancestor of Clades B, C and D; node I, figure 1b) could explain a shared genetic basis for red flowers in both flemingii and puniceus. However, instead of finding MaMyb2 haplotypes that were shared among clades, we observed patterns consistent with the complete sorting of MaMyb2 variation across clades and subsequent lineage-specific sequence evolution (figure 4a). Indeed, with the exception of only the puniceus haplotypes, the major groups in the MaMyb2 gene network were completely associated with the four primary clades in our subspecies tree (figure 4a). Alternatively, an ancestral red MaMyb2 allele may have sorted differentially among lineages due to variation in selection pressures across the range of M. aurantiacus. This would have required the long-term maintenance of red and yellow MaMyb2 alleles by balancing selection, followed by at least five independent losses of red flowers since the common ancestor of Clades B and D (Node I). Moreover, if the red allele that eventually fixed in puniceus was maintained as a polymorphism over this timescale, we would expect it to be present on many haplotypes due to the effects of mutation and recombination. However, as discussed above, the presence of a single, high frequency MaMyb2 haplotype in puniceus contradicts our expectations that the red allele was maintained as a balanced polymorphism prior to sweeping to fixation in puniceus. Therefore, our data do not support the differential sorting of an ancestral polymorphism as the source of the red MaMyb2 allele in puniceus.
Rather, the discordant position of puniceus haplotypes in the MaMyb2 network indicates that an ancestral individual from Clade B transferred the haplotype to puniceus via introgressive hybridization. Because the introgression event occurred in the past, subsequent sequence evolution and/or extinction prevent us from identifying the precise donor sequence. However, due to the recent radiation of the complex, we predicted that haplotypes in the modern-day descendants of the donor would remain similar to those found in puniceus. Interestingly, although flemingii also has red flowers, mean sequence divergence at MaMyb2 between puniceus and flemingii is greater than the levels observed within flemingii (p < 7.53 × 10⁻⁵; permutation test; figure 4b, electronic supplementary material, figure S3). By contrast, mean pairwise divergence between puniceus and aridus (0.46% ± s.d. 0.23) is not significantly different from the diversity found among aridus haplotypes (0.43% ± s.d. 0.27; p = 0.893; permutation test). Moreover, despite the complex structure of the 10 fixed differences between puniceus and australis (figure 3), or the six fixed differences between puniceus and flemingii (electronic supplementary material, figure S3), only a single substitution distinguishes the puniceus haplotypes from those recovered in aridus (figure 4c). These results indicate that flemingii is unlikely to be the modern-day descendant of the donor. Rather, the similarity of the puniceus and aridus haplotypes, and their discordance with flemingii, reveals that an ancestral aridus-like individual transferred the MaMyb2 haplotype to puniceus.
Even though it is surprising that the MaMyb2 sequences from puniceus are more similar to those found in yellow-flowered aridus than they are to red-flowered flemingii (figure 4b), our data are consistent with the potential for hybridization among these taxa based on their current geographical ranges (figure 1a). In particular, flemingii occurs only on the Channel Islands off the coast of California and does not co-occur with puniceus or australis. By contrast, aridus is distributed in a narrow region adjacent to the eastern edge of the australis range [52], suggesting that hybridization between them may have been possible in the recent past. Although historical ranges may have differed, which could lead to other possibilities, the most likely scenario to explain our results is that an aridus-like individual transferred the red MaMyb2 allele directly to puniceus, giving the allele an immediate selective advantage. An alternative possibility is that the introgressed region conferred yellow flowers at the time it was transferred to puniceus, but a novel cis-regulatory mutation arose in MaMyb2 on the introgressed haplotype to give puniceus its red flowers. While we cannot rule this scenario out, the cis-regulatory mutation would have had to occur on that rare haplotype almost immediately after introgression to account for the remarkable similarities of haplotypes in puniceus and aridus. Thus, based on current evidence, it seems likely that a red MaMyb2 allele arose once in the common ancestor of flemingii and aridus but was lost from aridus after it was transferred to puniceus. Future genomic analyses of this region, coupled with functional assays of regulatory elements, will allow us to conduct a more detailed test of this hypothesis.
3. Conclusion
In this study, our analysis of genome-wide variation suggested that red flowers evolved twice independently during the radiation of the M. aurantiacus species complex. However, in each case, a cis-regulatory mutation in the gene MaMyb2 activated the expression of the same three enzymes, leading to the production of anthocyanin pigments in floral tissue. While these transitions in flower colour might reflect two independent gain-of-function mutations that each arose during the relatively short history of this group, our data do not indicate that the red-flowered allele in puniceus evolved de novo from a sequence already present in its yellow-flowered ancestor. Moreover, the occurrence of a single, high-frequency MaMyb2 haplotype in puniceus that is remarkably similar to those recovered from aridus is not consistent with selection acting on a retained ancestral polymorphism. Therefore, although most population genetic models of adaptation contend that natural selection operates either on new mutations or on standing genetic variation that is already present in the population [6–8], our data support a scenario where a red MaMyb2 allele was introgressed into puniceus following hybridization with a now extinct red-flowered individual from Clade B. The fact that the allele is not found in australis despite ongoing gene flow is consistent with a prominent role for natural selection by hummingbird and hawkmoth pollinators that display strong, opposing preferences for flowers of puniceus and australis, respectively [42,45,47].
It has been argued for nearly a century that adaptive genetic variation is frequently transferred across taxonomic boundaries due to introgressive hybridization [12,13,15–19,53]. Recent examples from a diversity of systems reveal that introgression can result in the spread of adaptations between distinct taxa [21,23,24,54,55]. However, in Heliconius butterflies, introgressed wing pattern loci contribute to both predator avoidance and pre-mating isolation [25,26], providing one of the only examples where introgressive hybridization has facilitated local adaptation while simultaneously promoting divergence [12,27,56]. Our results suggest that introgression of the red MaMyb2 allele into the ancestor of puniceus was a primary driver of pollinator-mediated divergence that has led to the initial stages of reproductive isolation. This is further supported by the fact that the genomes of puniceus and australis are largely undifferentiated, implying that a few key loci such as MaMyb2 have been critical for divergence [42,47]. Moreover, as a consequence of the recent radiation in the M. aurantiacus species complex, taxa have retained the potential to exchange genes with each other, which has allowed for the spread of an allele that facilitated adaptive divergence.
4. Material and methods
(a). Genomic methods and data processing
We sequenced restriction-site associated DNA (RAD) tags from a single individual from 60 populations among the eight subspecies of M. aurantiacus and the outgroup, M. clevelandii (electronic supplementary material, table S1). DNA isolations and RAD library preparation followed the methods in [57] and have been described in [42]. Loci were created with the denono_map.pl script in Stacks v. 1.06, with three identical raw reads required to create a stack, up to three mismatches allowed between loci for an individual, and up to eight mismatches allowed when joining loci among individuals. From this, single nucleotide polymorphisms (SNPs) were identified and genotypes called for each individual using the populations program in Stacks, requiring that loci were present at a minimum depth of 8× in more than 90% of samples.
(b). Phylogenetic and population genomic analyses
Four different methods of phylogenetic reconstruction were used to infer the evolutionary relationships among the genotyped individuals: maximum-likelihood, Bayesian, neighbour joining and coalescent. Analyses were conducted using either the complete dataset of 41 528 SNPs or were further filtered to include 915 biallelic SNPs found on different tags that had minor allele frequencies greater than 0.1 and were present in 58 of the 60 populations. In addition to the tree-based methods, we ran a Bayesian model-based clustering algorithm, implemented in the program Structure, as well as a principal components analysis, to examine patterns of genotypic clustering among individuals. Finally, to examine the levels of genomic differentiation among the four primary clades (see Results and discussion), we estimated average pairwise FST and the total number (and proportion) of segregating sites that were fixed between each pair of clades. Details of each analysis can be found in the electronic supplementary material.
(c). Ancestral state reconstruction
We performed an ancestral state reconstruction to infer the number and direction of evolutionary transitions in flower colour during the radiation of M. aurantiacus. Character states (presence or absence of red anthocyanin pigment) were determined from extractions of total floral anthocyanidins using 200 mg of fresh corolla tissue from each of the in-group taxa and M. clevelandii, following methods described in [58,59]. Pigment extracts were adsorbed onto a cellulose thin layer chromatography plate and resolved using Forestal solvent [59]. We used a one-parameter maximum-likelihood model, implemented in Mesquite v. 3.01, to infer the relative probabilities of each character state at each node of the maximum-likelihood tree.
(d). Genetics of red flowers in flemingii
To determine whether genetic variation in MaMyb2 was associated with floral anthocyanin production in flemingii, we tested for an association between MaMyb2 genotype and floral anthocyanin production in 146 F2 hybrids generated from a cross between red-flowered flemingii and yellow-flowered aridus. Using quantitative real-time PCR (QPCR), we then assayed for differences among subspecies in floral expression of MaMyb2, as well as three anthocyanin pathway genes (MaF3h, MaDfr and MaAns) known to have higher expression in puniceus relative to australis [47,58]. To examine whether changes in MaMyb2 gene expression were necessary for elevated floral anthocyanin production, we post-transcriptionally silenced MaMyb2 in flowers of flemingii using a VIGS system that we described previously for puniceus [47]. Relative gene expression of MaMyb2, MaF3h, MaDfr and MaAns between VIGS and control flowers was quantified using QPCR. To determine whether elevated MaMyb2 expression in flemingii flowers could be attributed to cis- or trans-acting factors, we followed methods described in [47] to compare allelic differences in MaMyb2 expression in F1 hybrids between red-flowered flemingii and either yellow-flowered australis or aridus. Details of all analyses can be found in the electronic supplementary material.
(e). MaMyb2 sequencing
We used Sanger sequencing of purified PCR products to obtain a 717-bp region of MaMyb2 from M. clevelandii and 76 individuals across all eight M. aurantiacus subspecies (electronic supplementary material, table S1). Previous analyses have demonstrated that SNP markers in this segment of the gene are tightly associated with flower colour differences between puniceus and australis [47]. Sequences were checked manually for quality and heterozygotes called from double peaks in the chromatograms. Because our analyses primarily examined population genetic questions related to sequence divergence among puniceus, australis, flemingii and aridus, we most heavily sampled from populations within these taxa (electronic supplementary material, table S1). PCR primers used were: 5′-TTGGGTACTGACCTAGTTGG-3′ and 5′-CTTTGGAGGAATAGTCCAAGT-3′.
(f). Population genetic analyses
MaMyb2 sequences were aligned manually and haplotypes inferred using the program PHASE, as implemented in DNASP v. 5.10 [60]. Insertion–deletion polymorphisms were included in the analyses and coded as present or absent. We polarized derived and ancestral nucleotide changes relative to the M. clevelandii sequence. Mean pairwise levels of sequence divergence were estimated between puniceus and australis using Mega v. 6. These were compared to genome-wide estimates of pairwise divergence between subspecies by re-analysing a previously published RADseq dataset [42]. This analysis consisted of Illumina sequenced RAD-tags from six individuals from each of three populations within each subspecies and resulted in 14 398 SNPs segregating in 7989 different 95-bp regions across the genome. Pairwise sequence divergence across the 758 955 sequenced sites was calculated in Mega v. 6, and mean estimates of nucleotide diversity (π) across populations within each subspecies were calculated in Stacks v. 1.06.
We constructed a MaMyb2 haplotype network from all recovered haplotypes among subspecies based on an infinite site model and uncorrected distances using the Pegas package in R [61]. All connections were reconstructed with a probability greater than 0.97.
To determine the most likely modern descendant of the donor for the MaMyb2 haplotypes recovered in puniceus, we estimated levels of pairwise sequence divergence among unique haplotypes within three potential donor subspecies: australis, flemingii and aridus. We then obtained estimates of pairwise sequence divergence between unique puniceus haplotypes and potential donor haplotypes. Mean estimates of divergence within and between subspecies were compared to null distributions based on 10 000 permutations of the data, as implemented in a custom script in R.
Supplementary Material
Acknowledgements
We thank Josh Bahr and Stephanie Le for assistance with data collection; Chris Smith for support with RAD sequencing; William Bradshaw, William Cresko, Christina Holzapfel, Keith Karoly, Thomas Nelson, Anne Royer, Chris Smith, Stacey Smith, James Sobel, Suzanne Renner and two anonymous reviewers for comments on previous versions of this manuscript.
Data accessibility
All data from the article have been made publicly available on Dryad (http://dx.doi.org/10.5061/dryad.33mp5), GenBank (KT355497-KT355573) and on the Sequence Read Archive: (SRX1121822).
Authors' contributions
M.A.S. designed the experiments. S.S. and M.A.S. analysed the data and wrote the manuscript.
Competing interests
The authors declare no competing interests.
Funding
This project was supported by the University of Oregon and National Science Foundation awards DEB-1258199 and DEB-1311686 to M.A.S.
References
- 1.Chan YF, et al. 2010. Adaptive evolution of pelvic reduction in sticklebacks by recurrent deletion of a Pitx1 enhancer. Science 327, 302–305. ( 10.1126/science.1182213) [DOI] [PMC free article] [PubMed] [Google Scholar]
- 2.Hopkins R, Rausher MD. 2011. Identification of two genes causing reinforcement in the Texas wildflower Phlox drummondii. Nature 469, 411–414. ( 10.1038/nature09641) [DOI] [PubMed] [Google Scholar]
- 3.Rebeiz M, Pool JE, Kassner VA, Aquadro CF, Carroll SB. 2009. Stepwise modification of a modular enhancer underlies adaptation in a Drosophila population. Science 326, 1663–1667. ( 10.1126/science.1178357) [DOI] [PMC free article] [PubMed] [Google Scholar]
- 4.Stern DL, Orgogozo V. 2008. The loci of evolution: how predictable is genetic evolution? Evolution 62, 2155–2177. ( 10.1111/j.1558-5646.2008.00450.x) [DOI] [PMC free article] [PubMed] [Google Scholar]
- 5.Prasad KVSK, et al. 2012. A gain-of-function polymorphism controlling complex traits and fitness in nature. Science 337, 1081–1084. ( 10.1126/science.1221636) [DOI] [PMC free article] [PubMed] [Google Scholar]
- 6.Hermisson J, Pennings PS. 2005. Soft sweeps: molecular population genetics of adaptation from standing genetic variation. Genetics 169, 2335–2352. ( 10.1534/genetics.104.036947) [DOI] [PMC free article] [PubMed] [Google Scholar]
- 7.Hartl DL, Clark AG. 2007. Principles of population genetics, 4th edn Sunderland, MA: Sinauer. [Google Scholar]
- 8.Barrett RDH, Schluter D. 2008. Adaptation from standing genetic variation. Trends Ecol. Evol. 23, 38–44. ( 10.1016/j.tree.2007.09.008) [DOI] [PubMed] [Google Scholar]
- 9.Mayr E. 1963. Animal species and evolution. Cambridge, MA: Harvard University Press. [Google Scholar]
- 10.Wagner WH. 1969. The role and taxonomic treatment of hybrids. Bioscience 19, 785–795. ( 10.2307/1294787) [DOI] [Google Scholar]
- 11.Dowling TE, Secor CL. 1997. The role of hybridization and introgression in the diversification of animals. Annu. Rev. Ecol. Syst. 28, 593–619. ( 10.1146/annurev.ecolsys.28.1.593) [DOI] [Google Scholar]
- 12.Abbott R, et al. 2013. Hybridization and speciation. J. Evol. Biol. 26, 229–246. ( 10.1111/j.1420-9101.2012.02599.x) [DOI] [PubMed] [Google Scholar]
- 13.Rieseberg LH, Wendel J. 1993. Introgression and its consequences in plants. In Hybrid zones and the evolutionary process (ed. Harrison RG.), pp. 70–109. Oxford, UK: Oxford University Press. [Google Scholar]
- 14.Schemske DW. 2000. Understanding the origin of species. Evolution 54, 1069–1073. ( 10.1111/j.0014-3820.2000.tb00111.x) [DOI] [Google Scholar]
- 15.Anderson E. 1949. Introgressive hybridization. New York, NY: John Wiley and Sons. [Google Scholar]
- 16.Anderson E, Stebbins GL Jr. 1954. Hybridization as an evolutionary stimulus. Evolution 8, 378–388. ( 10.2307/2405784) [DOI] [Google Scholar]
- 17.Arnold ML. 2004. Transfer and origin of adaptations through natural hybridization: were Anderson and Stebbins right? Plant Cell 16, 562–570. ( 10.1105/tpc.160370) [DOI] [PMC free article] [PubMed] [Google Scholar]
- 18.Lewontin RC, Birch LC. 1966. Hybridization as a source of variation for adaptation to new environments. Evolution 20, 315–336. ( 10.2307/2406633) [DOI] [PubMed] [Google Scholar]
- 19.Heiser CB. 1973. Introgression reexamined. Bot. Rev. 39, 347–366. ( 10.1007/BF02859160) [DOI] [Google Scholar]
- 20.Pialek J, Barton NH. 1997. The spread of an advantageous allele across a barrier: the effects of random drift and selection against heterozygotes. Genetics 145, 493–504. [DOI] [PMC free article] [PubMed] [Google Scholar]
- 21.Hedrick PW. 2013. Adaptive introgression in animals: examples and comparison to new mutation and standing variation as sources of adaptive variation. Mol. Ecol. 22, 4606–4618. ( 10.1111/mec.12415) [DOI] [PubMed] [Google Scholar]
- 22.Whitney KD, Randell RA, Rieseberg LH. 2010. Adaptive introgression of abiotic tolerance traits in the sunflower Helianthus annuus. New Phytol. 187, 230–239. ( 10.1111/j.1469-8137.2010.03234.x) [DOI] [PubMed] [Google Scholar]
- 23.Kim M, Cui ML, Cubas P, Gillies A, Lee K, Chapman MA, Abbott RJ, Coen E. 2008. Regulatory genes control a key morphological and ecological trait transferred between species. Science 322, 1116–1119. ( 10.1126/science.1164371) [DOI] [PubMed] [Google Scholar]
- 24.Kim SC, Rieseberg LH. 1999. Genetic architecture of species differences in annual sunflowers: implications for adaptive trait introgression. Genetics 153, 965–977. [DOI] [PMC free article] [PubMed] [Google Scholar]
- 25.Heliconius Genome Consortium. 2012. Butterfly genome reveals promiscuous exchange of mimicry adaptations among species. Nature 487, 94–98. [DOI] [PMC free article] [PubMed] [Google Scholar]
- 26.Pardo-Diaz C, Salazar C, Baxter SW, Merot C, Figueiredo-Ready W, Joron M, McMillan WO, Jiggins CD. 2012. Adaptive introgression across species boundaries in Heliconius butterflies. PLoS Genet. 8, e1002752 ( 10.1371/journal.pgen.1002752) [DOI] [PMC free article] [PubMed] [Google Scholar]
- 27.Lamichhaney S, et al. 2015. Evolution of Darwin's finches and their beaks revealed by genome sequencing. Nature 518, 371–375. ( 10.1038/nature14181) [DOI] [PubMed] [Google Scholar]
- 28.Schluter D. 2001. Ecology and the origin of species. Trends Ecol. Evol. 16, 372–380. ( 10.1016/S0169-5347(01)02198-X) [DOI] [PubMed] [Google Scholar]
- 29.Nosil P, Harmon LJ, Seehausen O. 2009. Ecological explanations for (incomplete) speciation. Trends Ecol. Evol. 24, 145–156. ( 10.1016/j.tree.2008.10.011) [DOI] [PubMed] [Google Scholar]
- 30.Rundle HD, Nosil P. 2005. Ecological speciation. Ecol. Lett. 8, 336–352. ( 10.1111/j.1461-0248.2004.00715.x) [DOI] [Google Scholar]
- 31.Feder JL, Xie XF, Rull J, Velez S, Forbes A, Leung B, Dambroski H, Filchak KE, Aluja M. 2005. Mayr, Dobzhansky, and Bush and the complexities of sympatric speciation in Rhagoletis. Proc. Natl Acad. Sci. USA 102, 6573–6580. ( 10.1073/pnas.0502099102) [DOI] [PMC free article] [PubMed] [Google Scholar]
- 32.Coyne JA, Orr HA. 2004. Speciation. Sunderland, MA: Sinauer. [Google Scholar]
- 33.Nosil P. 2012. Ecological speciation. Oxford, UK: Oxford University Press. [Google Scholar]
- 34.Nosil P. 2008. Speciation with gene flow could be common. Mol. Ecol. 17, 2103–2106. ( 10.1111/j.1365-294X.2008.03715.x) [DOI] [PubMed] [Google Scholar]
- 35.Via S. 2009. Natural selection in action during speciation. Proc. Natl Acad. Sci. USA 106, 9939–9946. ( 10.1073/pnas.0901397106) [DOI] [PMC free article] [PubMed] [Google Scholar]
- 36.Beardsley PM, Schoenig SE, Whittall JB, Olmstead RG. 2004. Patterns of evolution in Western North American Mimulus (Phrymaceae). Am. J. Bot. 91, 474–489. ( 10.3732/ajb.91.3.474) [DOI] [PubMed] [Google Scholar]
- 37.Pritchard JK, Stephens M, Donnelly P. 2000. Inference of population structure using multilocus genotype data. Genetics 155, 945–959. [DOI] [PMC free article] [PubMed] [Google Scholar]
- 38.McMinn HE. 1951. Studies in the genus Diplacus, Scrophulariaceae. Madrono 11, 33–128. [Google Scholar]
- 39.Beeks RM. 1962. Variation and hybridization in southern California populations of Diplacus (Scrophulariaceae). El Aliso 5, 83–122. [Google Scholar]
- 40.Thompson DM. 1993. Mimulus. In The Jepson manual; higher plants of California (ed. Hickman JC.), pp. 1037–1047. Los Angeles, CA: University of California Press. [Google Scholar]
- 41.Tulig M. 2000. Morphological variation in Mimulus section Diplacus (Scrophulariaceae). MS thesis, California State Polytechnic University, Pomona.
- 42.Sobel JM, Streisfeld MA. 2015. Strong premating reproductive isolation drives incipient speciation in Mimulus aurantiacus. Evolution 69, 447–461. ( 10.1111/evo.12589) [DOI] [PubMed] [Google Scholar]
- 43.Grant V. 1981. Plant speciation, 2 edn New York, NY: Columbia University Press. [Google Scholar]
- 44.Grant V. 1993. Origin of floral isolation between ornithophilous and sphingophilous plant species. Proc. Natl Acad. Sci. USA 90, 7729–7733. ( 10.1073/pnas.90.16.7729) [DOI] [PMC free article] [PubMed] [Google Scholar]
- 45.Streisfeld MA, Kohn JR. 2007. Environment and pollinator-mediated selection on parapatric floral races of Mimulus aurantiacus. J. Evol. Biol. 20, 122–132. ( 10.1111/j.1420-9101.2006.01216.x) [DOI] [PubMed] [Google Scholar]
- 46.Streisfeld MA, Kohn JR. 2005. Contrasting patterns of floral and molecular variation across a cline in Mimulus aurantiacus. Evolution 59, 2548–2559. ( 10.1111/j.0014-3820.2005.tb00968.x) [DOI] [PubMed] [Google Scholar]
- 47.Streisfeld MA, Young WN, Sobel JM. 2013. Divergent selection drives genetic differentiation in an R2R3-MYB transcription factor that contributes to incipient speciation in Mimulus aurantiacus. PLoS Genet. 9, e1003385 ( 10.1371/journal.pgen.1003385) [DOI] [PMC free article] [PubMed] [Google Scholar]
- 48.Martin SH et al. 2013. Genome-wide evidence for speciation with gene flow in Heliconius butterflies. Genome Res. 23, 1817–1828. ( 10.1101/gr.159426.113) [DOI] [PMC free article] [PubMed] [Google Scholar]
- 49.Brawand D, et al. 2014. The genomic substrate for adaptive radiation in African cichlid fish. Nature 513, 375–381. ( 10.1038/nature13726) [DOI] [PMC free article] [PubMed] [Google Scholar]
- 50.Munz PA, Keck DD. 1973. A California flora and supplement. Berkeley, CA: University of California Press. [Google Scholar]
- 51.Wittkopp PJ, Haerum BK, Clark AG. 2004. Evolutionary changes in cis and trans gene regulation. Nature 430, 85–88. ( 10.1038/nature02698) [DOI] [PubMed] [Google Scholar]
- 52.Thompson DM. 2005. Systematics of Mimulus subegenus Schizoplacus (Scrophulariaceae). Syst. Bot. Monogr. 75, 1–213. [Google Scholar]
- 53.Mallet J. 2005. Hybridization as an invasion of the genome. Trends Ecol. Evol. 20, 229–237. ( 10.1016/j.tree.2005.02.010) [DOI] [PubMed] [Google Scholar]
- 54.Green RE, et al. 2010. A draft sequence of the Neandertal genome. Science 328, 710–722. ( 10.1126/science.1188021) [DOI] [PMC free article] [PubMed] [Google Scholar]
- 55.Huerta-Sanchez E, et al. 2014. Altitude adaptation in Tibetans caused by introgression of Denisovan-like DNA. Nature 512, 194–197. ( 10.1038/nature13408) [DOI] [PMC free article] [PubMed] [Google Scholar]
- 56.Schumer M, Rosenthal GG, Andolfatto P. 2014. How common is homoploid hybrid speciation? Evolution 68, 1553–1560. ( 10.1111/evo.12399) [DOI] [PubMed] [Google Scholar]
- 57.Etter PD, Bassham S, Hohenlohe PA, Johnson EA, Cresko WA. 2011. SNP discovery and genotyping for evolutionary genetics using RAD sequencing. Methods Mol. Biol. 772, 157–178. ( 10.1007/978-1-61779-228-1_9) [DOI] [PMC free article] [PubMed] [Google Scholar]
- 58.Streisfeld MA, Rausher MD. 2009. Altered trans-regulatory control of gene expression in multiple anthocyanin genes contributes to adaptive flower color evolution in Mimulus aurantiacus. Mol. Biol. Evol. 26, 433–444. ( 10.1093/molbev/msn268) [DOI] [PubMed] [Google Scholar]
- 59.Harborne JB. 1984. Phytochemical methods, 2nd edn New York, NY: Chapman and Hall. [Google Scholar]
- 60.Librado P, Rozas J. 2009. DnaSP v5: a software for comprehensive analysis of DNA polymorphism data. Bioinformatics 25, 1451–1452. ( 10.1093/bioinformatics/btp187) [DOI] [PubMed] [Google Scholar]
- 61.Paradis E. 2010. pegas: an R package for population genetics with an integrated-modular approach. Bioinformatics 26, 419–420. ( 10.1093/bioinformatics/btp696) [DOI] [PubMed] [Google Scholar]
Associated Data
This section collects any data citations, data availability statements, or supplementary materials included in this article.
Supplementary Materials
Data Availability Statement
All data from the article have been made publicly available on Dryad (http://dx.doi.org/10.5061/dryad.33mp5), GenBank (KT355497-KT355573) and on the Sequence Read Archive: (SRX1121822).