Abstract
Cellular signaling is key for organisms to survive immediate stresses from fluctuating environments as well as relaying important information about external stimuli. Effective mechanisms have evolved to ensure appropriate responses for an optimal adaptation process. For them to be functional despite the noise that occurs in biochemical transmission, the cell needs to be able to infer reliably what was sensed in the first place. For example Saccharomyces cerevisiae are able to adjust their response to osmotic shock depending on the severity of the shock and initiate responses that lead to near perfect adaptation of the cell. We investigate the Sln1–Ypd1–Ssk1-phosphorelay as a module in the high-osmolarity glycerol pathway by incorporating a stochastic model. Within this framework, we can imitate the noisy perception of the cell and interpret the phosphorelay as an information transmitting channel in the sense of C.E. Shannon’s “Information Theory”. We refer to the channel capacity as a measure to quantify and investigate the transmission properties of this system, enabling us to draw conclusions on viable parameter sets for modeling the system.
Keywords: S. cerevisiae, Osmoadaptation, Phosphorelay , HOG pathway, Information theory
Introduction
In their natural habitats, organisms are facing numerous and sometimes severe changes in environmental conditions. Additionally to this extrinsic stochasticity, cells themselves act and function in a stochastic manner (Shahrezaei and Swain 2008; Acar et al. 2008). Efficient strategies for sensing variations in the environment despite intrinsic fluctuations are crucial for the immediate survival as well as a beneficial long-term adaptation. For both stresses and stimuli, cells have developed a wide range of signal transduction pathways to fulfill this function. These pathways transmit the gathered outside information to the decision-making centers of the cell, where appropriate responses can be initiated. Taking the place as a model organism, Saccharomyces cerevisiae serves to investigate and better understand these highly evolved mechanisms. One can observe a plethora of signaling motifs in yeast that are common in nature and need to be understood comprehensively in structure, function and interactions.
One of the most intensively studied signal transduction pathways is the high-osmolarity glycerol (HOG) pathway, both from an experimental (e.g. Posas et al. 1996; Hohmann 2002; Macia et al. 2009; Patterson et al. 2010) as well as a computational side (e.g. Klipp et al. 2005; Muzzey and Ca 2009; Petelenz-Kurdziel et al. 2013; Patel et al. 2013). The pathway provides the cell with answers to an increased concentration of osmolytes in the environment. This concentration can be lethal for the cell as it changes pressure on the cell wall, water exchange and thus the cell volume as well as chemical reactions within the cell. For the cell to survive, a complex system of adaptation processes is initiated. An immediate answer is the closure of Fps1 channels, preventing the further outflow of glycerol, the osmolyte being accumulated within the cell. The further adaptation is regulated over the HOG pathway facilitating a transcriptional answer, ultimately leading to glycerol production and near perfect long-term adaptation (Muzzey and Ca 2009). For a review of the pathway we refer to Hohmann (2009).
When facing different stress levels, the cell exhibits very distinct profiles in Hog1 activation and cellular response. This can in part be attributed to feedbacks in the system and the complexity of interacting mechanisms. Several signal processing techniques have been applied to characterize the response of the HOG pathway (e.g. Mettetal et al. 2008; Hersen et al. 2008). But even though those studies have common aims towards a better understanding of how signaling in complex systems works and enables adaptation, the stochastic nature within the signaling itself has not been focused on. We explored the idea of this stress answer being part of a fidelity problem to the cell. Ultimately this would mean that by encoding and transmitting the extracellular signal appropriately, the cell can already distinguish a number of input levels for further processing. For this we focused on the Sln1–Ypd1–Ssk1-phosphorelay, an extended two-component signaling system that forms the first module of the HOG pathway (Maeda et al. 1994; Stock et al. 2000). Observing the cell’s ability to discriminate profiles already in this first signaling instance will add a further “stochastical layer” to the study on input-output relations (Shinar et al. 2007) of these systems.
Analyzing properties of signal transduction in noisy systems suggests the application of a mathematical framework in the sense of Shannon’s Information Theory (Shannon 1948). This famous theory (with its long history in engineering) was successfully integrated in neuro-biology already several years ago, where it has since become a standard tool to study neuronal information processing (Borst and Theunissen 1999). Due to the stochastic nature of transcriptional processes, information theoretical concepts have also been extensively used to study information flow in gene expression (Tkačik et al. 2009; Walczak et al. 2010; Tkačik et al. 2012), drawing in addition the parallel to positional information (Tkacik et al. 2008; Dubuis et al. 2013). With all that recent research in mind, it seems immediately appealing to also study biochemical signaling processes within the same framework. Examples have been reviewed in Waltermann and Klipp (2011) and Rhee et al. (2012). Information theory provides fundamental boundaries and restrictions that are put on the reliable transmission of messages due to noise, namely the “capacity” of channels. In this study we applied this measure to the analysis of the phosphorelay and used it to gain deeper insight into the system.
Using Gillespie’s well-known “Stochastic Simulation Algorithm” (SSA) (Gillespie 1977) we built a stochastic model of the phosphorelay to sample a solution of the chemical master equation for this system. We investigated the influence of the model parameters to inherent noise and thus ultimately the limit to which transmission of reliable messages over the phosphorelay could be possible.
Materials and methods
Model of the Sln1 branch of the HOG-pathway
The cellular response of S. cerevisiae to osmotic stress from the environment has been and is still widely studied in Systems Biology (Posas et al. 1996; Hohmann 2002; Schaber et al. 2012; Baltanás et al. 2013). This is partly due to the interesting motifs involved (MAPK cascade, crosstalk to other pathways, feedback mechanisms, etc.), but also in order to answer more general questions about how cells perceive their environments. The involved signal transduction pathway acting on osmolyte concentrations is the HOG pathway. It senses external osmolytes via two different mechanisms: the Sho1-branch and the Sln1-branch. For applying our framework we focused on the regulating two-component phosphorelay of the Sln1-branch that controls an integral part of the Hog1 activation. In the following, we introduce the molecular structure and function that is used to build a stochastic model of this regulatory system.
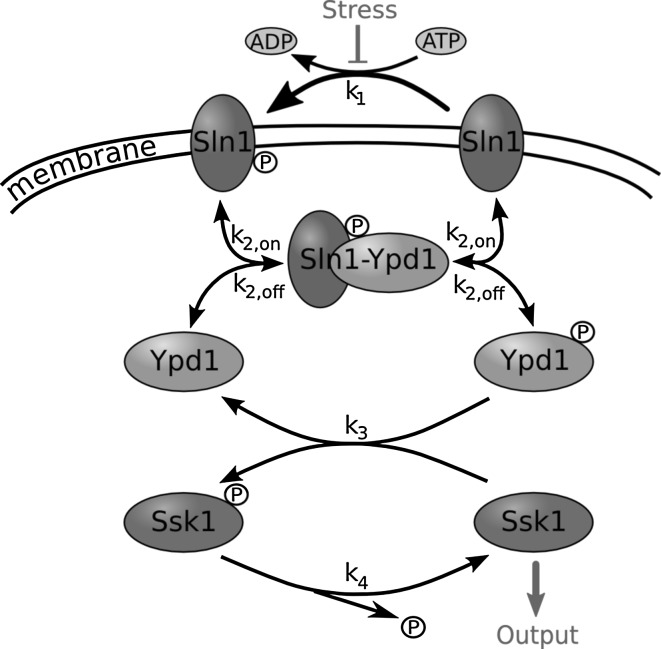
As visualized in Fig. 1, the phosphorelay consists of three proteins of interest: Sln1, Ypd1 and Ssk1. They form a biochemical signal transduction chain that belongs to the family of “two-component regulators” that are a common feature in prokaryotic signaling, but also found in eukaryotes.
Fig. 1.
Schematic of the phosphorelay in the Sln1-branch of the HOG pathway
Sln1 is a trans-membrane protein that reacts on the turgor pressure put on the cell wall. In the non-stressed situation it constantly auto-phosphorylates His-576 under the consumption of ATP. In our model this rate () plays a fundamental role as it is considered the encoder of the (osmotic) input. The phosphate group is transferred to the response regulator domain Asp-1144 of the protein,1 from where it can be further relayed to His-64 of the intermediate signaling protein Ypd1. This is mediated by the (reversible) formation of a complex Sln1-P-Ypd1. Because the phosphate transfer within the complex happens at a fast rate (Janiak-Spens et al. 2005), this step will not be modeled explicitly.
The intermediate protein Ypd1 is a more abundant although smaller molecule. It comes in a copy number of roughly 6,300/cell2 that can enter the nucleus freely. Compared to the other species of our model (Sln1: ~650, Ssk1: ~1,200 molecules) this is a relatively high copy number.3 This might be due to the fact that the cell needs to circumvent a bottleneck in information shuttling. Ypd1 is able to interact with both Ssk1 in the cytosol as well as nuclear Skn7 (Li et al. 1998; Lu et al. 2003) to transfer the phosphate to the respective response regulator domain, but a transfer to Ssk1 is strongly favored as demonstrated in Janiak-Spens et al. (2005). The phosphoryl group was not observed to be transported back to Ypd1.
Ssk1 is the protein that is used in our model as an output in its un-phosphorylated form by catalyzing the phosphorylation reactions of the downstream MAPK cascade leading towards the double phosphorylation and thus activation of Hog1.
In an unstressed environment, Ssk1 will constantly be phosphorylated and its activating function thereby inhibited. Upon osmotic shock, Sln1 acts on the variation of turgor pressure by a change in its conformation (Tao et al. 2002). Its auto-phosphorylation rate will be decreased and thus successively also the inhibition of Ssk1. Ssk1 becomes free to catalyze the downstream reactions and activates a chain of amplification, signaling the presence of stress. The model uses the probability distribution of this species as the relevant observable for the system. Its fidelity defines how detailed the response of the cell will be.
A stochastic model of the phosphorelay system has been implemented with a version of the Gillespie algorithm (Gillespie 1977) that allows for a dynamic Monte Carlo sampling of the probability distributions for the considered species. For the implementation, we used the system of reactions that was outlined in Fig. 1:
| 1 |
| 2 |
| 3 |
| 4 |
| 5 |
The value for the association rate of the complex Sln1-P-Ypd1 was chosen to be and the dissociation constant is kept at thus defining Preliminary results showed that the intermediate rate exhibits a minor impact on our analysis and can (for simplicity) be set to an appropriate value that ensures signal transmission.
Information theory
To quantify the information transmission within the phosphorelay branch of the signaling cascade, we considered the biochemical relay as a noisy channel in the sense of Information Theory as developed by Shannon (1948). This probabilistic mathematical framework provides “channel capacity” as a measure that can be used to evaluate how well different input signals are still distinguishable after the signal has been transduced. We aim to quantify and evaluate the system’s capabilities of transmitting information by observing its ability to respond to certain inputs in the presence of noise. In a technical setting, this is the limit to which messages can be transmitted reliably. It is important to keep in mind that with capacity we can set an upper bound on information transmission. The biological implications however can be very complex and possibly even include the neglect of information. Nevertheless it has been shown that biological systems typically evolved by optimizing efficiencies and often work in near-optimal regimes.
Here we give a brief introduction to the main concepts of the framework, embedding them into our biological setting. For more detailed information we refer to Cover and Thomas (2012).
As a suitable representation for measuring “information, choice and uncertainty” of a random variable X, Shannon deduced the so called (Shannon) entropyH. For this he defined important properties of our (intuitive) understanding of information and identified H as the only function satisfying these:
| 6 |
where is the associated probability distribution of the random variable X (see Shannon 1948, Appendix II). The base b of the logarithm is arbitrary and can be modified by K for convenience and interpretation. This constant K represents a choice of unit to the entropy.4 Following the general convention, we measure entropies in bits, referring to a base of 2 for the logarithm []. Intuitively 1 bit could be visualized by the toss of a fair coin: the equal probability of “heads” and “tails” as the outcome of the toss gives us two equally good choices for predicting the toss, reflecting the uncertainty about the random variable measured by the entropy. Manipulating the coin to favor one outcome will lower our uncertainty for the prediction (and thus the choice we are likely to make), but also the information that could be gathered by tossing the coin provided we know the probability distribution. Applying this to a set of possible external state variables for a cell (such as nutrients, temperature or in our case osmotic conditions), we get a measure of how uncertain our environment is and how informative measuring it will be.
This notion of information can be extended to conditional entropy as follows. Consider two (not necessarily independent) random variables X and Y. We can measure our average uncertainty about Y when knowing X by writing:
| 7 |
where denotes the joint distribution and the conditional distribution of Y given X. This measures the entropy of the output, when the input is known. This can be used to define mutual information, a measure commonly used to quantify how much information one random variable carries about the other.5
| 8 |
| 9 |
For our purposes, another (although equivalent) interpretation of mutual information is more convenient. Using Eq. (9), we can describe it as “the amount of information received minus the uncertainty that still remains due to the noise in the system”. This scenario can be directly applied to the situation that we have in an experimental setup. One would evaluate a noisy output (e.g. the fluorescence of a tagged protein) to a certain stimulus (e.g. stress level, input dose). Once the probability distribution for the (natural) input has been defined or inferred (experimentally a nearly impossible task), we can evaluate how much information our output still contains about the input, despite the inherent noise. The conditional distribution for such a scenario defines rules for the transmission through this biochemical channel.
The next natural step is to maximize this mutual information. If our (biological) system is given, its fixed transmitting properties [conveyed by ] might have evolved to be optimally adapted to a certain input distribution and perhaps a weighting on how important the reaction to a certain level is. This amounts to the formal definition “channel capacity”, namely
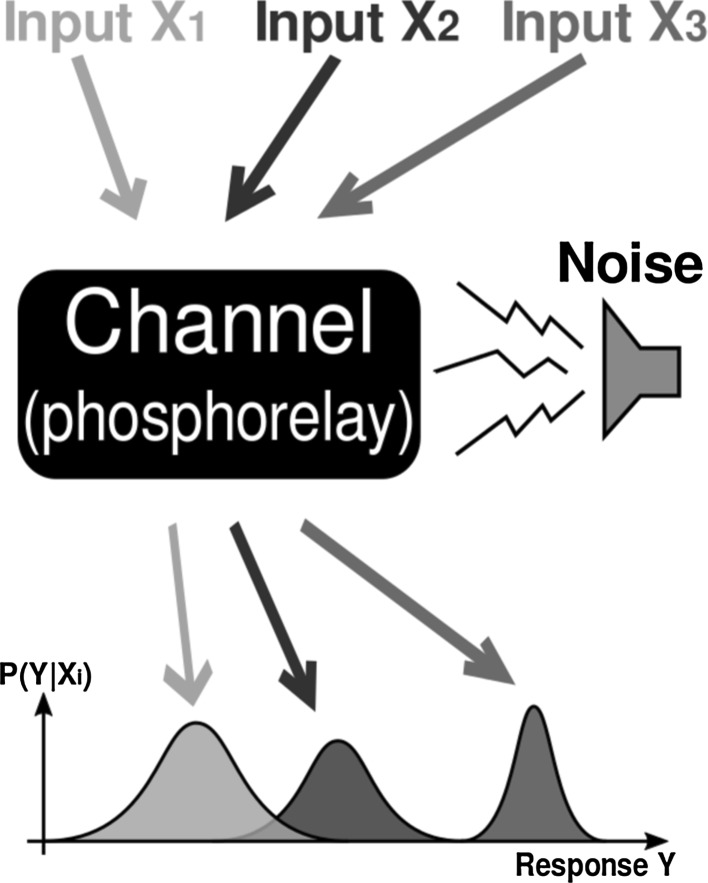
It is important to note that this could also be done by optimizing the transmission probabilities themselves, but in our case this will be a fixed quantity for the “channel” as visualized in Fig. 2.
Fig. 2.
Schematic diagram of the biochemical channel. Different inputs (e.g. environmental cues) are encoded and transmitted through the channel. Due to noise added during the process of transmission, we can only observe probability distributions as the received signal
In a biological setting this can be interpreted as the pathway repeatedly sensing environmental conditions and stresses that could for example be provided in experimental setups. Measuring this channel capacity then means answering the question “How much can the receiver of a noise-distorted message tell about what was originally sent by the encoder, given this transmitting channel”. Encoder for us is the set of Sln1 proteins located in the cell membrane. The signal of extracellular salt concentration is encoded to a level of phosphorylation via modulation of their kinase activity. The subsequent dephosphorylated Ssk1 acts as the decoder receiving the transmitted signal. In its dephosphorylated form it can catalyze the phosphorylation of the downstream MAPkinase pathway leading to the double phosphorylation (and thus activation) of Hog1.
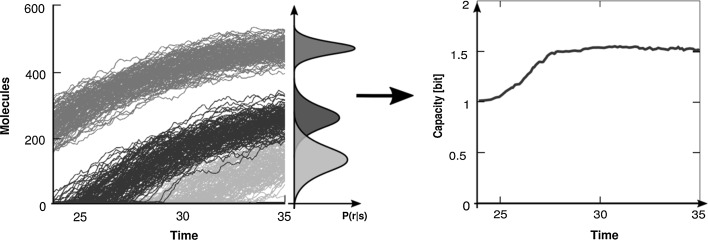
For finite inputs and the given transmission probabilities, we can use a numeric optimization algorithm developed concurrently by Arimoto (1972) and Blahut (1972) to calculate the channel capacity (also see Cover and Thomas 2012). Again this quantity is given in bits, as in this way transmitting 1 bit corresponds to measuring an on/off response representing two states of the environment (switch-like behavior). Capacities above 1 bit enable a channel to actually distinguish more than just “on” and “off” and react accordingly (Fig. 3).
Fig. 3.
Schematic of how channel capacity is measured over time. Various stimuli s (colors) are simulated and the conditional response r is measured over time. Observing the dynamical behavior of the output-distribution, we can calculate the respective channel capacity numerically with the Arimoto–Blahut algorithm. (Color figure online)
Remark
Although our usage of the framework focused on other features, it is interesting to note that a major advantage of Information Theory is that in order to characterize and evaluate a (biological) system, one doesn’t need to consider all the details within the transmitting channel. In experiments where the input can be well-defined in addition to a proper output-statistic of the “channel”, one can draw conclusions on function, structure and boundaries by using this theory (see e.g. Cheong et al. 2011; Rhee et al. 2012).
Results
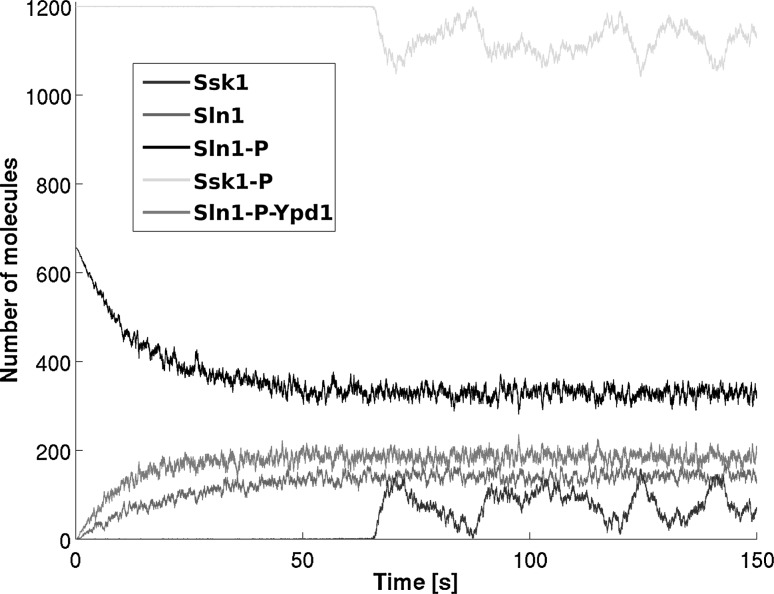
We implemented the proposed phosphorelay model with the Gillespie “SSA” (Gillespie 1977) in order to simulate a sufficient number of trajectories. Figure 4 illustrates one typical simulation run. As expected, we observed characteristic dynamics for each species depending on the chosen parameter set. By using the stochastic framework, we introduced noise into the system as well, enabling us to examine its properties of signal fidelity.6 To observe the output we sampled its probability distributions as a function of time depending on a defined input,7 simulated with an adequate number of runs. We varied the two crucial parameters for input () and output () within the system to observe the dependence of information transmission on them.
Fig. 4.
Stochastic simulation run of the model (the higher abundant protein Ypd1 is omitted). Here we observe an unstressed steady state after about 70 s. Starting from this state the systems’ signal propagation properties can be examined by applying stress. Here we focus on the analysis of the noise emerging in the system. Matching the timing in transduction to biological behavior could provide further insight
For analyzing the phosphorelay, first a functional system needs to be ensured by simulating its behavior in the non-stressed environment and thus its steady state. Subsequently the system’s capacities can be evaluated by our chosen framework. The results of these two steps are then combined.
Phosphorylation of Ssk1 in unstressed steady state
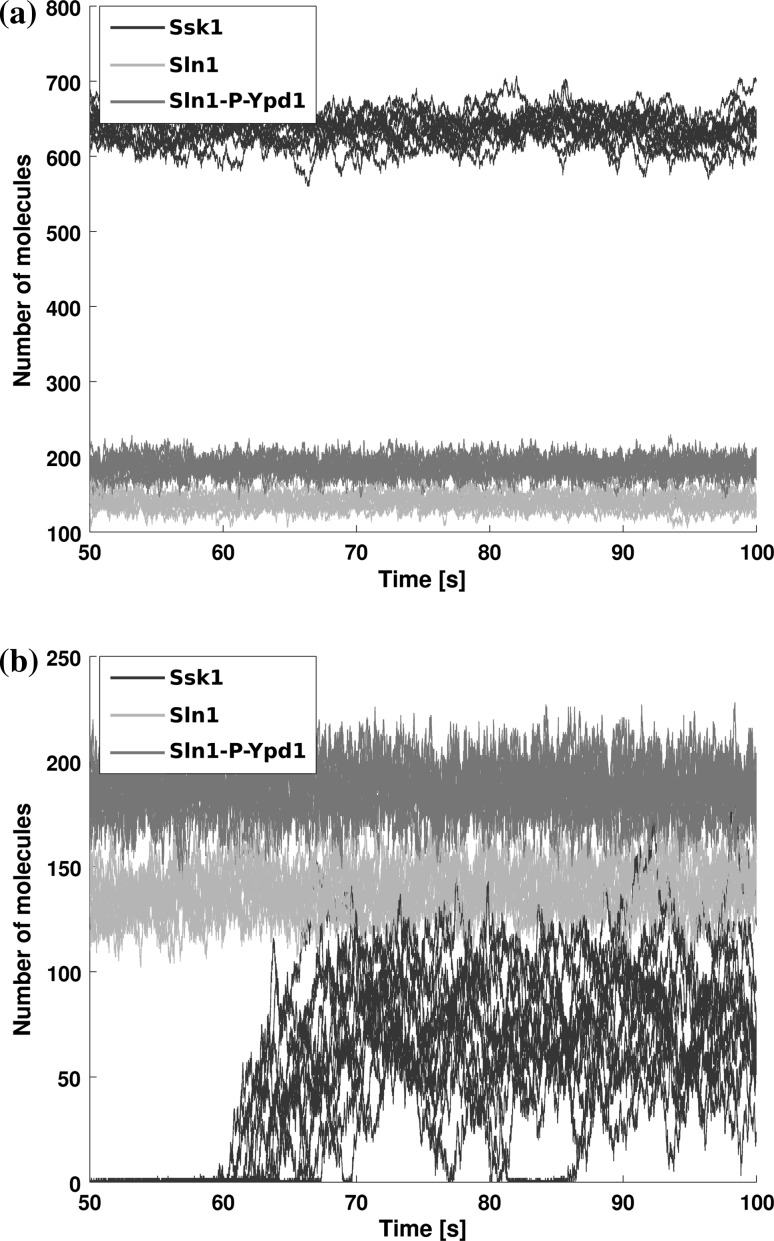
Aiming at an operational signal transduction in the cell we first require that if our environment exhibits no stress, also no signal (or only a basal level) is transmitted. Thus we demand that a high percentage (>80 %, or arguably even a higher threshold) of our signaling output Ssk1 remains phosphorylated in unstressed environmental conditions. This ensures that the relay is not constantly activating the downstream signaling MAP kinase and thus doesn’t keep the cell stressed without an immediate need for it. This is crucial to be taken into account since a permanent activation of the pathway can be lethal to the cell (Maeda et al. 1994). The threshold we are setting selects for feasible rate-combinations between phosphorylating Sln1 () and dephosphorylating Ssk1 (). Figure 5 illustrates two possible scenarios for the simulations, one activating the downstream signal constitutively and the other exhibiting a functional non-stressed behavior.
Fig. 5.
Trajectories of steady state simulations for the output (Ssk1, dark blue) with and two different values of . a A combination that activates the downstream pathway constitutively due to a high level of dephosphorylated Ssk1 and is hence not fit for transmitting the signal. b A “feasible parameter combination”, exhibiting only a basal level of dephosphorylated Ssk1 in steady state. This allows for a functional pathway and can be further investigated. a . b . (Color figure online)
It is imperative that if is set to a low enough value, phosphorylation will always exceed the dephosphorylation and provide the inhibited signaling in steady state as expected. So there is no lower boundary on that violates the functionality, only one on information transmission as explained in “Computation of channel capacities” section. For the moment it will be the upper limit on the dephosphorylation rate that is of interest to us. After simulating the model for a sufficiently long time to reach the steady state, the feasibility of the parameters can be evaluated using the said threshold.
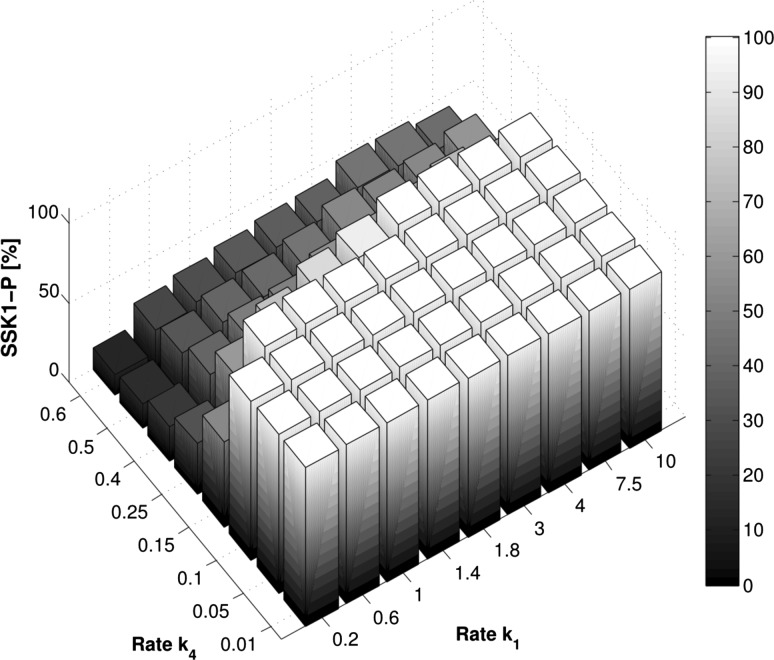
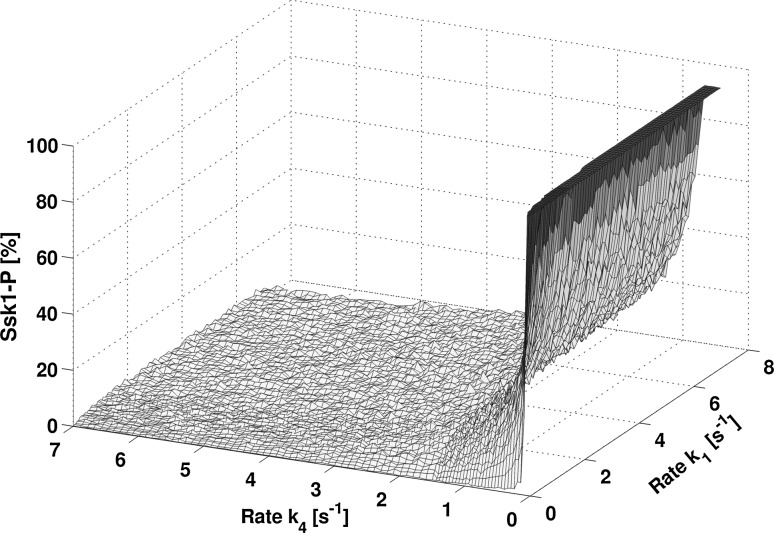
As can be seen in Fig. 6, we observed that the steady state behavior already sets a very strict upper boundary on the rate combinations of and . Within the simulated range, could only be chosen at a magnitude lower than the input rate. In addition to that it only took a marginal difference in to shift the equilibrium towards a non-functional system. The finding of this severe restriction becomes clearer if we expand the range of the parameter. Figure 7 illustrates this view in this broader perspective.
Fig. 6.
Detailed view of the percentage of phosphorylated Ssk1 in steady state simulations depending on input and output rates ( and ). We can restrict the feasible parameter sets to the ones exhibiting only a basal level of signaling, corresponding to a basal level of phosphorylated Ssk1 in steady state
Fig. 7.
Mapping illustrating restrictions on the output rate . In non-stressed steady state, only the values exhibiting more than 80 % of phosphorylated Ssk1 produce a feasible behavior of the system. This provides only a narrow range for choosing as can be seen from the figure
Analyzing the parameter space with regard to the steady state behavior in non-stressed environments forms the first part of restricting the possible parameterization aiming towards a functional model. Alternatively, this analysis could be done by observing the mean value of the output, corresponding to simulations of differential equations for this system. This would enable an analytical view on the problem, but it also would deny the possibility to exploit the noise that we observe. We used these steady state simulations as part of the subsequent analysis of channel capacity.
Computation of channel capacities
As described in “Information theory” section, we can measure the channel capacity of the phosphorelay using the proposed setup (see Fig. 2). For this, we simulated the system with increasing stress levels. In the model, this means that depending on the level of stress, the initial phosphorylation rate is linearly downscaled until a basal level of activation is reached. This influence of the turgor pressure on the ensemble of Sln1 molecules is an important assumption that will be discussed later. We sampled the probability distribution of the output species Ssk1 over time depending on the parameter sets used for simulation. By doing this, we simulated the transmission probabilities that define the channel. We then could have computed the conditional entropies as in Eq. 7 if we considered a certain distribution for the input.
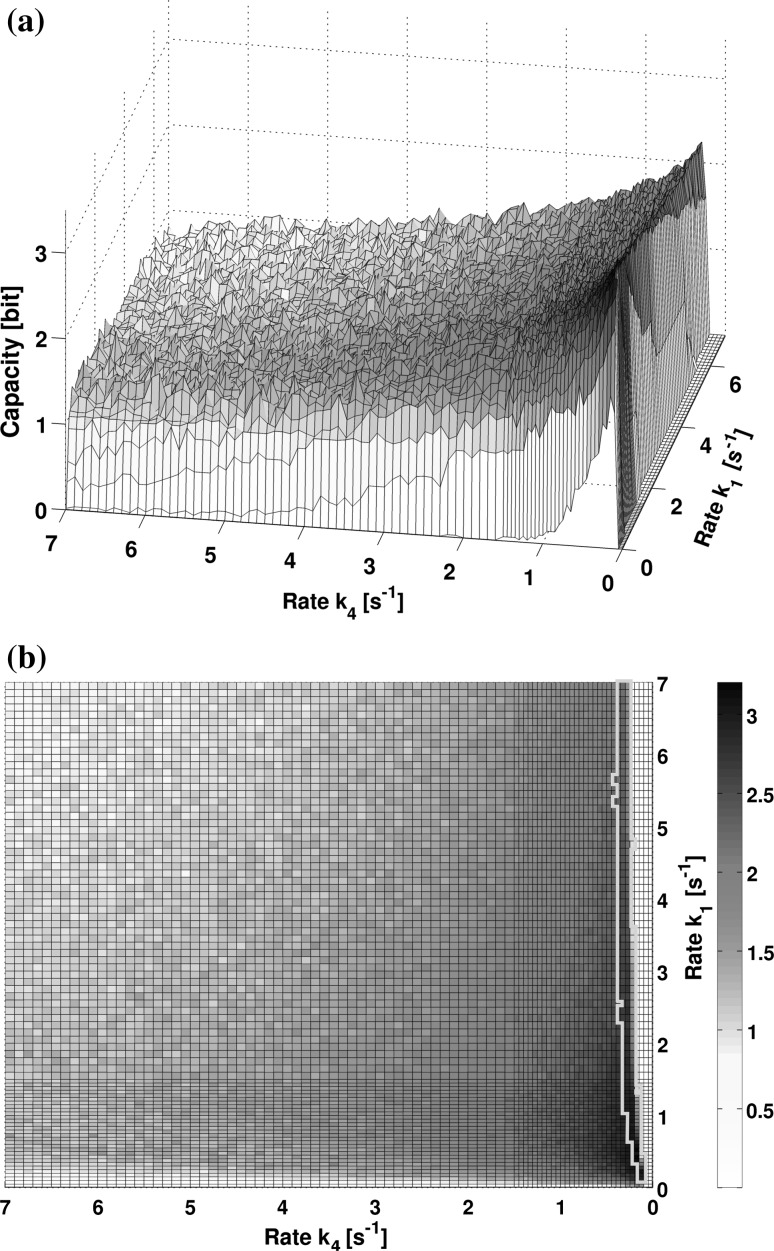
This leaves us with the optimization problem of finding the input distribution that achieves the capacity, i.e. that fits the channel. We do this by employing the Arimoto–Blahut algorithm that finds the maximum capacity as well as the achieving input distribution numerically. Interpreting these optimal input distributions is interesting although not part of the analysis here. Generally it will look sharper than it could be the case in a natural setting, which is also due to the binning process that we get by choosing a number of inputs (for numerical reasons) instead of a continuous range of concentrations. The number of inputs that we subjected the system to is determining an upper boundary to the capacity as can be seen by Eq. 8. Although this is the case, capacity will usually saturate at a much lower level because of the noise that the system exhibits. This has been visualized in Fig. 8.
Fig. 8.
Capacity as a function of the input rate and the output rate . a We observe a steep gradient for the capacity in the regime of a low dephosphorylation rate , implying a strong sensitivity in this parameter. b The combination with the results of “Phosphorylation of Ssk1 in unstressed steady state” section (see contoured area), the analysis restricts our parameter space strongly
The maximum value for information transmission were found at a low activating rate Increasing this parameter introduces a higher variability and thus more noise in the system as can be seen in Fig. 8. Although the absolute amount of capacity has to be debated (see “Discussion” section), a capacity of 3 bit means that the cell could potentially identify a number of 8 distinct signals. Looking at the landscape of capacities, we observe in the system exhibit a sharp transition in lower regimes of This suggests a sensitivity of the system that the cell will have to either overcome or use to its advantage.
By connecting the analyses for steady state phosphorylation and the channel capacity, we observe a narrow margin (Fig. 8) that is viable for simulating the phosphorelay model. This will be discussed in the following.
Discussion
We performed an analysis of the phosphorelay module within the HOG pathway by interpreting the system in an information theoretical way as a channel that transduces environmental cues to inner-cellular decision centers. Our aim was to identify how, given a stochastic biochemical nature, the phosphorelay system translates an input (decreasing phosphorylation of Sln1) into its output (dephosphorylated Ssk1). We focused on the question of fidelity that this system can achieve despite inherent noise.
Enabling fidelity
We observe that the fidelity and thus diverse response patterns of the HOG pathway could potentially already have its origin in the first step of osmo-sensing studied by us. The capacities that could be achieved with the phosphorelay, provided a suitable input function, exceed an on/off response that would correspond to a capacity of 1 bit. We consider this with several implications.
With our analysis we gain a method of estimation on how to restrict the parameter space of the model. Here we regard 1 bit as a lower bound on information capacity. If this would not be achievable by the system under the configuration in question, a functional adaptation of the cell to the osmo-stress would not be possible. Thus, we can draw the conclusion of disregarding parameter sets with capacity below 1. The capacity that exceeds this boundary nevertheless is not necessarily used by the cell. As discussed below, the mechanism of the input plays an important role in this regard. But we also need to consider the distribution of the external variables as well. Bowsher and Swain (2012) used a concept related to that of mutual information, called “informational fraction”. Similar to our output of the Arimoto–Blahut algorithm, they draw conclusions on how the pathway could potentially have evolved to adapt the cell to a certain scenario of environmental state distributions.
Capturing efficiency
Furthermore, we observed a pattern of information capacity that prefers low reaction rates over faster ones. Although slowly, capacity decreases towards a higher auto-phosphorylation rate This can be explained by the increase of variability (and thus a lower signal to noise ratio) at higher rates. This observation underlines the intuitive notion that cells also try to optimize their energy consumption. Since the first reaction of Sln1 auto-phosphorylation is constantly consuming ATP in order to keep Ssk1 phosphorylated downstream, lower rates could be preferred for efficiency. As the results of our study have shown, a distinct signal transduction in a reasonable time window is still manageable by the cell. Further study of the rates could validate this finding, as it would also be very interesting to observe such an optimization in an experimental setup. In our study, we observed a steep behavior in the slope of Capacity of the channel (see Fig. 8). This means that within that small region, we change very quickly from no information transmission to a good signal transduction for the system. This sensitivity allowed us to put very sharp boundaries on the parameter space, thereby explaining the regimes of functionality in our model without the need of fitting it to data.
Choosing the input
When we performed our simulations, we assumed a linear input that turgor pressure has on the phosphorylation of Sln1, namely the linear decrease in Although there is still ongoing research on the topic (Tanigawa et al. 2012), the mechanism itself has not been characterized comprehensively. Neither has the stochastic influence of the whole ensemble of Sln1 sensing the external signal been studied. So the question remains: is the linearization of the input function a valid assumption? This question will have to be answered experimentally. Our analysis can show that many different choices for this input can result in a similar behavior. In the extreme case, the input to Sln1 would be an “on/off” for the phosphorylation rate. As can be seen from Eq. 8, this would limit the absolute value of capacities with an upper bound,8 but neither the observations on functionality nor a (even if minimal) information transmission will be impaired.
Whether these findings will hold in a living cell remains to be seen in an experimental setup. But the beauty of the applied methods is that they are not restricted to analyzing a mathematically modeled system, but can instead also be used to evaluate mechanisms and motifs solely based on observing the noisy input–output-relation as an information transmission problem. Provided it is possible to sufficiently capture the stochastical nature experimentally, we believe that this is a powerful tool to find functions and characterize biological systems and ultimately connect theoretical and experimental work.
Acknowledgments
This work has been funded by the DFG (Deutsche Forschungsgemeinschaft, GRK 1772 “Computational Systems Biology”).
Conflict of interest
The authors declare that they have no conflict of interest.
Footnotes
This is believed to happen between dimerized Sln1 molecules as kind of an exchange instead of intra-molecular (Qin et al. 2000).
Numbers taken from “http://www.yeastgenome.org/”.
In our model, this enabled us to choose the shuttling rate in a non restrictive but computationally more efficient manner.
The related Boltzmann entropy as used in statistical physics for example sets (the Boltzmann constant) and employs the natural logarithm
Note that this is symmetric by definition.
“Fidelity” in this sense refers to a measure on how accurate the signaling can reproduce the input signal.
This input being a percentage of the auto-phosphorylation rate of Sln1, depending on the stress level.
In the extreme case with 1 bit.
Contributor Information
Friedemann Uschner, Email: f.uschner@biologie.hu-berlin.de.
Edda Klipp, Email: edda.klipp@rz.hu-berlin.de.
References
- Acar M, Mettetal JT, van Oudenaarden A. Stochastic switching as a survival strategy in fluctuating environments. Nat Genet. 2008;40(4):471–475. doi: 10.1038/ng.110. [DOI] [PubMed] [Google Scholar]
- Arimoto S. An algorithm for computing the capacity of arbitrary discrete memoryless channels. IEEE Trans Inf Theory. 1972;18(1):14–20. doi: 10.1109/TIT.1972.1054753. [DOI] [Google Scholar]
- Baltanás R, Bush A, Couto A, Durrieu L, Hohmann S, Colman-Lerner A. Pheromone-induced morphogenesis improves osmoadaptation capacity by activating the HOG MAPK pathway. Sci Signal. 2013;6(272):ra26. doi: 10.1126/scisignal.2003312. [DOI] [PMC free article] [PubMed] [Google Scholar]
- Blahut R. Computation of channel capacity and rate-distortion functions. IEEE Trans Inf Theory. 1972;18(4):460–473. doi: 10.1109/TIT.1972.1054855. [DOI] [Google Scholar]
- Borst A, Theunissen FE. Information theory and neural coding. Nat Neurosci. 1999;2(11):947–957. doi: 10.1038/14731. [DOI] [PubMed] [Google Scholar]
- Bowsher CG, Swain PS. Identifying sources of variation and the flow of information in biochemical networks. Proc Natl Acad Sci USA. 2012;109(20):E1320–E1328. doi: 10.1073/pnas.1119407109. [DOI] [PMC free article] [PubMed] [Google Scholar]
- Cheong R, Rhee A, Wang CJ, Nemenman I, Levchenko A. Information transduction capacity of noisy biochemical signaling networks. Science (New York, NY) 2011;334(6054):354–358. doi: 10.1126/science.1204553. [DOI] [PMC free article] [PubMed] [Google Scholar]
- Cover TM, Thomas JA. Elements of information theory. New York: Wiley-Interscience; 2012. [Google Scholar]
- Dubuis JO, Tkacik G, Wieschaus EF, Gregor T, Bialek W (2013) Positional information, in bits. Proc Natl Acad Sci USA 110(41):16301–168. doi:10.1073/pnas.1315642110 [DOI] [PMC free article] [PubMed]
- Gillespie DT. Exact stochastic simulation of coupled chemical reactions. J Phys Chem. 1977;81(25):2340–2361. doi: 10.1021/j100540a008. [DOI] [Google Scholar]
- Hersen P, McClean MN, Mahadevan L, Ramanathan S. Signal processing by the HOG MAP kinase pathway. Proc Natl Acad Sci USA. 2008;105(20):7165–7170. doi: 10.1073/pnas.0710770105. [DOI] [PMC free article] [PubMed] [Google Scholar]
- Hohmann S. Osmotic stress signaling and osmoadaptation in yeasts. Microbiol Mol Biol Rev. 2002;66(2):300–372. doi: 10.1128/MMBR.66.2.300-372.2002. [DOI] [PMC free article] [PubMed] [Google Scholar]
- Hohmann S. Control of high osmolarity signalling in the yeast Saccharomyces cerevisiae. FEBS Lett. 2009;583(24):4025–4029. doi: 10.1016/j.febslet.2009.10.069. [DOI] [PubMed] [Google Scholar]
- Janiak-Spens F, Cook PF, West AH. Kinetic analysis of YPD1-dependent phosphotransfer reactions in the yeast osmoregulatory phosphorelay system. Biochemistry. 2005;44(1):377–86. doi: 10.1021/bi048433s. [DOI] [PubMed] [Google Scholar]
- Klipp E, Nordlander B, Krüger R, Gennemark P, Hohmann S. Integrative model of the response of yeast to osmotic shock. Nat Biotechnol. 2005;23(8):975–982. doi: 10.1038/nbt1114. [DOI] [PubMed] [Google Scholar]
- Li S, Ault A, Malone CL, Raitt D, Dean S, Johnston LH, Deschenes RJ, Fassler JS. The yeast histidine protein kinase, Sln1p, mediates phosphotransfer to two response regulators, Ssk1p and Skn7p. EMBO J. 1998;17(23):6952–6962. doi: 10.1093/emboj/17.23.6952. [DOI] [PMC free article] [PubMed] [Google Scholar]
- Lu JMY, Deschenes RJ, Fassler JS. Saccharomyces cerevisiae histidine phosphotransferase Ypd1p shuttles between the nucleus and cytoplasm for SLN1-dependent phosphorylation of Ssk1p and Skn7p. Eukaryotic Cell. 2003;2(6):1304–1314. doi: 10.1128/EC.2.6.1304-1314.2003. [DOI] [PMC free article] [PubMed] [Google Scholar]
- Macia J, Regot S, Peeters T, Conde N, Solé R, Posas F. Dynamic signaling in the Hog1 MAPK pathway relies on high basal signal transduction. Sci Signal. 2009;2(63):ra13. doi: 10.1126/scisignal.2000056. [DOI] [PubMed] [Google Scholar]
- Maeda T, Wurgler-Murphy SM, Saito H. A two-component system that regulates an osmosensing MAP kinase cascade in yeast. Nature. 1994;369(6477):242–5. doi: 10.1038/369242a0. [DOI] [PubMed] [Google Scholar]
- Mettetal JT, Muzzey D, Gómez-Uribe C, van Oudenaarden A. The frequency dependence of osmo-adaptation in Saccharomyces cerevisiae. Science (New York, NY) 2008;319(5862):482–484. doi: 10.1126/science.1151582. [DOI] [PMC free article] [PubMed] [Google Scholar]
- Muzzey D, Ca Gómez-Uribe, Mettetal JT, van Oudenaarden A. A systems-level analysis of perfect adaptation in yeast osmoregulation. Cell. 2009;138(1):160–71. doi: 10.1016/j.cell.2009.04.047. [DOI] [PMC free article] [PubMed] [Google Scholar]
- Patel AK, Bhartiya S, Venkatesh KV (2013) Analysis of osmoadaptation system in budding yeast suggests that regulated degradation of glycerol synthesis enzyme is key to near-perfect adaptation. Syst Synth Biol. doi:10.1007/s11693-013-9126-2 [DOI] [PMC free article] [PubMed]
- Patterson JC, Klimenko ES, Thorner J. Single-cell analysis reveals that insulation maintains signaling specificity between two yeast MAPK pathways with common components. Sci Signal. 2010;3(144):ra75. doi: 10.1126/scisignal.2001275. [DOI] [PMC free article] [PubMed] [Google Scholar]
- Petelenz-Kurdziel E, Kuehn C, Nordlander B, Klein D, Hong KK, Jacobson T, Dahl P, Schaber J, Nielsen J, Hohmann S, Klipp E. Quantitative analysis of glycerol accumulation, glycolysis and growth under hyper osmotic stress. PLoS Comput Biol. 2013;9(6):e1003,084. doi: 10.1371/journal.pcbi.1003084. [DOI] [PMC free article] [PubMed] [Google Scholar]
- Posas F, Wurgler-Murphy SM, Maeda T, Thai TC, Saito H. Yeast HOG1 MAP kinase cascade is regulated by a multistep phosphorelay mechanism in the SLN1–YPD1–SSK1 “two-component” osmosensor. Cell. 1996;86(6):865–875. doi: 10.1016/S0092-8674(00)80162-2. [DOI] [PubMed] [Google Scholar]
- Qin L, Dutta R, Kurokawa H, Ikura M, Inouye M (2000) A monomeric histidine kinase derived from EnvZ, an Escherichia coli osmosensor. Mol Microbiol 36(1):24–32 [DOI] [PubMed]
- Rhee A, Cheong R, Levchenko A. The application of information theory to biochemical signaling systems. Phys Biol. 2012;9(4):045011. doi: 10.1088/1478-3975/9/4/045011. [DOI] [PMC free article] [PubMed] [Google Scholar]
- Schaber J, Baltanas R, Bush A, Klipp E, Colman-Lerner A. Modelling reveals novel roles of two parallel signalling pathways and homeostatic feedbacks in yeast. Mol Syst Biol. 2012;8:622. doi: 10.1038/msb.2012.53. [DOI] [PMC free article] [PubMed] [Google Scholar]
- Shahrezaei V, Swain PS. The stochastic nature of biochemical networks. Curr Opin Biotechnol. 2008;19(4):369–374. doi: 10.1016/j.copbio.2008.06.011. [DOI] [PubMed] [Google Scholar]
- Shannon CE. A mathematical theory of communication. Bell Syst Tech J. 1948;27(3):379–423. doi: 10.1002/j.1538-7305.1948.tb01338.x. [DOI] [Google Scholar]
- Shinar G, Milo R, Martínez MR, Alon U (2007), Input output robustness in simple bacterial signaling systems. Proc Natl Acad Sci USA 104(50):19931–19935. doi:10.1073/pnas.0706792104 [DOI] [PMC free article] [PubMed]
- Stock AM, Robinson VL, Goudreau PN. Two-component signal transduction. Annu Rev Biochem. 2000;69(1):183–215. doi: 10.1146/annurev.biochem.69.1.183. [DOI] [PubMed] [Google Scholar]
- Tanigawa M, Kihara A, Terashima M, Takahara T, Maeda T. Sphingolipids regulate the yeast high-osmolarity glycerol response pathway. Mol Cell Biol. 2012;32(14):2861–2870. doi: 10.1128/MCB.06111-11. [DOI] [PMC free article] [PubMed] [Google Scholar]
- Tao W, Malone CL, Ault AD, Deschenes RJ, Fassler JS. A cytoplasmic coiled-coil domain is required for histidine kinase activity of the yeast osmosensor, SLN1. Mol Microbiol. 2002;43(2):459–473. doi: 10.1046/j.1365-2958.2002.02757.x. [DOI] [PMC free article] [PubMed] [Google Scholar]
- Tkacik G, Callan CG, Bialek W. Information flow and optimization in transcriptional regulation. Proc Natl Acad Sci USA. 2008;105(34):12,265–12,270. doi: 10.1073/pnas.0806077105. [DOI] [PMC free article] [PubMed] [Google Scholar]
- Tkačik G, Walczak A, Bialek W. Optimizing information flow in small genetic networks. Phys Rev E. 2009;80(3):1–18. doi: 10.1103/PhysRevE.80.031920. [DOI] [PMC free article] [PubMed] [Google Scholar]
- Tkačik G, Walczak AM, Bialek W. Optimizing information flow in small genetic networks. III. A self-interacting gene. Phys Rev E. 2012;85(4):041903. doi: 10.1103/PhysRevE.85.041903. [DOI] [PubMed] [Google Scholar]
- Walczak AM, Tkacik G, Bialek W. Optimizing information flow in small genetic networks. II. Feed–forward interactions. Phys Rev E Stat Nonlinear Soft Matter Phys. 2010;81(4 Pt 1):041905. doi: 10.1103/PhysRevE.81.041905. [DOI] [PubMed] [Google Scholar]
- Waltermann C, Klipp E (2011) Information theory based approaches to cellular signaling. Biochim Biophys Acta (BBA) Gen Subj 1810(10):924–932 [DOI] [PubMed]


