

Background: A proper level of BMP signal is essential for the maintenance of neural crest cells.
Results: Ets1 cooperates with HDAC1 to down-regulate BMP signaling output and reduce id3 expression.
Conclusion: Ets1 regulates neural crest development through epigenetic control of BMP signaling.
Significance: This is the first study linking Ets1 to BMP signaling.
Keywords: bone morphogenetic protein (BMP), embryo, ETS transcription factor family, histone deacetylase (HDAC), signal transduction, Xenopus, BMP, Id3, neural crest
Abstract
The neural crest (NC) is a transient, migratory cell population that differentiates into a large variety of tissues including craniofacial cartilage, melanocytes, and peripheral nervous system. NC is initially induced at the border of neural plate and non-neural ectoderm by balanced regulation of multiple signaling pathways among which an intermediate bone morphogenetic protein (BMP) signaling is essential for NC formation. ets1, a proto-oncogene playing important roles in tumor invasion, has also been implicated in delamination of NC cells. In this study, we investigated Ets1 function in NC formation using Xenopus. Overexpression of ets1 repressed NC formation through down-regulation of BMP signaling. Moreover, ets1 repressed the BMP-responsive gene id3 that is essential for NC formation. Conversely, overexpression of id3 can partially rescue the phenotype of NC inhibition induced by ectopic ets1. Mechanistically, we found that Ets1 binds to id3 promoter as well as histone deacetylase 1, suggesting that Ets1 recruits histone deacetylase 1 to the promoter of id3, thereby inducing histone deacetylation of the id3 promoter. Thus, our studies indicate that Ets1 regulates NC formation through attenuating BMP signaling epigenetically.
Introduction
The neural crest (NC)2 is a transient population of cells unique to vertebrates during embryonic development that is pluripotent and highly migratory. Arising at the border between neural plate and non-neural ectoderm, NC cells migrate extensively and differentiate into various tissues (1). The initial induction of NC occurs during gastrulation in response to the combined effects of bone morphogenetic protein (BMP), Wnt, FGF, retinoic acid, and Notch signals (2–6). These signaling pathways orchestrate and firstly activate neural plate border (NPB) specifiers including Pax3, Msx1 (7), and Zic1 (8), which establish a broad competence domain at the NPB. The cooperation of NPB specifiers, especially Pax3 and Zic1 (8, 9), induces more restrictedly localized NC specifiers including c-Myc (10), Foxd3 (11, 12), Sox9 (13), Snail1 (14, 15), Snail2 (16), Tfap2 (17), and Id3 (18, 19), which coordinate each other to regulate NC delamination and migration. The gene regulatory network of NC formation is conserved across vertebrate including zebrafish, frog, and mouse (20).
Among the mentioned signaling pathways, BMPs are postulated to pattern NC formation of zebrafish and Xenopus in a gradient fashion. A modest attenuation of endogenous BMP signal is required for the initial induction of NC (21–23), whereas the activated BMP signal is required for the maintenance of NC cells at neurula stages (24). In both Xenopus and zebrafish neurulae, a conserved intermediate level of BMP signaling has been detected in the NPB region (25). However, the molecular mechanisms as to how the intermediate BMP activity is defined are not well understood. It has been reported that among the target genes of BMP signaling pathway, id3, a member of the Id gene family, is expressed in NC where it plays an essential role in mediating NC cell proliferation and cell survival (19, 26).
In addition to genetic regulation, the NC development is also subject to epigenetic regulation such as histone acetylation and deacetylation catalyzed by histone acetyltransferases and histone deacetylases (HDACs), respectively. Histone deacetylation is in general associated with gene silence. In mice, knock-out of Hdac8 in the NC caused defects in cranial NC cells and losses of cranial skeletal elements (27). Studies with Xenopus embryos have also shown an obvious NC inhibition after treatment with trichostatin A (TSA), a common HDAC inhibitor (28).
The proto-oncogene Ets1 belongs to the E26 transformation-specific (ETS) family of transcription factors. Previous reports showed that Ets1 is involved in hematopoietic development, angiogenesis, and tumor invasion (29). In Xenopus embryos, it was found that ets1 is strongly expressed in premigratory and migratory NC cells (30, 31). A recent study with chicken embryos suggested that Ets1 is regulated by a group of NC specifiers including Sox10, Pax7, Msx1/2, Foxd3, and Tfap2 (31). Other studies also suggested that Ets1 is required for cranial NC delamination as well as the migration and differentiation of cardiac NC (32, 33). In chicken embryos, Ets1 cooperates with Sox9 and c-Myb to activate Sox10 expression (34). In this study, we investigated the functions of ets1 during NC development using Xenopus embryos. We found that overexpression of ets1 represses NC formation, which is at least partially due to the attenuation of BMP signaling by down-regulation of id3, a BMP target gene. In addition, Ets1 physically interacts with HDAC1 and recruits HDAC1 to the id3 promoter, resulting in histone deacetylation of this region. Collectively, our study adds important insights into the epigenetic regulation of NC development.
Experimental Procedures
DNA Constructs
The open reading frames of Xenopus laevis ets1a, id3, and hdac1 were amplified using PCR and cloned into pCS2+ or into pCS2GR, pCS2FLAG, pCS2HA, and pCS2Myc. Deletion mutants of ets1 were generated by PCR and subcloned into pCS2Myc. All constructs were confirmed by DNA sequencing.
Injection, Whole-mount in Situ Hybridization, LacZ Staining, Cartilage Staining, and Vibratome Sectioning
X. laevis embryos were obtained by in vitro fertilization and cultured using methods described previously (35). Embryos were staged according to Nieuwkoop and Faber (36). Capped mRNAs were synthesized in vitro using the mMessage mMachine kit (Invitrogen). Translation-blocking MOs targeting ets1 mRNA were purchased from Gene Tools, Inc. (ets1MO1, 5′-TCCTTCCAAATAGAGAAATGTGTGT-3′; ets1MO2a, 5′-TGAGATCTAGCGCAGCTTTCATGGC-3′; ets1MO2b, 5′-TAAGGTCTAGTGCAGCTTTCATGGC-3′). Embryos were injected with mRNAs or MO at the two-cell or four-cell stage and raised to the indicated stages. LacZ staining was performed using X-Gal or red X-Gal as described previously (37). Whole-mount in situ hybridization was performed using a digoxigenin-labeled antisense RNA probe, and signals were developed using nitro blue tetrazolium/5-bromo-4-chloro-3-indolyl phosphate (Roche Applied Science) (38). Alcian blue cartilage staining was performed as described previously (39).
Animal Cap Assay and RT-PCR
The animal cap assay was performed as described previously (40). Total RNA was extracted using the TRIzol reagent (Invitrogen), and cDNA was synthesized using Superscript III (Invitrogen) following the manufacturer's manual. Primers for RT-PCR are listed in Table 1.
TABLE 1.
Primers used for RT-PCR
Re, reverse; Fw, forward; odc, ornithine decarboxylase.
| Gene | Sequence (5′–3′) | Ref. |
|---|---|---|
| ets1a Fw | TTGAACAGGCAATAGCAG | This study |
| ets1a Re | ACATCTGTAGTCCCTCCC | |
| id3 Fw | GGGAAACTTTGAGAGAGAGAGAG | This study |
| id3 Re | CGGGTTGCAAAGGGTTAAAG | |
| snail2 Fw | TCCCGCACTGAAAATGCCACGATC | 22 |
| snail2 Re | CCGTCCTAAAGATGAAGGGTATCCTG | |
| sox9 Fw | AAGCAGAATGTCCTCTGTGA | 35 |
| sox9 Re | AAGGCCAGATTCAGTTCTTC | |
| foxd3 Fw | GGAGGGAGGGGGCAATGCAC | 12 |
| foxd3 Re | CCCCGAGCTCGCCTACT | |
| odc Fw | CAGCTAGCTGTGGTGTGG | E. M. De Robertis |
| odc Re | CAACATGGAAACTCACACC | |
| pax3 Fw | CTACCTCGGTTTCTTGACTG | 35 |
| pax3 Re | TGGTCAATCCTTCTTAATGG | |
| zic1 Fw | ATGAAGGTCCACGAAGCATC | 8 |
| zic1 Re | CGTGCTGTGATTGGACGTGT | |
| sox2 Fw | GAGGATGGACACTTATGCCCAC | E. M. De Robertis |
| sox2 Re | GGACATGCTGTAGGTAGGCGA | |
| sox3 Fw | TGATGCAGGACCAGTTGGGC | 35 |
| sox3 Re | TGAAGTGAAGGGTCGCTGGC | |
| msx1 Fw | GCTAAAAATGGCTGCTAA | E. M. De Robertis |
| msx1 Re | AGGTGGGCTGTGTAAAGT |
Protein Co-immunoprecipitation (Co-IP) and Chromatin Immunoprecipitation (ChIP)
For co-IPs, embryos or HEK293T cells were lysed in lysis buffer (137 mm NaCl, 5 mm EDTA, 10 mm Tris-HCl, pH 7.5, 0.5% Triton X-100) containing protease inhibitors. The cell lysates were incubated with the indicated antibody for 2 h at 4 °C followed by incubation with protein G-Sepharose beads (GE Healthcare) for 1 h and washing in lysis buffer five times. Precipitates were separated by SDS-PAGE and transferred to nitrocellulose membrane for blotting. Protein bands were quantified using ImageJ. ChIP was performed according to the published protocols using Xenopus embryos or HEK293T cells (41, 42). The immunoprecipitated DNA fragments were purified and analyzed by PCR using primers listed in Table 2. Two independent experiments were performed for each ChIP assay, and one representative result is depicted. The antibodies used in this study are listed in Table 3.
TABLE 2.
Primers used for ChIP assay in this study
Fw, forward; Re, reverse.
| Sequence (5′–3′) | Locus | |
|---|---|---|
| Primer pair 1 | ||
| Fw | GCATTTCAGCCTGGAAGCAT | NT_004610.19 |
| Re | ATGCCTCTTCTCTGCAAAGCAC | |
| Primer pair 2 | ||
| Fw | TTTCCCTCCTCCTTCTGCAATC | NT_004610.19 |
| Re | CCCACCCCCCGTTTTTTTTA | |
| Primer pair 3 | ||
| Fw | CGGTATGTGCAATTATCTA | JGI Xenla 6.0 |
| Re | AAAAGCCATTATTCTGTATC | Scaffold159155 |
| Primer pair 4 | ||
| Fw | GCATTAATGACACAGTCC | JGI Xenla 6.0 |
| Re | CTCTTTTATAGTCACACTC | Scaffold159155 |
| GAPDH | ||
| Fw | CGCTTTCTTTCCTTTCGC | AC_000144 |
| Re | TGCCCATTCATTTCCTTCC | |
| Primer control | ||
| Fw | TCCACATGCACAACCCTTTA | JGI Xenla 6.0, |
| Re | TCTTTGCCCACAAATCTGGT | Scaffold28661 (57) |
TABLE 3.
Primary antibodies used in this study
p-Smad1, phosphorylated Smad1.
| Antibody | Company | Catalog no. |
|---|---|---|
| Ets1 | Abcam | ab26096 |
| Smad1 | Invitrogen | 38-5400 |
| p-Smad1 | Cell Signaling Technology | 9511 |
| FLAG | Sigma-Aldrich | F1804 |
| HA | Sigma-Aldrich | H3663 |
| Myc | Cell Signaling Technology | 2276, 2278 |
Luciferase Assay
HEK293T cells were plated into 48-well plates and transfected with BRE-Id1 reporter plasmid, Renilla luciferase pRL-CMV, and the indicated plasmids. BMP4 was added 1 day after the transfection, and luciferase activity was measured using the Dual-Luciferase system (Promega) 24 h later.
TUNEL Assay
One dorsal blastomere of four-cell stage embryos was injected with ets1 and lacZ mRNAs and collected at the indicated stages. LacZ staining was performed to identify the injection side. The fixed embryos were rehydrated in 1× SSC. After bleaching, the embryos were transferred to 1× PBS and incubated in terminal deoxynucleotidyltransferase buffer for 1 h. End labeling was carried out in terminal deoxynucleotidyltransferase buffer containing 1 μm digoxigenin-11-dUTP (Roche Applied Science) and 200 units/ml terminal deoxynucleotidyltransferase (Roche Applied Science) overnight at room temperature. The reaction was terminated by washing in 1× PBS containing 1 mm EDTA at 65 °C for 1 h. The digoxigenin epitope was detected using antibody conjugated with alkaline phosphatase (Roche Applied Science) as in in situ hybridization.
Results
Expression of ets1 in NC Is Regulated by Lrig3 and FGF Signaling
Our previous study revealed that Lrig3 regulates NC formation downstream of Pax3 and Zic1 in Xenopus (40). Using microarray analysis, we further identified ets1, an ETS transcription factor, as a downstream effector of Lrig3 during NC formation. The microarray data were deposited into NCBI Gene Expression Omnibus under accession number GSE50487. The representatives of NC-related genes with -fold change and p value after knockdown of lrig3 are listed in Table 4. We validated the microarray results with RT-PCR and found that, along with NC marker genes including sox9, snail2, and foxd3, ets1 was repressed by knockdown of lrig3; all of these genes were otherwise induced by co-expression of wnt3a and chordin (Fig. 1A). This result further indicated that Lrig3 regulates ets1 during NC formation.
TABLE 4.
-Fold changes of representative genes that are involved in NC formation in comparison of Wnt3a + chordin + Lrig3MO versus Wnt3a + chordin
| Gene | Accession number | -Fold change | p value |
|---|---|---|---|
| sox10 | Xl.1588 | −12.2514 | 0.0142723 |
| pcns | Xl.15089 | −10.5758 | 0.0023312 |
| twist1b | Xl.56708 | −10.3569 | 8.67E − 07 |
| twist1a | Xl.879 | −7.07247 | 0.0044942 |
| snail2b | Xl.11972 | −6.89003 | 0.0059053 |
| ets1b | Xl.142 | −6.61179 | 0.0017931 |
| incab | Xl.4117 | −5.00622 | 0.0022 |
| sox8 | Xl.29789 | −4.34594 | 0.0015472 |
| snail2a | Xl.3818 | −4.20333 | 7.46E − 06 |
| foxd3a | Xl.525 | −4.07228 | 0.0165975 |
| ets1a | Xl.1148 | −4.01187 | 0.0028018 |
| foxd3b | Xl.523 | −4.01002 | 0.0585129 |
| id3 | Xl.8060 | −1.17389 | 0.0348254 |
| tubulin1b | Xl.13561 | −1.16048 | 0.0594225 |
| msx1b | Xl.45216 | −1.12427 | 0.026907 |
| pax3a | Xl.49495 | 1.89796 | 0.0333841 |
| zic1 | Xl.1796 | 1.91721 | 0.0834522 |
| sox2 | Xl.188 | 9.19403 | 0.0020139 |
| sox3 | Xl.22 | 15.1422 | 0.0015098 |
FIGURE 1.

Expression of ets1 in NC is regulated by Lrig3 and FGF signaling. A, embryos were injected with chordin (Chd), chordin + wnt3a, or chordin + wnt3a + lrig3MO (L3MO). Animal caps were dissected at stage 9 and cultured to stage 17. Expression of the indicated genes in animal caps was assayed by RT-PCR. Ornithine decarboxylase (odc) was used as an internal standard. WE, uninjected whole embryo; AC, uninjected animal caps; RT−, without reverse transcriptase. B–G, spatial expression pattern of ets1 as detected by in situ hybridization. B, C, and D, dorsal view; D′, anterior view; E, F, and G, lateral view. The white arrow in C indicates the weak ets1 signal starting at stage 13. The ventral blood island is indicated by a white arrow in D′. H, temporal expression of Xenopus ets1a at the indicated stages. I–N, embryos treated with the indicated concentrations of SU5402 from stage 12. ets1 and brachyury (bra) expression was examined at stage 16 by whole-mount in situ hybridization. The expression of the indicated genes was affected in the following percentage of embryos: M, 73% (8 of 11); N, 100% (20 of 20); J, 33% (7 of 21); K, 61% (11 of 18). O, embryos were injected with 10 pg of efgf or 300 pg of wnt3a mRNA, respectively. The caps were dissected from embryos at stage 9 and then cultured to stage 15. Expression of the indicated genes in animal caps was assayed by RT-PCR.
The spatial expression pattern of ets1 showed that ets1 expression was not detected in stage 11 embryos (Fig. 1B), and weak signals began to appear from stage 13 (Fig. 1C) after which ets1 was strongly expressed in the premigratory and migratory NC cells (Fig. 1, D and E). Apart from the NC and its derivatives, ets1 expression was also detected in ventral blood island and developing blood vessels (Fig. 1, D′, F, and G). The temporal expression of ets1 indicated that it is a maternal factor with the expression reduced until gastrula stages but recovered and maintained at a relative constant level at neurula and tail bud stages (Fig. 1H). Thus, at early developmental stages, the expression pattern of ets1 suggests that its functions are associated with NC development.
Because Lrig3 acts as an FGF signaling modulator (40), we reasoned that ets1 expression could be regulated by FGF signaling. When embryos were treated with increasing doses of the FGF signaling inhibitor SU5402, the expression of ets1 was reduced in a dose-dependent manner (Fig. 1, I–K) as that of the FGF target gene brachyury (Fig. 1, L–N; see legend for the percentage of affected embryos). Moreover, the animal cap assay indicated that overexpression of efgf induced expression of ets1 but not snail2 at this injection dose (Fig. 1O), and overexpression of wnt3a could induce ets1 as well although to a lesser extent than did efgf overexpression. As the positive controls, brachyury and nr3 were induced by efgf and wnt3a, respectively (Fig. 1O). Taken together, the above data suggested that ets1 is regulated by FGF signaling during early embryonic development.
Overexpression and Knockdown of ets1 Interfere with the Development of NC Derivatives
As a first step to analyzing Ets1 function, we examined embryonic morphology upon overexpression or knockdown of ets1. We found that overexpression of ets1 resulted in apparent defects of embryonic development including repression of head and anterior axis and loss of pigment in cranial and trunk regions in the embryos at stage 39 (Fig. 2, A and B). X. laevis is a pseudotetraploid, and like many other genes that have two nonidentical copies in its genome, ets1 also has two copies, ets1a and ets1b. Therefore, for knockdown studies, an MO (ets1MO1) was designed to target the consensus sequence in 5′-UTRs of both copies of ets1 (ets1a and ets1b) to knock down both simultaneously. The endogenous Ets1 protein level was reduced by approximately 50% after injection of ets1MO1 (60 ng/embryo; Fig. 2, H and I). Interestingly, ets1 morphants also exhibited inhibition of head with pigment loss in the cranial and trunk regions when examined at stage 35 (Fig. 2, C and D). Moreover, the defects induced by ets1MO1 could be partially rescued by co-expression of ets1 mRNA (Fig. 2G), which supported the specificity of ets1MO1. To further confirm the phenotypes induced by ets1MO1, we designed another pair of MOs, ets1MO2a and ets1MO2b, that target start codons of Xenopus ets1a and ets1b, respectively. Co-injection of ets1MO2a and ets1MO2b (hereafter collectively named as ets1MO2; 60 ng/embryos) reduced the endogenous Ets1 by 60% (Fig. 2, H and I) and caused a phenotype similar to that of ets1MO1 (Fig. 2, E and F). In addition, we also examined the expression of γ-synuclein (sncg), which is a gene expressed in the cranial nerves and dorsal root ganglions (35), and found that either overexpression or knockdown of ets1 disrupted the expression of sncg in cranial nerves, particularly in the trigeminal nerve (Fig. 2, J–L). To clarify whether these abnormalities are direct effects of manipulating ets1 expression, we generated two inducible constructs, ets1-GR and dominant negative ets1-GR (dnets1-GR) (43) by fusing a glucocorticoid receptor domain 3′ to the full ets1 open reading frame or to the ETS domain, respectively. Both can be activated by dexamethasone (DEX) as reported previously (44). After injection with ets1-GR or dnets1-GR, the embryos treated with DEX exhibited inhibition of anterior axis formation and abnormalities in pigment formation (Fig. 2, M–P). Moreover, the sncg expression was much reduced (Fig. 2, R and T), which is similar to the embryos injected with ets1 mRNA or ets1MOs. The embryos without DEX treatment did not show obvious defects (Fig. 2, M, O, Q, and S), suggesting that the phenotypes induced by ets1-GR or dnets1-GR are specific. Likewise, in both ets1-overexpressing embryos and ets1 morphants, cranial cartilage formation was impaired on the injected side (Fig. 2, U–W). However, it is notable that the inhibition of cranial cartilage induction by overexpression of ets1 was much more profound than that caused by knockdown of ets1. These results indicate that an optimal level of Ets1 is essential for normal NC development.
FIGURE 2.

Overexpression or knockdown of ets1 causes defects in NC derivatives. A and B, ets1 overexpression (500 pg/embryo; 85%; 23 of 27) caused loss of pigment throughout the body and inhibition of head structures. C–F, knockdown of ets1using ets1MO1 (94%; 30 of 32) or ets1MO2 (94%; 33 of 35) showed similar pigment loss and repression of head. G, categories of defects induced by either 30 ng of ets1MO1 separately or by co-injection (inj.) with 250 pg of ets1 mRNA. Numbers at the top indicate total embryos scored at stage 35 from three independent experiments. H and I, either 60 ng of ets1MO1 or ets1MO2 was injected into two-cell stage embryos, the embryos were collected at stage 11, and Ets1 protein was detected by α-Ets1 antibody. Tubulin was used as an internal control. The bands on Western blots (H) were quantified in I. J–L, the expression of cranial nerve marker gene sncg is disrupted in embryos injected with 250 pg of ets1 mRNA (K; 85%, 28 of 33) or 30 ng of ets1MO1 (L; 72%, 18 of 25). con, control. M–P, either ets1-GR or dnets1-GR mRNA (500 pg/embryo) was injected into two-cell stage embryos. The injected embryos were treated with DEX starting at stage 13. Loss of pigment and inhibition of anterior axis were observed in DEX-treated embryos (N, 81%, 26 of 32; P, 74%, 17 of 23) but not in untreated embryos (M, 4%, 1 of 26; O, 0%, 0 of 11). Likewise, the expression of sncg was much reduced in the embryos injected with either ets1-GR or dnets1-GR and sequentially treated with DEX (R, 84%, 26 of 31; T, 84%, 21 of 25) but remained normal in embryos without DEX treatment (Q, 0%, 0 of 29; S, 0%, 0 of 18). U–W, cranial cartilage formation in control (U) and embryos injected with ets1 mRNA (V; 85%, 51 of 60) or ets1MO (W; 83%, 33 of 40) was examined by Alcian blue staining. An asterisk indicates the injected side. con, control.
Knockdown of ets1 Does Not Obviously Affect NC Formation
We then compared NC induction at stage 17 in ets1 morphants with that in the control embryos by examining the expression of NC marker genes such as foxd3 and snail2. ets1MO1 (60 ng/embryo) or ets1MO2 (60 ng/embryo) was injected into two blastomeres of Xenopus embryos at the two-cell stage. At this injection dose, neither ets1MO1 nor ets1MO2 apparently affected foxd3 (Fig. 3, A, B, E, and F) or snail2 expression (Fig. 3, C, D, G, and H). Likewise, ets1MO2 (30 ng/embryo) injected into one blastomere of embryos at the two-cell stage did not obviously affect the expression of foxd3 (Fig. 3I) or snail2 (Fig. 3J). However, in animal caps co-injected with chordin and wnt3a, knockdown of ets1 repressed the NPB marker pax3 and the NC markers sox9 and snail2 (Fig. 3K). This discrepancy might be due to redundant factors that exist in embryos but not in in vitro induced NC tissues. In fact, ets2, the closest member to ets1 in the Ets family, is expressed in NC cells (30) but was not induced in animal caps by co-injection of wnt3a and chordin (Fig. 3K). We examined ets2 expression in Xenopus embryos. ets2 was expressed strongly in the animal pole in two-cell stage embryos (Fig. 3L). We detected its expression in the mesoderm surrounding the yolk plug at stage 11 (gastrula; Fig. 3M). Although its expression at neurula stages is low (Fig. 3, N and O), strong signals were clearly detected in the migrating NC at tail bud and tadpole stage embryos (Fig. 3, P and Q). Thus, it is likely that Ets2 can compensate some of the functions of Ets1 in ets1 morphants.
FIGURE 3.

Knockdown of ets1 does not obviously affect NC formation but blocks NC migration. A–J, the expression of foxd3 or snail2 was not inhibited by ets1MOs. ets1MO1 or ets1MO2 was injected either separately into both blastomeres (A–D, 60 ng of ets1MO1/embryo; E–H, 60 ng of ets1MO2/embryo) or together with 100 pg of lacZ mRNA into one blastomere (I and J, 30 ng/embryo) at the two-cell stage. The injected embryos were collected at stage 17 and examined for foxd3 (B, 90%, 18 of 20; F, 96%, 24 of 25; I, 95%, 21 of 22) and snail2 (D, 95%, 22 of 23; H, 92%, 23 of 25; J, 90%, 18 of 20) by whole-mount in situ hybridization. The injected side was traced by red X-Gal staining and is marked with an asterisk (I and J). K, overexpression and knockdown of ets1 repressed NC formation in an animal cap assay. Expression of the indicated genes in animal caps injected with either chordin (Chd) + wnt3a, chordin + wnt3a + ets1, or chordin + wnt3a + ets1MO1 was examined by RT-PCR. L–Q, spatial expression pattern of ets2 as detected by in situ hybridization. st, stage. L, P, and Q, lateral view; M and N, vegetal view; O, dorsal view. The black arrow in N indicates weak expression of ets2. R and S, ets1MO1 (30 ng) and lacZ mRNA (100 pg) were co-injected into one dorsal blastomere of four-cell stage embryos, and the embryos were collected at stage 20. Segmentation and extension of cranial NC were blocked at the ets1MO1-injected side (R, 85%, 17 of 20; S, 83%, 20 of 24). T–W, knockdown of ets1 decreased the expression of twist1 in both neurula (T and U) and tail bud embryos (V and W). T, control embryo at stage 20. U, embryos injected with ets1MO1 at one side. V and W, embryos at stage 25 injected with ets1MO1 at one side. At the injected side (U, 85%, 11 of 13; W, 90%, 9 of 10), the twist1 signal stripes were weaker and did not extend laterally as far as those at the uninjected side (T and V). An asterisk indicates the injected side. U′ and U″, transverse sections of embryos shown in U (5 of 5 embryos). ets1MO1 and lacZ mRNA were co-injected at one side of the embryos. In the injected side, NC cells marked by twist1 staining were concentrated laterally to the neural tube and seemed not to detach from the neural plate. In the uninjected side, NC cells extended out of the neural plate, and signal spots were scattered underneath the mesoderm region, suggesting that NC cells migrated into the arches. An asterisk indicates the injected side. Scale bars in U′ and U″ indicate 100 μm. X and Y, Ets1MO2 (30 ng/embryo) was co-injected with lacZ mRNA (100 pg; used as a lineage tracer) into one blastomere of two-cell stage embryos, and embryos were stained for the expression of twist1 (81%, 17 of 21) and snail2 (79%, 11 of 14). The extension of cranial NC was decreased in the ets1MO2-injected side. WE, uninjected whole embryo; AC, uninjected animal caps; RT−, without reverse transcriptase; con, control.
To investigate the migration of NC cells, ets1MO1 was injected into one dorsal blastomere of Xenopus embryos at the four-cell stage. The injected embryos were collected at late neurula stages around stage 20 for examining the expression of foxd3, snail2, and twist1. NC cells started to extend laterally from neural tube in the uninjected side, whereas they were restricted to a narrow region along the neural tube in the injected side (Fig. 3, R, S, and U). In line with this observation, the expression of migratory NC marker gene twist1 was also reduced in the injected side at tail bud stages (Fig. 3, V and W), although the reduction was not apparent at late neurula stages (Fig. 3, T and U). The twist1 signal stripes marking cranial NC did not extend laterally as far as those in the uninjected side either (Fig. 3, V and W). Sections from stage 20 embryos suggested that the NC cells labeled by twist1 staining at the ets1MO1-injected side cannot detach and migrate from the neural plate, forming a concentrated signal zone when compared with those at the uninjected side (Fig. 3, U′ and U″). Injection of ets1MO2 into one blastomere of embryos at the two-cell stage also attenuated lateral extension of NC expressing twist1 and snail2 (Fig. 3, X and Y).
Taken together, these results suggested that, although the initial induction of NC was not apparently affected by ets1 depletion, Ets1 was required for the migration of NC cells. This is consistent with a previous study in chicken embryos that showed that knockdown of ets1 resulted in NC delamination defects, thereby affecting NC migration (33).
Overexpression of ets1 Represses NC Formation
We also investigated effects of overexpression of est1 on NC formation. Increasing doses of ets1 mRNA were injected into two blastomeres of Xenopus embryos at the two-cell stage, and the expression of foxd3, snail2, and twist1 at stage 17 was examined. Low injection doses of ets1 (100 or 200 pg/embryo) did not obviously interfere with NC formation (data not shown), whereas the high injection dose of ets1 (500 pg/embryo) severely repressed foxd3 (Fig. 4, A and B), snail2 (Fig. 4, C and D), and twist1 (Fig. 4, E and F). We then compared NC formation in the injected side of embryo with that in the uninjected side of the same embryo. ets1 mRNA (250 pg/embryo) was injected into one dorsal blastomere of four-cell stage embryos, which resulted in strong inhibition of the expression of snail2, foxd3, and c-myc in the injected side (Fig. 4, G–L). To further confirm this result, the ets1-GR mRNA was injected into one dorsal blastomere of embryos at the four-cell stage, and Ets1-GR was then activated by adding DEX at stage 12 when the mesoderm was formed and the induction of NC was initiated. We found that the expression of snail2, foxd3, and c-myc was repressed upon activation of Ets1-GR by DEX (Fig. 4, P–R), whereas the injected embryos without DEX treatment were unaffected (Fig. 4, M–O). To exclude the possibility that the repression of NC was due to defective mesoderm formation (45, 46), we examined the expression of two mesoderm marker genes, brachyury and chordin, in ets1-injected embryos. The expression of brachyury and chordin was not obviously altered by ectopic ets1 (Fig. 4, S–V), suggesting that the initial development of mesoderm was not affected by ets1 overexpression and that inhibition of NC formation was due to disturbed differentiation of ectoderm rather than mesoderm. Moreover, ets1 overexpression also repressed the NC marker genes including sox9 and snail2 but not the NPB marker pax3 in animal caps injected with chordin and wnt3a (Fig. 3K). This was further confirmed in ectopic NC induced by pax3 and zic1 (8, 9) (Fig. 4, W and X) where foxd3 (Fig. 4W′) and snail2 (Fig. 4X′) were repressed by ectopic ets1 in whole embryos. It is notable that in animal caps the up-regulation of sox9, foxd3, and snail2 induced by co-injection of pax3 and zic1 was also repressed by ets1 overexpression (Fig. 4Y). Taken together, overexpression of ets1 repressed NC formation in whole embryos as well as in animal cap assays.
FIGURE 4.

Overexpression of ets1 represses formation of NC in embryos and in animal caps injected with pax3 and zic1 mRNAs. A–F, the NC markers foxd3 (100%, 10 of 10), snail2 (78%, 7 of 9), and twist1 (80%, 12 of 15) were repressed by overexpression of ets1. G–R, either ets1 or ets1-GR mRNA was co-injected with lacZ mRNA into one dorsal blastomere of four-cell embryos, and embryos were collected at around stage 17. Embryos injected with ets1-GR were treated with dimethyl sulfoxide or DEX from stage 12 to stage 17. Whole-mount in situ hybridization was used to examine the NC marker genes snail2 (J, 71%, 17 of 24; M, 100%, 19 of 19; P, 65%, 13 of 20), foxd3 (K, 63%, 17 of 27; N, 95%, 18 of 19; Q, 62%, 8 of 13), and c-myc (L, 62%, 13 of 21; O, 100%, 20 of 20; R, 60%, 9 of 15). The injected side was traced by LacZ staining. S–V, mesoderm marker genes brachyury (bra; S and T) and chordin (chd; U and V) were examined in embryos injected with ets1. S and U, control embryo; T and V, ets1-injected embryos. W–X′, the mRNA mixtures of pax3 + zic1 or pax3 + zic1 + ets1 were injected into one dorsal blastomere at the four-cell stage, and the expression of foxd3 (W, 90%, 17 of 19; W′, 74%, 29 of 39) and snail2 (X, 94%, 15 of 16; X′, 75%, 24 of 32) was examined by whole-mount in situ hybridization at stage 16. Y, animal cap assays indicated that overexpression of ets1 suppressed the expression of NC maker genes induced by pax3 and zic1 and enhanced neural marker genes. WE, uninjected whole embryo; AC, uninjected animal caps; RT−, without reverse transcriptase; con, control.
Ets1 Attenuates BMP Signaling Downstream of Phosphorylation of Smad1/5/8
Because overexpression of ets1 did not seem to affect mesoderm formation and NC is an ectodermal derivative, we examined genes involved in ectoderm differentiation in ets1-injected embryos. ets1 mRNA was injected into one dorsal blastomere of four-cell stage embryos, and the expression of sox3, zic1, and epi-keratin was examined. Overexpression of ets1 expanded the pan-neural marker sox3 (Fig. 5A) but suppressed the epidermis marker epi-keratin (Fig. 5B) in the injected side. These observations strongly suggested that BMP signaling was inhibited as attenuation of BMP signaling is essential for neural induction (21, 47). Consistent with these findings, zic1 (Fig. 5C) was strongly induced by ectopic ets1. zic1 is regarded as a gene directly induced by the inhibition of BMP signaling (48). The strong induction of zic1 represents additional evidence supporting the view that BMP signaling was attenuated by ets1 overexpression. Induction of NC markers such as foxd3 and snail2 in animal caps by injection of pax3 and zic1 was suppressed by co-injection of ets1, whereas expression of the neural markers sox2, sox3, and ncam was increased (Fig. 5D), again supporting the view that overexpression of ets1 inhibits BMP signaling.
FIGURE 5.

Overexpression of ets1 attenuates BMP signal downstream of Smad1/5/8 phosphorylation and represses id3 through binding to its promoter. A–C, in situ hybridization analysis of the expression of the indicated markers in embryos injected with ets1 mRNA (sox3, 87%, 13 of 15; epi-keratin (epiker), 75%, 12 of 16; zic1, 100%, 22 of 22). An asterisk indicates the injected side. D, neural markers sox3, sox2, and ncam were induced by ets1 overexpression in an animal cap assay. E–G, expression of sizzled was examined in embryos injected with bmp4 mRNA (89%, 32 of 36) alone or together with ets1 mRNA (68%, 27 of 40). H, luciferase assay was performed to assay BMP signaling. chordin (chd) was used as a control. *, p < 0.05 between indicated group and the group only treated with BMP4. I, Western blot showing the level of phosphorylated Smad1/5/8 (p-Smad1/5/8) and total Smad1/5/8 in stage 16 embryos overexpressing ets1. Endogenous tubulin was used as a loading control. J, co-immunoprecipitation was performed using lysates from embryos injected with either ets1-HA, smad1-Myc separately, or both. K and L, expression of id3 in control (K) and ets1-injected embryos (L; 65%, 22 of 34) was examined by in situ hybridization. M–P, expression of foxd3 and snail2 in embryos injected with either the mixture of ets1 and gfp (M, 69%, 24 of 35; O, 61%, 22 of 36) or the mixture of ets1 and id3 (N, 69%, 31 of 45; P, 60%, 29 of 48). Q–R′, cell apoptosis was detected by TUNEL assay (black spots) in embryos with one side injection of ets1 mRNA (100%, 5 of 5). LacZ staining (light blue) was used to indicate the injected side. Q, control embryos; R, ets1-injected embryo; R′, high magnification of framed region in R. S–V, hairy2-GR mRNA (500 pg/embryos) was injected into embryos at the two-cell stage alone or together with ets1 (500 pg/embryos), and DEX was used to treat embryos from stage 13 to stage17. The expression of msx1 was examined using in situ hybridization. Although hairy2 slightly promoted msx1 expression (T, 88%, 23 of 26), co-expression with ets1 enhanced msx1 expression (U, 95%, 19 of 20; V, 96%, 25 of 26). W, the predicated Ets1 binding site in the id3 promoter of X. laevis and the primers used in ChIP. W′, schematic diagram illustrating the predicted SMAD1 and ETS1 binding sites in the human ID3 promoter and the primers used in the ChIP assay. X, ChIP was performed using antibodies against ETS1 in HEK293T cells, and the precipitated DNA fragments were amplified using primer pair 1 (P1) or the GAPDH primer pair, respectively. Endogenous ETS1 can bind to the predicted binding site. The GAPDH primer pair was used as the control. Y and Z, ChIP was done in X. laevis embryos injected with 500 pg of ets1-FLAG. Semiquantitative (Y) and real time PCR (Z) were performed using primer pair 3 (P3) or primer pair control (Pc) (Table 2). WE, uninjected whole embryo; AC, uninjected animal caps; RT−, without reverse transcriptase; con, control; IB, immunoblot. Error bars represent S.D.
We next overexpressed bmp4 to induce expansion of sizzled, a direct target of BMP signaling in embryos. The induced sizzled expression was repressed by co-expression of ets1 (Fig. 5, E–G), confirming again the inhibition of BMP signaling by ectopic ets1. In the luciferase assay performed in HEK293T cells, the recombinant BMP4-activated luciferase reporter signals were also decreased by ets1 overexpression in a dose-dependent way with chordin used as a positive control (Fig. 5H). Collectively, these data strongly indicated that overexpression of ets1 attenuates BMP signaling. We next wanted to investigate how Ets1 regulates BMP signaling. Phosphorylation of Smad1/5/8, which respond to the activation of BMP signaling, was not reduced but rather moderately enhanced by overexpression of ets1 (Fig. 5I). Moreover, Ets1 does not appear to physically interact with Smad1 because co-immunoprecipitation did not show binding between them (Fig. 5J). These results suggested that Ets1 functioned downstream of Smad1/5/8 phosphorylation to regulate the output of BMP signaling.
Ets1 Represses NC Formation Partially through Down-regulation of Id3
The BMP target gene id3 plays essential roles in maintaining NC progenitors (18, 19, 26, 49). Knockdown of id3 caused the absence of NC precursors and losses of NC derivatives (19). These findings prompted us to investigate whether Id3 is a downstream target of Ets1 in regulating NC formation. To test this hypothesis, we injected ets1 mRNA into one dorsal blastomere of four-cell stage embryos and examined the expression of id3 at stage 17 by whole-mount in situ hybridization, which showed that id3 was strongly repressed by overexpression of ets1 in the injected side (Fig. 5, K and L). Moreover, we found that ets1-induced repression of foxd3 and snail2 (Fig. 5, M and O) was partially rescued by co-expression of id3 (Fig. 5, N and P). In addition, a TUNEL assay showed that ets1 overexpression induced a profound increase of apoptotic cells in the injected region (Fig. 5, Q, R, and R′), suggesting furthermore that repression of NC induced by ets1 overexpression at least in part is due to the decreased expression of id3. In a previous study, Id3 was found to interact with Hairy2 and negatively regulated Hairy2 activity, which plays an essential role in NC specification (50). We co-injected hairy2-GR and ets1, and the injected embryos were treated with DEX. We observed a strong increase of msx1, which is similar to the effect of co-injection of hairy2 and id3MO (Fig. 5, S–V) (50). This result suggested that Hairy2 is related to the Ets1-Id3 axis in the NC regulatory network.
Because a previous study revealed that Ets binding motifs are enriched in Smad1/5 binding regions of the human genome (51), we examined the promoter region of ID3 and found potential Ets1 binding sites in the promoters of both human and Xenopus id3 (Fig. 5, W and W′). This was further confirmed by ChIP assay using antibody against endogenous ETS1 in HEK293T cells that showed that ETS1 bound to the predicted site in human ID3 promoter (Fig. 5X). In Xenopus embryos, FLAG-tagged Ets1 also bound to the predicted Ets1 binding site in the id3 promoter (Fig. 5, Y and Z).
Ets1 Physically Interacts with HDAC1 and Regulates BMP Signaling and NC Formation through Regulating Histone Acetylation of id3 Promoter
A previous study has reported that Ets1 interacts with HDAC1 to repress target genes in Th1 cells (52). To explore the possibility that Ets1 represses BMP target genes through epigenetic control during NC development, we first assessed the interaction between Ets1 and HDAC1 in both Xenopus embryos and cultured mammalian cells. Xenopus ets1-Myc and human HDAC1-HA were co-transfected into HEK293T cells, and a co-IP assay was performed. Strong interaction between Ets1 and HDAC1 was demonstrated (Fig. 6A). Alternatively, in Xenopus embryos injected with Xenopus ets1-Myc and human HDAC1-HA mRNAs, Ets1 was also co-precipitated with HDAC1 in the injected embryos (Fig. 6B). We also carefully compared the expression of Xenopus hdac1 and ets1. Apart from the strong expression in neural plate, hdac1 was also detected in NC, largely overlapping with the ets1 expression region (Fig. 6, C–E), suggesting the interaction of Xenopus Hdac1 and Ets1 during NC development.
FIGURE 6.
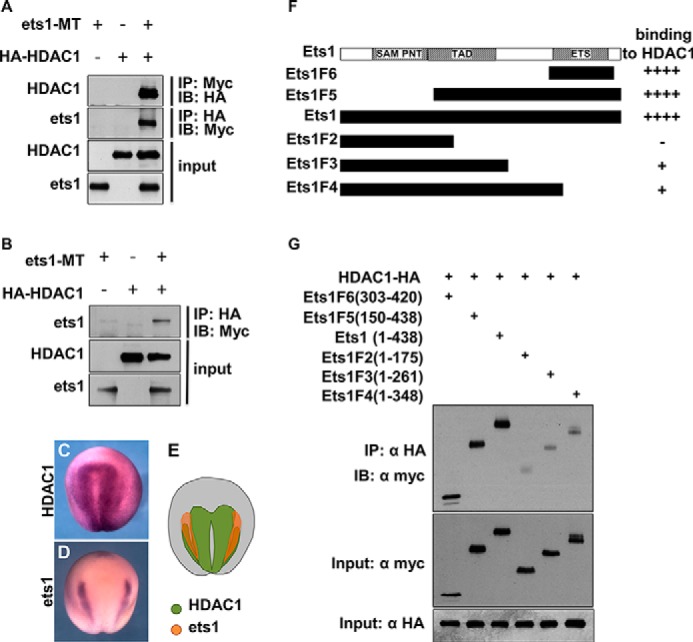
Ets1 physically interacts with HDAC1 through the ETS domain. A, co-IP was carried out with extracts of HEK293T cells transfected with either Ets1-Myc, HDAC1-HA separately, or both using antibodies against Myc or HA. B, co-IP indicates that Ets1-Myc binds to HDAC1-HA in Xenopus embryos. C–E, expression patterns of Xenopus hdac1 (C) and ets1 (D) in Xenopus embryo at stage 17. A schematic diagram of Xenopus hdac1 and ets1 expression (E) indicates overlap between them. F, Ets1 deletion mutants and their binding ability to HDAC1. G, co-IP was carried out to examine the binding of Myc-tagged Ets1 deletion mutants and HDAC1-HA in HEK293T cells. IB, immunoblot; TAD, transactivation domain; SAM, sterile α motif; PNT, pointed.
We then constructed a series of C-terminal and N-terminal deletion mutants of Ets1 to map the domains that interact with HDAC1. The co-IP results revealed that Ets1F5 (amino acids 150–438) and Ets1F6 (amino acids 303–420), which both contain the ETS domain, interacted with HDAC1 to the same degree as did wild-type Ets1, whereas other deletion mutants that do not contain the ETS domain showed only weak association with HDAC1 (Fig. 6, F and G). These results suggest that the ETS domain is essential for Ets1 interaction with HDAC1.
We further assessed whether the interaction is required for Ets1-mediated regulation of BMP signal transduction and NC formation. The mRNAs encoding deletion mutants of ets1 were injected into Xenopus embryos, and the effects on NC and epidermis development were compared with those induced by wild-type ets1. We found that Ets1F5 and Ets1F6, which showed strong interaction with HDAC1, repressed NC marker gene foxd3 (Fig. 7, D and E) and epi-keratin (Fig. 7, I and J) as did wild-type ets1 (Figs. 4 and 5B). In contrast, ets1F2, ets1F3, and ets1F4 that only weakly associated with HDAC1 failed to repress the examined markers (Fig. 7, A–C and F–H). In fact, we observed that ets1F3 and ets1F4 moderately expanded foxd3 expression (Fig. 7, B and C).Thus, the interaction with HDAC1 seems to be required for Ets1 to repress NC and epidermis markers. To determine whether the activity of HDAC is required for the effects of ectopic ets1, we used the HDAC inhibitor TSA to inhibit HDAC1 activity in the ets1-injected embryos. As shown above, overexpression of ets1 resulted in repression of foxd3 (Fig. 7, K and L) and expansion of sox3 (Fig. 7, O and P), whereas TSA treatment reversed the inhibitory effects of ets1 as ectopic foxd3 was induced (Fig. 7, M and N) and sox3 was repressed (Fig. 7, Q and R). These results suggested that in the presence of HDAC overexpression of ets1 inhibits NC formation, whereas when HDAC is inhibited, overexpression of ets1 promotes NC formation. We next used real time PCR to examine id3 expression in the embryos injected with ets1 deletion mutants or treated with TSA. Overexpression of ets1F3 and ets1F4 enhanced id3 expression (Fig. 7S). In contrast, ets1F5, ets1F6, and ets1 repressed id3 expression (Fig. 7S). With TSA treatment, ets1 moderately enhanced id3 expression compared with that in control embryos (Fig. 7S). These observations are in line with the change of foxd3 revealed by whole-mount in situ hybridization (Fig. 7, A–R). Because these results are in good agreements with the aforementioned results that Ets1 represses NC formation through down-regulation of BMP signaling target gene Id3, it prompted us to investigate the role of Ets1 in epigenetic control of BMP signaling and NC formation. ChIP assay showed that co-transfection of ets1 and hdac1 enhanced the binding of HDAC1 to the ID3 promoter compared with that in the cells transfected with HDAC1 alone (Fig. 8A). In Xenopus embryos, overexpression of Ets1, Ets1F5, or Ets1F6 that strongly bound to HDAC1 also resulted in reduced acetylated histone 4 on id3 promoter (Fig. 8, B–D). In contrast, overexpression of ets1F3 that weakly interacted with HDAC1 promoted histone 4 acetylation on id3 promoter (Fig. 8E).
FIGURE 7.

The interaction with HDAC1 is required for Ets1 to regulate NC and epidermis formation as well as id3 expression. A–J, embryos were injected with mRNAs of different ets1 deletion mutants (250 pg/embryo) in one side and stained for the expression of foxd3. Injection of ets1F2, ets1F3, and ets1F4 did not apparently affect the expression of foxd3 (A–C) and epi-keratin (epiker; F–H), whereas overexpression of ets1F5 and ets1F6 suppressed these two marker genes at the injected side (foxd3: D, 65%, 13 of 20; E, 94%, 15 of 16; epi-keratin: I, 90%, 9 of 10; J, 93%, 26 of 28). An asterisk indicates the injected side in embryos. K–R, embryos injected with 250 pg of ets1 mRNA were treated with 50 nm TSA from stage 13 to stage 17. foxd3 was repressed by overexpression of ets1 alone (67%, 16 of 24), whereas ectopic foxd3 in ets1-injected embryos was induced after TSA treatment (57%, 8 of 14). The expression of sox3 was expanded by overexpressing ets1 (83%, 15 of 18), whereas TSA treatment reduced the expression of sox3 in the ets1-injected side (93%, 14 of 15). LacZ staining was used to trace the injected side. S, real time PCR analysis of id3 expression in embryos injected with the different mRNAs as indicated or treated with TSA. Results are presented as -fold changes after normalization to ornithine decarboxylase expression. con, control. Error bars represent S.D.
FIGURE 8.

Ets1 recruits HDAC1 to the id3 promoter and reduces the level of acetylated histone 4. A, ChIP was done using HEK293T cells transfected with either HDAC1-HA alone or Xenopus Ets1. The precipitated DNA fragments were amplified using primer pair 2 (P2) or the GAPDH primer pair. The co-expression of Ets1 promoted the binding of HDAC1 to the ID3 promoter. B–E, ChIP was performed in the embryos injected with the indicated mRNAs. The precipitated DNA fragments were analyzed by semiquantitative PCR (B) or real time PCR (C–E). Error bars represent S.D. Asterisk represents p value <0.05 and double-asterisk represents p value <0.01.
Taken all together, these results suggested that ets1 cooperates with HDAC1 to repress gene transcription of id3 through reducing histone acetylation. Based on our findings and previous reports, we therefore propose that the interaction between Ets1 and HDAC1 allows HDAC1 to bind to id3 promoter, resulting in the reduced histone acetylation, decreased id3 transcription, and ultimately inhibition of NC formation, whereas overexpression of Ets1F3 or Ets1F4 that lack the ETS domain increased histone acetylation and id3 expression and expanded NC formation (Fig. 9).
FIGURE 9.

Proposed model showing Ets1 regulation of BMP signal and NC formation through Hdac1. When ets1 is overexpressed in embryos, it binds to Hdac1, and recruits Hdac1 to the id3 promoter, leading to deacetylation of histone and chromatin condensation, which prevents transcription of id3 and causes inhibition of NC formation. Other BMP targets involved in NC development may also be affected by this mechanism. When ets1F3 or ets1F4 Ets1 mutant is overexpressed, it enhances histone acetylation of id3 promoter and therefore promotes NC formation. eF3, Ets1F3; Ac, acetyl group; P-Smad, phosphorylated Smad.
Discussion
We have demonstrated previously that Lrig3 regulates NC formation downstream of Pax3 and Zic1 in Xenopus (40). In this study, we identified ets1 as a Lrig3 effector in microarray analysis and revealed that Ets1 plays an important role in NC development through attenuation of the BMP signaling pathway.
We observed that the zygotic activation of ets1 occurs during neurulation, which is later than that of NPB specifiers during gastrulation. Expression of NPB specifiers ap2a, hairy2, msx1, pax3, and zic1 was initiated at stage 11–12 (53), whereas weak ets1 expression was first detected at stage 13 (Fig. 1C), suggesting that ets1 functions downstream of NPB specification to regulate NC formation. In addition, expression of NC marker genes induced by pax3 and zic1 were repressed by ets1 overexpression both in whole embryos and in animal caps (Fig. 4, W, W′, X, X′, and Y). Moreover, activation of Ets1-GR from stage 14 when NPB specification has been completed could still repress foxd3 (data not shown). Thus, in the normal NC formation process, Ets1 appears to function downstream of NPB specification. This is in agreement with the results obtained in chicken embryos where ets1 is expressed in NC just before the onset of emigration, suggesting that Ets1 is not essential in neural plate border specification (54). Interestingly, knockdown of ets1 by ets1MOs in Xenopus embryos did not affect NC formation (Fig. 3, A–J) but inhibited NC migration (Fig. 3, R–Y). However, in animal cap assays, knockdown of ets1 blocked the NC formation induced by co-overexpression of wnt3a and chordin. This discrepancy may be due to the functional redundancy of other factors such as ets2, which is expressed in whole Xenopus embryos (Fig. 3, L–Q) but not in the induced animal caps (Fig. 3K). The NC development is tightly and precisely regulated by a signaling network (20). Our finding that the timing and strength of Ets1 expression are essential for NC formation and subsequent migration prompted us to postulate that Ets1 is induced by NPB specifiers during the NC formation, and the Ets1 might establish a negative feedback to attenuate NPB specifiers, which may be required for initiation of NC migration during embryonic development.
Our study provides further evidence that Ets1 regulates NC formation through attenuating BMP signaling in Xenopus embryos. It has been proposed that a modest attenuation of endogenous BMP signal is required for the initial induction of NC (21–23), whereas the activated BMP signal is required for maintaining NC cells (24). This is conserved across vertebrate including zebrafish (24, 25), Xenopus (24, 25), chicken (55), and mouse (56, 57). In this study, we found that overexpression of ets1 up-regulated the expression of neural marker genes sox3 and zic1 (Fig. 5, A, C, and D) but down-regulated epi-keratin in Xenopus embryos (Fig. 5B), suggesting that BMP signaling was attenuated by ets1 overexpression. In addition, overexpression of ets1 suppressed the sizzled expression induced by BMP4 (Fig. 5, E–G). This was further supported by an in vitro luciferase assay in which Ets1 decreased the luciferase activity of the BMP reporter pGL-Id1 induced by BMP4 (Fig. 5H). Although the BMP signal was attenuated by overexpression of ets1, the phosphorylation of Smad1/5/8 was not inhibited (Fig. 5I) but instead moderately increased, suggesting that Ets1 functions downstream of the phosphorylated Smad1/5/8 in the BMP signaling cascade. We notice that some BMP target genes such as sizzled and bambi also function as BMP signaling inhibitors, and knockdown of sizzled enhances Smad1 phosphorylation (58). Thus, the enhanced Smad1/5/8 phosphorylation might result from this negative feedback regulation in BMP signaling as overexpression of ets1 repressed sizzled.
The role of BMP signal in maintaining NC is partially mediated by activation of id3, a BMP target gene required for the survival of NC cells (19, 26). Overexpression of ets1 repressed id3 (Fig. 5, K and L). Conversely, overexpression of id3 partially rescued the repression of foxd3 and snail2 induced by ectopic ets1 (Fig. 5, M–P). The ETS binding motif is enriched in Smad1/5 binding regions in the human genome (51). In this study, we found that endogenous human ETS1 directly bound to the promoter of ID3 in HEK293T cells (Fig. 5X), and the binding was also observed in Xenopus embryos injected with ets1-FLAG mRNA (Fig. 5, Y and Z). In addition, we also found that Ets1 physically interacts with HDAC1 through the ETS domain, which was previously regarded as a DNA binding domain (Fig. 6). This was supported by overlapping expression of ets1 and hdac1 in Xenopus embryo as revealed by whole-mount in situ hybridization (Fig. 6, C–E). Several genes have been reported to regulate BMP signaling through HDACs. During osteoblast differentiation, Twist1 inhibits BMP signaling through forming a complex with Smad4 and HDAC1 (59). Moreover, it has been reported that the ETS domain of the Ets transcription factor Elk-1 is involved in recruiting HDAC to the promoters of its target genes (60).
During the early stage of NC formation, high level of Id3 and other NC specifiers cooperate to create conditions that promote NC specification. Ets1 is induced during this stage, and this stage is independent of Ets1 and hence unaffected by loss of Ets1. With the process of NC development, Ets1 protein is accumulated to a high level, which may result in a decrease of id3 and foxd3, and thereby promotes NC migration. Ets1 may serve a negative fine-tuning modulator to maintain expression of id3 or other BMP target genes at a proper level. Indeed, overexpression of ETS domain-containing Ets1 mutants that interact with HDAC1 strongly (Ets1F5 and Ets1F6) effectively repressed NC formation or id3 expression and attenuated BMP signaling (Fig. 7, D, E, I, J, and S), whereas the mutants without the ETS domain (EtsF2, Ets1F3, and Ets1F4) lost this ability (Fig. 7, A–C and F–H). These results suggest that the interaction between Ets1 and HDAC1 is required for the repression of NC formation and that the C-terminal regions of Ets1 that contain the ETS domain work as a transcriptional repression domain. In line with these finding, overexpression of Ets1 mutants (Ets1F3 and Ets1F4) that lack the ETS domain promoted NC formation and id3 expression (Fig. 7, B, C, and S). Overexpression of ets1F3 promoted histone acetylation in id3 promoter (Fig. 8E). These results suggest that the N-terminal region of Ets1 without the ETS domain may serve as a transcriptional activation domain. Furthermore, when HDAC activity was inhibited by TSA, overexpression of ets1 induced rather than repressed foxd3 expression (Fig. 7N), whereas TSA treatment alone decreased foxd3 expression (Fig. 7M) as reported in a previous study (28), suggesting that HDAC activity is also required for the inhibitory role of Ets1. Taken together, our findings suggest that different protein domains of Ets1 have distinct effects on NC formation. A number of proteins were reported to interact with different domains in Ets1 (29). For example, Ets1 was shown to interact with cAMP-response element-binding protein (CREB)-binding protein/p300, an acetyltransferase (61, 62), with its transactivation domain. It is possible that Ets1 can activate or repress gene expression by interacting with p300 or HDACs, respectively. Further studies are required to address the effects of dynamic interactions between Ets1 and its partners on the regulation of transcriptional activity during embryonic development. It should be mentioned that we focused on id3 expression to illustrate the regulatory mechanism of Ets1 for mediating the output of BMP signaling. The NC development is a rather sophisticated process, and many factors are involved in this multistep development event. In addition to id3, other genes responding to the BMP signal could also be regulated by interaction of Ets1 and HDAC1, serving one of the mechanisms during NC development.
In summary, our data indicated that optimal levels of Ets1 are essential for NC formation and migration and that Ets1 regulates NC formation at least in part through mediating id3 expression. We further demonstrated for the first time that using a multivalent interaction mechanism Ets1 can attenuate outputs of BMP signaling epigenetically through interaction with HDAC1.
Author Contributions
C. W., R. K. T. K., W. S., and Y. X. performed experiments. X. C., Y. C., J. S., G. L., Y. D., and Z. C. analyzed the data. S. O. C., W. Y. C., and Y. D. provided analytical tools. H. Z. conceived and coordinated the study. C. W., Y. D., and H. Z. wrote the paper.
Acknowledgments
We thank Dr. Igor Dawid, Eddy M. De Robertis, Enrique Amaya, Eric Bellefroid, Jean-Pierre Saint-Jeannet, Roberto Mayor, and Wu Wei for the reagents used in this research.
This work is supported by Research Grants Council of Hong Kong Grants N_CUHK413/12 and CUHK480709 (to H. Z.) and N_CUHK432/12 (to Y. X.), the Lo Kwee-Seong Biomedical Research Fund (to H. Z.), and National Basic Research Program of China Grant 81200566 (to Y. D.). The authors declare that they have no conflicts of interest with the contents of this article.
- NC
- neural crest
- BMP
- bone morphogenetic protein
- co-IP
- co-immunoprecipitation
- DEX
- dexamethasone
- ETS
- E26 transformation-specific
- GR
- glucocorticoid receptor
- HDAC
- histone deacetylase
- MO
- morpholino antisense oligonucleotide
- NPB
- neural plate border
- TSA
- trichostatin A
- X-Gal
- 5-bromo-4-chloro-3-indolyl β-d-galactoside
- sncg
- γ-synuclein
- dnets1
- dominant negative ets1.
References
- 1. Le Douarin N., Kalcheim C. (1999) The Neural Crest, 2nd Ed., pp. 23–27, Cambridge University Press, Cambridge, UK [Google Scholar]
- 2. Cornell R. A., Eisen J. S. (2005) Notch in the pathway: the roles of Notch signaling in neural crest development. Semin. Cell Dev. Biol. 16, 663–672 [DOI] [PubMed] [Google Scholar]
- 3. Steventon B., Carmona-Fontaine C., Mayor R. (2005) Genetic network during neural crest induction: from cell specification to cell survival. Semin. Cell Dev. Biol. 16, 647–654 [DOI] [PubMed] [Google Scholar]
- 4. Huang X., Saint-Jeannet J. P. (2004) Induction of the neural crest and the opportunities of life on the edge. Dev. Biol. 275, 1–11 [DOI] [PubMed] [Google Scholar]
- 5. Yanfeng W., Saint-Jeannet J. P., Klein P. S. (2003) Wnt-frizzled signaling in the induction and differentiation of the neural crest. BioEssays 25, 317–325 [DOI] [PubMed] [Google Scholar]
- 6. Stuhlmiller T. J., García-Castro M. I. (2012) Current perspectives of the signaling pathways directing neural crest induction. Cell. Mol. Life Sci. 69, 3715–3737 [DOI] [PMC free article] [PubMed] [Google Scholar]
- 7. Monsoro-Burq A. H., Wang E., Harland R. (2005) Msx1 and Pax3 cooperate to mediate FGF8 and WNT signals during Xenopus neural crest induction. Dev. Cell 8, 167–178 [DOI] [PubMed] [Google Scholar]
- 8. Sato T., Sasai N., Sasai Y. (2005) Neural crest determination by co-activation of Pax3 and Zic1 genes in Xenopus ectoderm. Development 132, 2355–2363 [DOI] [PubMed] [Google Scholar]
- 9. Milet C., Maczkowiak F., Roche D. D., Monsoro-Burq A. H. (2013) Pax3 and Zic1 drive induction and differentiation of multipotent, migratory, and functional neural crest in Xenopus embryos. Proc. Natl. Acad. Sci. U.S.A. 110, 5528–5533 [DOI] [PMC free article] [PubMed] [Google Scholar]
- 10. Bellmeyer A., Krase J., Lindgren J., LaBonne C. (2003) The protooncogene c-myc is an essential regulator of neural crest formation in Xenopus. Dev Cell 4, 827–839 [DOI] [PubMed] [Google Scholar]
- 11. Kos R., Reedy M. V., Johnson R. L., Erickson C. A. (2001) The winged-helix transcription factor FoxD3 is important for establishing the neural crest lineage and repressing melanogenesis in avian embryos. Development 128, 1467–1479 [DOI] [PubMed] [Google Scholar]
- 12. Pohl B. S., Knöchel W. (2001) Overexpression of the transcriptional repressor FoxD3 prevents neural crest formation in Xenopus embryos. Mech. Dev. 103, 93–106 [DOI] [PubMed] [Google Scholar]
- 13. Spokony R. F., Aoki Y., Saint-Germain N., Magner-Fink E., Saint-Jeannet J. P. (2002) The transcription factor Sox9 is required for cranial neural crest development in Xenopus. Development 129, 421–432 [DOI] [PubMed] [Google Scholar]
- 14. Essex L. J., Mayor R., Sargent M. G. (1993) Expression of Xenopus snail in mesoderm and prospective neural fold ectoderm. Dev. Dyn. 198, 108–122 [DOI] [PubMed] [Google Scholar]
- 15. Mayor R., Essex L. J., Bennett M. F., Sargent M. G. (1993) Distinct elements of the xsna promoter are required for mesodermal and ectodermal expression. Development 119, 661–671 [DOI] [PubMed] [Google Scholar]
- 16. Mayor R., Morgan R., Sargent M. G. (1995) Induction of the prospective neural crest of Xenopus. Development 121, 767–777 [DOI] [PubMed] [Google Scholar]
- 17. Luo T., Lee Y. H., Saint-Jeannet J. P., Sargent T. D. (2003) Induction of neural crest in Xenopus by transcription factor AP2α. Proc. Natl. Acad. Sci. U.S.A. 100, 532–537 [DOI] [PMC free article] [PubMed] [Google Scholar]
- 18. Light W., Vernon A. E., Lasorella A., Iavarone A., LaBonne C. (2005) Xenopus Id3 is required downstream of Myc for the formation of multipotent neural crest progenitor cells. Development 132, 1831–1841 [DOI] [PubMed] [Google Scholar]
- 19. Kee Y., Bronner-Fraser M. (2005) To proliferate or to die: role of Id3 in cell cycle progression and survival of neural crest progenitors. Genes Dev. 19, 744–755 [DOI] [PMC free article] [PubMed] [Google Scholar]
- 20. Sauka-Spengler T., Bronner-Fraser M. (2008) A gene regulatory network orchestrates neural crest formation. Nat. Rev. Mol. Cell Biol. 9, 557–568 [DOI] [PubMed] [Google Scholar]
- 21. Marchant L., Linker C., Ruiz P., Guerrero N., Mayor R. (1998) The inductive properties of mesoderm suggest that the neural crest cells are specified by a BMP gradient. Dev. Biol. 198, 319–329 [PubMed] [Google Scholar]
- 22. LaBonne C., Bronner-Fraser M. (1998) Neural crest induction in Xenopus: evidence for a two-signal model. Development 125, 2403–2414 [DOI] [PubMed] [Google Scholar]
- 23. Saint-Jeannet J. P., He X., Varmus H. E., Dawid I. B. (1997) Regulation of dorsal fate in the neuraxis by Wnt-1 and Wnt-3a. Proc. Natl. Acad. Sci. U.S.A. 94, 13713–13718 [DOI] [PMC free article] [PubMed] [Google Scholar]
- 24. Steventon B., Araya C., Linker C., Kuriyama S., Mayor R. (2009) Differential requirements of BMP and Wnt signalling during gastrulation and neurulation define two steps in neural crest induction. Development 136, 771–779 [DOI] [PMC free article] [PubMed] [Google Scholar]
- 25. Wu M. Y., Ramel M. C., Howell M., Hill C. S. (2011) SNW1 is a critical regulator of spatial BMP activity, neural plate border formation, and neural crest specification in vertebrate embryos. PLoS Biol. 9, e1000593. [DOI] [PMC free article] [PubMed] [Google Scholar]
- 26. von Bubnoff A., Peiffer D. A., Blitz I. L., Hayata T., Ogata S., Zeng Q., Trunnell M., Cho K. W. (2005) Phylogenetic footprinting and genome scanning identify vertebrate BMP response elements and new target genes. Dev. Biol. 281, 210–226 [DOI] [PubMed] [Google Scholar]
- 27. Haberland M., Mokalled M. H., Montgomery R. L., Olson E. N. (2009) Epigenetic control of skull morphogenesis by histone deacetylase 8. Genes Dev. 23, 1625–1630 [DOI] [PMC free article] [PubMed] [Google Scholar]
- 28. Lee P. C., Taylor-Jaffe K. M., Nordin K. M., Prasad M. S., Lander R. M., LaBonne C. (2012) SUMOylated SoxE factors recruit Grg4 and function as transcriptional repressors in the neural crest. J. Cell Biol. 198, 799–813 [DOI] [PMC free article] [PubMed] [Google Scholar]
- 29. Dittmer J. (2003) The biology of the Ets1 proto-oncogene. Mol. Cancer 2, 29. [DOI] [PMC free article] [PubMed] [Google Scholar]
- 30. Meyer D., Durliat M., Senan F., Wolff M., Andre M., Hourdry J., Remy P. (1997) Ets-1 and Ets-2 proto-oncogenes exhibit differential and restricted expression patterns during Xenopus laevis oogenesis and embryogenesis. Int. J. Dev. Biol. 41, 607–620 [PubMed] [Google Scholar]
- 31. Barembaum M., Bronner M. E. (2013) Identification and dissection of a key enhancer mediating cranial neural crest specific expression of transcription factor, Ets-1. Dev. Biol. 382, 567–575 [DOI] [PMC free article] [PubMed] [Google Scholar]
- 32. Gao Z., Kim G. H., Mackinnon A. C., Flagg A. E., Bassett B., Earley J. U., Svensson E. C. (2010) Ets1 is required for proper migration and differentiation of the cardiac neural crest. Development 137, 1543–1551 [DOI] [PMC free article] [PubMed] [Google Scholar]
- 33. Théveneau E., Duband J. L., Altabef M. (2007) Ets-1 confers cranial features on neural crest delamination. PLoS One 2, e1142. [DOI] [PMC free article] [PubMed] [Google Scholar]
- 34. Betancur P., Bronner-Fraser M., Sauka-Spengler T. (2010) Genomic code for Sox10 activation reveals a key regulatory enhancer for cranial neural crest. Proc. Natl. Acad. Sci. U.S.A. 107, 3570–3575 [DOI] [PMC free article] [PubMed] [Google Scholar]
- 35. Wang C., Liu Y., Chan W. Y., Chan S. O., Grunz H., Zhao H. (2011) Characterization of three synuclein genes in Xenopus laevis. Dev. Dyn. 240, 2028–2033 [DOI] [PubMed] [Google Scholar]
- 36. Nieuwkoop P. D., Faber J. (1967) Normal Table of Xenopus laevis (Daudin), Garland Publishing Inc., New York [Google Scholar]
- 37. Zhao H., Cao Y., Grunz H. (2001) Isolation and characterization of a Xenopus gene (XMLP) encoding a MARCKS-like protein. Int. J. Dev. Biol. 45, 817–826 [PubMed] [Google Scholar]
- 38. Harland R. M. (1991) In situ hybridization: an improved whole-mount method for Xenopus embryos. Methods Cell Biol. 36, 685–695 [DOI] [PubMed] [Google Scholar]
- 39. Pasqualetti M., Ori M., Nardi I., Rijli F. M. (2000) Ectopic Hoxa2 induction after neural crest migration results in homeosis of jaw elements in Xenopus. Development 127, 5367–5378 [DOI] [PubMed] [Google Scholar]
- 40. Zhao H., Tanegashima K., Ro H., Dawid I. B. (2008) Lrig3 regulates neural crest formation in Xenopus by modulating Fgf and Wnt signaling pathways. Development 135, 1283–1293 [DOI] [PMC free article] [PubMed] [Google Scholar]
- 41. Akkers R. C., Jacobi U. G., Veenstra G. J. (2012) Chromatin immunoprecipitation analysis of Xenopus embryos. Methods Mol. Biol. 917, 279–292 [DOI] [PubMed] [Google Scholar]
- 42. Nelson J. D., Denisenko O., Bomsztyk K. (2006) Protocol for the fast chromatin immunoprecipitation (ChIP) method. Nat. Protoc. 1, 179–185 [DOI] [PubMed] [Google Scholar]
- 43. Kiyota T., Kato A., Kato Y. (2007) Ets-1 regulates radial glia formation during vertebrate embryogenesis. Organogenesis 3, 93–101 [DOI] [PMC free article] [PubMed] [Google Scholar]
- 44. Aoki Y., Saint-Germain N., Gyda M., Magner-Fink E., Lee Y. H., Credidio C., Saint-Jeannet J. P. (2003) Sox10 regulates the development of neural crest-derived melanocytes in Xenopus. Dev. Biol. 259, 19–33 [DOI] [PubMed] [Google Scholar]
- 45. Monsoro-Burq A. H., Fletcher R. B., Harland R. M. (2003) Neural crest induction by paraxial mesoderm in Xenopus embryos requires FGF signals. Development 130, 3111–3124 [DOI] [PubMed] [Google Scholar]
- 46. Hong C. S., Park B. Y., Saint-Jeannet J. P. (2008) Fgf8a induces neural crest indirectly through the activation of Wnt8 in the paraxial mesoderm. Development 135, 3903–3910 [DOI] [PMC free article] [PubMed] [Google Scholar]
- 47. Schumacher J. A., Hashiguchi M., Nguyen V. H., Mullins M. C. (2011) An intermediate level of BMP signaling directly specifies cranial neural crest progenitor cells in zebrafish. PLoS One 6, e27403. [DOI] [PMC free article] [PubMed] [Google Scholar]
- 48. Tropepe V., Li S., Dickinson A., Gamse J. T., Sive H. L. (2006) Identification of a BMP inhibitor-responsive promoter module required for expression of the early neural gene zic1. Dev. Biol. 289, 517–529 [DOI] [PubMed] [Google Scholar]
- 49. Nichane M., Ren X., Bellefroid E. J. (2010) Self-regulation of Stat3 activity coordinates cell-cycle progression and neural crest specification. EMBO J. 29, 55–67 [DOI] [PMC free article] [PubMed] [Google Scholar]
- 50. Nichane M., de Crozé N., Ren X., Souopgui J., Monsoro-Burq A. H., Bellefroid E. J. (2008) Hairy2-Id3 interactions play an essential role in Xenopus neural crest progenitor specification. Dev. Biol. 322, 355–367 [DOI] [PubMed] [Google Scholar]
- 51. Morikawa M., Koinuma D., Tsutsumi S., Vasilaki E., Kanki Y., Heldin C. H., Aburatani H., Miyazono K. (2011) ChIP-seq reveals cell type-specific binding patterns of BMP-specific Smads and a novel binding motif. Nucleic Acids Res. 39, 8712–8727 [DOI] [PMC free article] [PubMed] [Google Scholar]
- 52. Lee C. G., Kwon H. K., Sahoo A., Hwang W., So J. S., Hwang J. S., Chae C. S., Kim G. C., Kim J. E., So H. S., Hwang E. S., Grenningloh R., Ho I. C., Im S. H. (2012) Interaction of Ets-1 with HDAC1 represses IL-10 expression in Th1 cells. J. Immunol. 188, 2244–2253 [DOI] [PubMed] [Google Scholar]
- 53. de Crozé N., Maczkowiak F., Monsoro-Burq A. H. (2011) Reiterative AP2a activity controls sequential steps in the neural crest gene regulatory network. Proc. Natl. Acad. Sci. U.S.A. 108, 155–160 [DOI] [PMC free article] [PubMed] [Google Scholar]
- 54. Tahtakran S. A., Selleck M. A. (2003) Ets-1 expression is associated with cranial neural crest migration and vasculogenesis in the chick embryo. Gene Expr. Patterns 3, 455–458 [DOI] [PubMed] [Google Scholar]
- 55. Patthey C., Edlund T., Gunhaga L. (2009) Wnt-regulated temporal control of BMP exposure directs the choice between neural plate border and epidermal fate. Development 136, 73–83 [DOI] [PubMed] [Google Scholar]
- 56. Lee H. Y., Kléber M., Hari L., Brault V., Suter U., Taketo M. M., Kemler R., Sommer L. (2004) Instructive role of Wnt/β-catenin in sensory fate specification in neural crest stem cells. Science 303, 1020–1023 [DOI] [PubMed] [Google Scholar]
- 57. Kléber M., Lee H. Y., Wurdak H., Buchstaller J., Riccomagno M. M., Ittner L. M., Suter U., Epstein D. J., Sommer L. (2005) Neural crest stem cell maintenance by combinatorial Wnt and BMP signaling. J. Cell Biol. 169, 309–320 [DOI] [PMC free article] [PubMed] [Google Scholar]
- 58. Lee H. X., Ambrosio A. L., Reversade B., De Robertis E. M. (2006) Embryonic dorsal-ventral signaling: secreted frizzled-related proteins as inhibitors of tolloid proteinases. Cell 124, 147–159 [DOI] [PMC free article] [PubMed] [Google Scholar]
- 59. Hayashi M., Nimura K., Kashiwagi K., Harada T., Takaoka K., Kato H., Tamai K., Kaneda Y. (2007) Comparative roles of Twist-1 and Id1 in transcriptional regulation by BMP signaling. J. Cell Sci. 120, 1350–1357 [DOI] [PubMed] [Google Scholar]
- 60. Yang S. H., Vickers E., Brehm A., Kouzarides T., Sharrocks A. D. (2001) Temporal recruitment of the mSin3A-histone deacetylase corepressor complex to the ETS domain transcription factor Elk-1. Mol. Cell. Biol. 21, 2802–2814 [DOI] [PMC free article] [PubMed] [Google Scholar]
- 61. Jayaraman G., Srinivas R., Duggan C., Ferreira E., Swaminathan S., Somasundaram K., Williams J., Hauser C., Kurkinen M., Dhar R., Weitzman S., Buttice G., Thimmapaya B. (1999) p300/cAMP-responsive element-binding protein interactions with ets-1 and ets-2 in the transcriptional activation of the human stromelysin promoter. J. Biol. Chem. 274, 17342–17352 [DOI] [PubMed] [Google Scholar]
- 62. Yang C., Shapiro L. H., Rivera M., Kumar A., Brindle P. K. (1998) A role for CREB binding protein and p300 transcriptional coactivators in Ets-1 transactivation functions. Mol. Cell. Biol. 18, 2218–2229 [DOI] [PMC free article] [PubMed] [Google Scholar]